IR Phonon signatures of multiferroicity in TbMn2O5
Abstract
The infrared (IR) active phonons in multiferroic TbMn2O5 are studied as a function of temperature. Most of the symmetry allowed IR modes polarized along the a and b crystal axes are observed and the behavior of several b polarized phonons is correlated with the magnetic and ferroelectric transitions. A high frequency b polarized phonon only Raman allowed in the paraelectric phase becomes IR active at the ferroelectric transition. The IR strength of this mode is proportional to the square of the ferroelectric order parameter and gives a sensitive measure of the symmetry lowering lattice distortions in the ferroelectric phase.
pacs:
78.30.-j 63.20.Ls 75.50.EeI Introduction
Materials that exhibit simultaneously (anti)-ferromagnetic, (anti)-ferroelectric or (anti)-ferroelastic degrees of freedom, the so called multiferroics, have become of increasing interest because they offer great possibilities for applications in multifunctional devices. These applications are specially based on the power to control the magnetic state by electric fields and the ferroelectric state by magnetic fields, this type of materials being the magnetoelectrics, a subclass of the multiferroics Hill and Filippetti (2002); Fiebig et al. (2005); Prellier et al. (2005); Binek and Doudin (2005). Moreover, the understanding of the basic mechanism that allows this behavior is important in the development of the devices that make use of these characteristics.
The interplay of these degrees of freedom has been demonstrated recently in several multiferroic materials such as RMn2O5 where R is Eu, Gd, Tb, Dy, Ho and Y Popov et al. (2002); Hur et al. (2004a, b); Golovenchits and Sanina (2004); Higashiyama et al. (2004) as well as in TbMnO3 Kimura et al. (2003) and Ni3V2O8 Lawes et al. (2005). Fundamental questions as to the nature and characteristics of the coupling of the magnetic and ferroelectric orders remain unanswered. Phenomenological approaches Mostovoy (2006); Harris (2005) based on the Landau theory of phase transitions have been used to relate the symmetry of the spin order with the appearance of ferroelectricity. The basic conclusion of these proposals is that the non-collinearity of the spin system is crucial in the development of ferroelectric order. More microscopic studies Katsura et al. (2005); Sergienko and Dagotto (2006) have also pointed to the importance of non-collinearity of the spin system.
The antiferromagnetic manganese oxide TbMn2O5 (orthorhombic space group Pbam # 55, Z = 4) is a multiferroic with non-collinear magnetic order Chapon et al. (2004) that shows a strong magnetoelectric coupling effect Hur et al. (2004a): an applied magnetic field along the a axis changes the sign of the electrical polarization present along the b axis. The dielectric constant along the b axis has anomalies associated with the distinct phase transitions at low temperatures (see figure 1 in Hur, et al Hur et al. (2004a)): at the Néel temperature TN 42 K no anomalies are present in . There is a paraelectric to ferroelectric phase transition at TC 38 K evident by a peak in the dielectric constant. The magnetic order then locks in to a commensurate structure (CM) with wave vector (1/2,0,1/4). At T 24 K the magnetic order transforms into an incommensurate structure (ICM) with a step-like feature in ; this anomaly is also accompanied by hysteresis Hur et al. (2004a). We note that the dielectric constants along the a and c axis show no significant effects at these phase transitions.
In EuMn2O5 Polyakov, et al Polyakov et al. (2001) found displacements of the Mn3+ ion along the a axis at the ferroelectric transition. They suggested that this behavior leads to a change in symmetry from the space group Pbam to the non-centrosymmetric group P21am (# 26). In a analogous work on the compound YMn2O5 Kagomiya et al. (2002), Kagomiya, et al proposed similar displacements at the ferroelectric transition. The displacements reported are very small ( Å), which hints to a different origin of the ferroelectricity when compared to the typical proper ferroelectrics. Other structural works Chapon et al. (2004); Blake et al. (2005); Chapon et al. (2006) have not reported any signature of atomic displacements at the ferroelectric phase transition in this family of compounds. Moreover, Mihailova, et al Mihailova et al. (2005) reported a Raman study in HoMn2O5 and TbMn2O5 and García-Flores, et al García-Flores et al. (2006) in BiMn2O5, EuMn2O5 and DyMn2O5 as a function of temperature and found no evidence of anomalous behavior of the Raman active phonons at the ferroelectric transition temperature. Nevertheless, the existence of a macroscopic dipole moment is evidence of the lack of inversion symmetry in the FE phase, and motivates the study of the dynamics of the lattice to look for further information about the structural changes.
In this report we present a study of the temperature dependent infrared (IR) phonon spectra of the multiferroic TbMn2O5. The most interesting feature we find is the appearance of an IR inactive phonon activated at the ferroelectric transition with light polarization parallel to the static ferroelectric polarization (). This indicates that one IR forbidden mode (Raman or silent) in the paraelectric phase acquires an electric-dipole moment due to the static displacement associated with the ferroelectricity. We identify this phonon with a Raman Mn-O stretching mode, which accounts for its sensitivity to the static polarization possibly induced by the Mn spin system. Chapon et al. (2006); Mostovoy (2006).
II Experimental Results
Single crystals of TbMn2O5 were grown using B2O3/PbO/PbF2 flux in a Pt crucible. The flux was held at 1,280 ∘C for 15 hours and slowly cooled down to 950 ∘C at a rate of 1 ∘C per hour. Crystals grew in the form of black platelets as well as cubes with a typical size of 10 mm3 with a working diameter of 5 mm. The crystals were characterized and oriented using x-ray diffraction at room temperature. Normal incidence reflection spectra were taken with a Bomem Fourier Transform Spectrometer DA3.02. Light was polarized along the a and b crystal axes in the frequency range 8-800 cm-1 ( 1-100 meV) and in the temperature range 7 to 300 K. Sample was kept in vacuum in a continuous He flow cryostat with optical access windows. The factor group analysis based on structural data by Alonso, et al Alonso et al. (1997) of the paraelectric phase gives the following IR active vibrational modes at the point: identical to a previous report Mihailova et al. (2005). We complemented this analysis with a shell model calculation of the phonon dispersion.
| a | b | a | b | a | b | ||||||
|---|---|---|---|---|---|---|---|---|---|---|---|
| T1 | T2 | T1 | T2 | T1 | T2 | T1 | T2 | T1 | T2 | T1 | T2 |
| 111.9 | 111.7 | 97.2 | 96.4 | 0.59 | 0.66 | 0.42 | 0.38 | 1.9 | 2 | 3.3 | 3.7 |
| 157.5 | 157.3 | 168.9 | 168.6 | 0.81 | 1.05 | 0.46 | 0.43 | 0.9 | 0.3 | 1 | 1.1 |
| 164.2 | 163.8 | 171.9 | 171.5 | 1.68 | 2.02 | 0.30 | 0.35 | 3.3 | 2.6 | 1.4 | 1.5 |
| 218.5 | 217.4 | 222.2 | 221.9 | 0.30 | 0.69 | 0.11 | 0.11 | 4.7 | 8.9 | 2.4 | 2.9 |
| 254.8 | 253.2 | 256.8 | 256.6 | 1.88 | 2.56 | 0.17 | 0.18 | 3.1 | 1.5 | 2.1 | 2 |
| 333.1 | 332.4 | 333.4 | 332.7 | 0.09 | 0.15 | 0.17 | 0.17 | 2.7 | 2.6 | 2.7 | 2.7 |
| 364.9 | 362.8 | 386 | 385.5 | 2.02 | 2.75 | 0.02 | 0.01 | 3.9 | 1 | 3.5 | 4 |
| 397.6 | 396.5 | 422.3 | 422.3 | 0.38 | 0.46 | 0.28 | 0.28 | 4.6 | 3.2 | 4 | 3.5 |
| 494.8 | 493.9 | 453.2 | 459.3 | 0.45 | 0.59 | 3.43 | 3.56 | 5.3 | 3.7 | 18.4 | 6.7 |
| 613.5 | 611.3 | 481.8 | 483 | 0.71 | 1.11 | 2.86 | 2.6 | 9 | 5.4 | 4.4 | 3.3 |
| 627.5 | 625.9 | 538.2 | 537.6 | 0.23 | 0.14 | 0.25 | 0.51 | 8.4 | 4.2 | 7.3 | 7.1 |
| 704.2 | 701.4 | 567.3 | 568.4 | 0.05 | 0.04 | 0.52 | 0.57 | 3.3 | 4.5 | 5.1 | 7.9 |
| — | — | 636.6 | 637.2 | — | — | 0.27 | 0.23 | — | — | 10.7 | 9.3 |
| — | — | 688.2 | 686.9 | — | — | 0.003 | 0.003 | — | — | 9.5 | 6 |
| — | — | 703111Previously IR inactive | — | — | — | 0.001 | — | — | — | 7 | — |
| — | — | 120.4222Crystal field excitation fitted as electric dipole active | 119.5 | — | — | 0.12 | 0.10 | — | — | 5.7 | 6.4 |
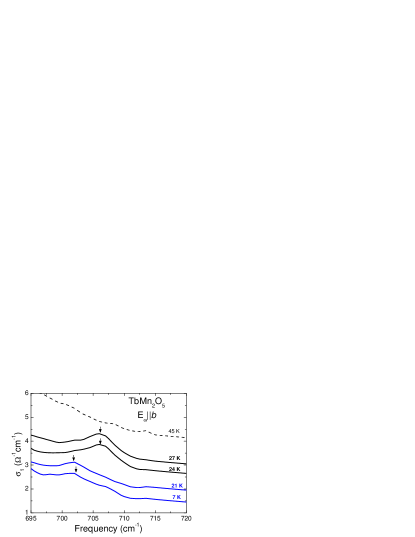
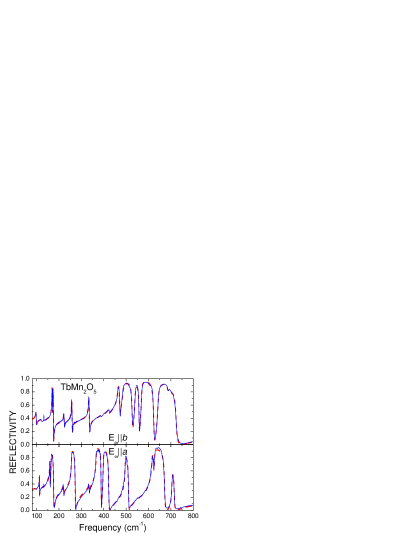
Figure 1 shows the spectra at T = 7 K. Twelve of the 14 IR active phonons in the a polarization were reliably observed, whereas all 14 phonons polarized along b are present in the spectrum. The reflectivity spectra was fitted in a least squares procedure using the sum of Lorentzian form of the model dielectric function , given by:
| (1) |
where is the dielectric constant at high frequency and the phonon parameters , and are the phonon frequency, the spectral weight and the linewidth respectively, we also define where is the contribution of the phonon to the static dielectric function; these parameters are extracted as functions of temperature and are displayed in table 1. The result of the fitting is also shown in figure 1 and it can be seen that it is almost indistinguishable from the data indicating the weakness of higher order phonon processes.
We obtained the optical conductivity using the Kramers-Kronig transform of the reflectivity spectrum. Figure 2 shows the optical conductivity around 700 cm-1 for several temperatures with . We observe that a feature not present at 45 K appears in the low T phases. The temperature dependence of the spectral weight and frequency of this feature are plotted in figure 3 where we see the spectral weight starting to appear at 38 K. for this phonon was obtained by directly integrating the optical conductivity between 695 and 710 cm-1. The spectral weight of this phonon increases and its frequency shifts, both continuously, as we lower the temperature. Around 24 K both abruptly change and show hysteresis around this point evident by the difference in the cooling and warming curves. The behavior of this feature is correlated with the second order FE transition at 38 K and the first order CM ICM transition at 24 K in this compound. The static polarization plotted in figure 3 was obtained by measuring the temperature dependence of the pyroelectric current on a similar sample to the one used in the optical measurements.
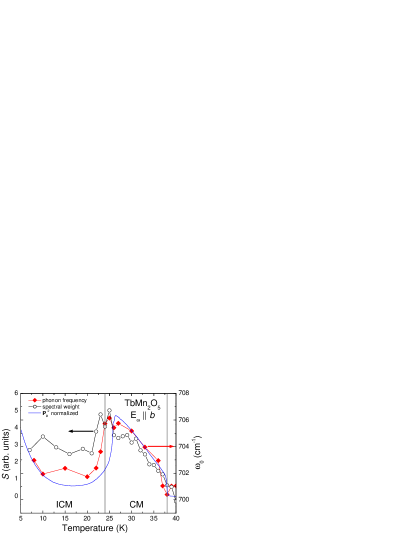
On very general grounds we can relate the appearance and behavior of this phonon to these underlying phase transitions. Since the lattice distortions associated with these phase transitions are very small we can expand the spectral weight and frequency shifts in powers of . The quadratic term is the first non-zero term in this expansion that can describe the spectral weight change or frequency shift. Similarly, the order parameters associated with the new phases are proportional to so that . As a result we expect that the spectral weight behavior and frequency shift should be , . This is the observed behavior as can be seen in figure 3 where we have plotted with the phonon data. At low temperatures (T 10 K) where the Tb moment orders, the phonon data deviates from suggesting that it is the Mn and oxygen ion displacements that dominate the dynamics of this high frequency phonon. The possible scenarios for the appearance of a new phonon are: (1) zone folding of the phonon dispersion (since the magnetic order corresponds to a lock in ICM CM transition with ), and (2) activation of IR-inactive phonons at this transition due to the loss of inversion symmetry. Our shell model calculation shows that the dispersion of the high frequency phonon is negative so that no zone-folded mode can give the high frequency of this phonon. We therefore conclude that this phonon is a previously IR inactive phonon that acquires electric dipole moment at the FE transition.
| # 55 S. A. | # 55 irreps | # 26 irreps | #26 S. A.333Note that in this column x, y, z correspond to the high temperature system of coordinates a, b, c and differ from what is found in the character table. |
| R | IR (y) & R | ||
| R | IR (x) & R | ||
| R | R | ||
| R | IR (z) & R | ||
| Silent | R | ||
| IR(z) | IR (z) & R | ||
| IR(y) | IR (y) & R | ||
| IR(x) | IR (x) & R |
In a ferroelectric phase transition, where inversion symmetry is lost, symmetry considerations dictate that phonons that were not IR active in the paraelectric phase can become IR active in the FE phase. This is the case in TbMn2O5, where the low T phase has mixed IR and Raman phonons. In this low T phase the phonons of the high T symmetry group split as shown in table 2 Sym . This splitting was obtained by considering what symmetry operation is maintained in both phases and then assign spectral activity according to the experimental observations. The assumption was made as well that the low T space group is as proposed by Polyakov, et al Polyakov et al. (2001) and Kagomiya, et al Kagomiya et al. (2002). Consistency with the laboratory frame (x , y , z ) is applied as well. From the reports by Mihailova, et al. Mihailova et al. (2005) and García-Flores, et al. García-Flores et al. (2006) we learn that a mode at frequency 700 cm-1 exists in all the RMn2O5 materials whose Raman phonons have been reported. We note as well that these reports do not resolve any IR phonons becoming Raman active at the FE phase transition. We conclude that this high frequency Raman phonon is the mode we observe that acquires IR activity in the FE phase. Further experimental confirmation in the Raman spectrum is needed to make a definitive identification.
Only a few other phonons show correlations with the low temperature phase transitions. The phonons polarized along the a axis do not show any significant anomalies in this temperature range. This is consistent with the featureless behavior of the dielectric function along this axis. On the other hand, the behavior of some of the phonons with dipole moment along b is non-trivial. The low frequency phonon with frequency 96 cm-1, identified primarily with movement of the Tb ions, has a temperature dependence that correlates with the low temperature CM ICM magnetic transition. In figure 4 the frequency of this phonon is plotted versus temperature and we observe an increase in the frequency around 24 K. This effect is thought to be a manifestation of the coupling of this phonon to a magnon as is discussed by Katsura, et al Katsura et al. (2006). Further experimental results on this effect will be presented elsewhere Sushkov et al. .
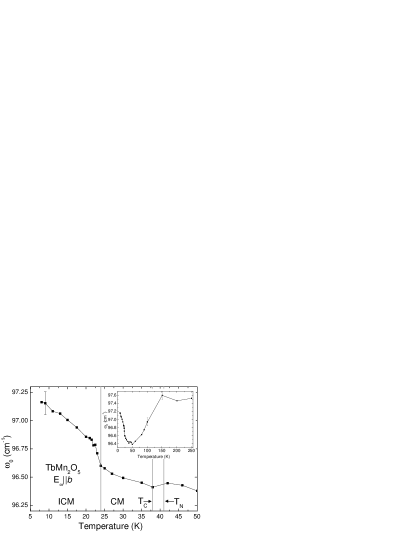
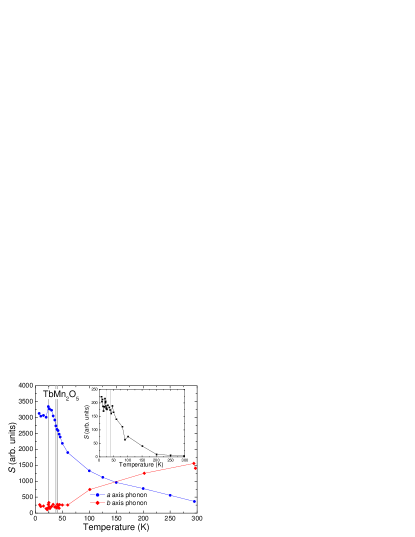
Surprisingly several phonons show interesting temperature dependence for T above TN. The inset in figure 4 shows the full temperature dependence of the frequency of the b axis phonon. The anomalous softening in the temperature range of 150 K to 50 K demonstrates additional effects in the dynamics of the lattice. In figure 5 the behavior of the spectral weight of two oxygen phonons polarized in the a and b axes, with frequencies of 704 and 689 cm-1 respectively, seems complementary: the a phonon gains spectral weight while the b phonon looses it as the temperature is lowered. This effect is present in the full temperature range from 300 K to 7 K, while for the rest of the phonons the spectral weight is only changed significantly around the various transition temperatures. The fact that these modes gain or lose so much spectral weight (10 and 6-fold respectively) in a large temperature interval also demonstrates some higher energy scale in this system. These effects (the anomalous softening and the dramatic changes in spectral weight) are not understood at present. However, one interesting possibility is that they are of magnetic character. Recent high temperature susceptibility measurements García-Flores et al. (2006) in BiMn2O5 has shown evidence for spin frustrated behavior from deviations from Curie law with a Weiss temperature of 250 K. Dielectric anomalies in BiMn2O5 around this temperature have been reported Golovenchits et al. (1997) as well.
Finally the inset of figure 5 shows the temperature dependence of the intensity of a feature observed at 120 cm-1. This is identified as a crystal field level of the Tb 3+ ion Gingras et al. (2000). This transition has electric dipole character as is seen from the form of the reflectivity curve (see fig. 1) as well as the fact that the spectral weight (see table 1) is comparable to the IR active phonons (magnetic dipole transitions are usually much weaker than electric dipole transitions). This conclusion is supported as well by the shell model calculation that shows the 3 lowest phonon excitations being the Tb-dominated phonon (at 100 cm-1) and then a doublet (at 170 cm-1). Furthermore, the observed temperature dependence of the intensity is common for the f-level crystal field transitions in the rare earth ions Jandl (2006). Several other absorption features are observed in transmission at lower frequencies and will be reported elsewhere Sushkov et al. .
III Conclusions
We have measured the IR phonon spectra in TbMn2O5 along the a and b axes and have observed most of the symmetry allowed modes. The majority of the phonons do not show significant correlations to the FE and AFM phase transitions of the system. However several phonons exhibit interesting correlations to the ferroelectricity of this material. We have found a signature of the loss of inversion symmetry in the FE phase by the appearance of a IR phonon below that was only Raman active in the paraelectric phase. The strength of this mode is proportional to the square of the FE order parameter and gives a sensitive measure of the symmetry lowering lattice distortions in the ferroelectric phase. In addition, the lowest frequency phonon (along b) displays hardening in the CM ICM transition possibly due to the coupling with the spin system Katsura et al. (2006); 2 modes (along a and b) have dramatic changes in their spectral weight over a wide temperature range possibly because of frustration effects in the spin system. We have also identified an electric dipole active crystal field transition of the Tb3+ ion in the phonon frequency range.
IV Acknowledgements
We thank G-W. Chern, D.I. Khomskii, S. Jandl, J. Simpson and O. Tchernyshyov for useful discussions. This work was supported by the National Science Foundation MRSEC under Grant No. DMR-0520471.
References
- Hill and Filippetti (2002) N. A. Hill and A. Filippetti, J. Mag. Mag. Mat. 242-245, 976 (2002).
- Fiebig et al. (2005) M. Fiebig, T. Lottermoser, T. Lonkai, A. V. Goltsev, and R. V. Pisarev, J. Mag. Mag. Mat. 290-291, 883 (2005).
- Prellier et al. (2005) W. Prellier, M. P. Singh, and P. Murugavel, J. Phys. Condens. Matter 17, R803 (2005).
- Binek and Doudin (2005) C. Binek and B. Doudin, J. Phys. Condens. Matter 17, L39 (2005).
- Popov et al. (2002) Y. F. Popov, A. M. Kadomtseva, S. S. Krotov, G. P. Vorob’ev, and M. M. Lukina, Ferroelectrics 279, 147 (2002).
- Hur et al. (2004a) N. Hur, S. Park, P. Sharma, J. Ahn, S. Guha, and S.-W. Cheong, Nature 429, 392 (2004a).
- Hur et al. (2004b) N. Hur, S. Park, P. A. Sharma, S. Guha, and S.-W. Cheong, Phys. Rev. Lett. 93, 107207 (2004b).
- Golovenchits and Sanina (2004) E. Golovenchits and V. Sanina, J. Phys. Condens. Matter 16, 4325 (2004).
- Higashiyama et al. (2004) D. Higashiyama, S. Miyasaka, N. Kida, T. Arima, and Y. Tokura, Phys. Rev. B 70, 174405 (2004).
- Kimura et al. (2003) T. Kimura, T. Goto, H. Shintani, K. Ishizaka, T. Arima, and Y. Tokura, Nature 426, 55 (2003).
- Lawes et al. (2005) G. Lawes, A. B. Harris, T. Kimura, N. Rogado, R. J. Cava, A. Aharony, O. Entin-Wohlman, T. Yildrim, M. Kenzelmann, C. Broholm, et al., Phys. Rev. Lett. 95, 087205 (2005).
- Mostovoy (2006) M. Mostovoy, Phys. Rev. Lett. 96, 067601 (2006).
- Harris (2005) A. B. Harris (2005), eprint CondMat/0508730.
- Katsura et al. (2005) H. Katsura, N. Nagaosa, and A. V. Balatsky, Phys. Rev. Lett. 95, 057205 (2005).
- Sergienko and Dagotto (2006) I. A. Sergienko and E. Dagotto, Phys. Rev. B 73, 094434 (2006).
- Chapon et al. (2004) L. C. Chapon, G. R. Blake, M. J. Gutmann, S. Park, N. Hur, P. G. Radaelli, and S.-W. Cheong, Phys. Rev. Lett. 93, 177402 (2004).
- Polyakov et al. (2001) V. Polyakov, V. Plakhty, M. Bonnet, P. Burlet, L.-P. Regnault, S. Gavrilov, I. Zobkalo, and O. Smirnov, Physica B 297, 208 (2001).
- Kagomiya et al. (2002) I. Kagomiya, S. Matsumoto, K. Kohn, Y. Fukuda, T. Shoubu, H. Kimura, Y. Noda, and N. Ikeda, Ferroelectrics 286, 167 (2002).
- Blake et al. (2005) G. R. Blake, L. C. Chapon, P. G. Radaelli, S. Park, N. Hur, S.-W. Cheong, and J. Rodríguez-Carvajal, Phys. Rev. B 71, 214402 (2005).
- Chapon et al. (2006) L. C. Chapon, P. G. Radaelli, G. R. Blake, S. Park, and S.-W. Cheong, Phys. Rev. Lett. 96, 097601 (2006).
- Mihailova et al. (2005) B. Mihailova, M. M. Gospodinov, B. Guttler, F. Yen, A. P. Litvinchuk, and M. N. Iliev, Phys. Rev. B 71, 172301 (2005).
- García-Flores et al. (2006) A. F. García-Flores, E. Granado, H. Martinho, R. R. Urbano, C. Rettori, E. I. Golovenchits, V. A. Sanina, S. B. Oseroff, S. Park, and S.-W. Cheong, Phys. Rev. B 73, 104411 (2006).
- Alonso et al. (1997) J. Alonso, M. Casais, M. Martínez-Lope, J. Martínez, and M. Fernández-Díaz, J. Phys. Condens. Matter 9, 8515 (1997).
- (24) The exact space group for the FE phase in TbMn2O5 is not known precisely. We have made the assumption of space group # 26 following Polyakov, et al Polyakov et al. (2001) and Kagomiya, et al Kagomiya et al. (2002), because this allows to write the direct transformation of each phonon for both space groups. Nevertheless, even if the real crystallographic structure is different, such as the modulated structure in DyMn2O5Higashiyama et al. (2004), our experimental observation and analysis would not change.
- Katsura et al. (2006) H. Katsura, A. V. Balatsky, and N. Nagaosa (2006), eprint CondMat/0602547.
- (26) A. B. Sushkov, R. Valdés Aguilar, S.-W. Cheong, S. Park, and H. D. Drew, unpublished.
- Golovenchits et al. (1997) E. I. Golovenchits, V. A. Sanin, and A. V. Babinskiĭ, JETP 85, 156 (1997).
- Gingras et al. (2000) M. J. P. Gingras, B. C. den Hertog, M. Faucher, J. S. Gardner, S. R. Dunsiger, L. J. Chang, B. D. Gaulin, N. P. Raju, and J. E. Greedan, Phys. Rev. B 62, 6496 (2000).
- Jandl (2006) S. Jandl, private communication (2006).