Plastic Response of a 2D Lennard-Jones amorphous solid:
Detailed analysis of the local rearrangements at very slow strain-rate.
Abstract
We analyze in details the atomistic response of a model amorphous material submitted to plastic shear in the athermal, quasistatic limit. After a linear stress-strain behavior, the system undergoes a noisy plastic flow. We show that the plastic flow is spatially heterogeneous. Two kinds of plastic events occur in the system: quadrupolar localized rearrangements, and shear bands. The analysis of the individual motion of a particle shows also two regimes: a hyper-diffusive regime followed by a diffusive regime, even at zero temperature.
pacs:
61.43.Er, 62.20.-x, 62.20.FeI Introduction
During the last two decades, a large number of numerical studies livre ; tanguy02 ; tanguy02b ; tanguy04 ; tanguy05 ; maloneylemaitre ; maloney ; Weaire ; Maeda ; Varnik ; Rottler ; falklanger ; Malendro ; Schuh ; Nanda ; Bailey ; Stankovic ; depablo ; nagel ; goldenberg2002 ; cavaille ; roux ; vandembroucq ; Krishna ; picard has been devoted to the peculiar mechanical response of amorphous (disordered) materials. This keen interest can be related to the recent synthesis of metallic amorphous glasses Synthese whose mechanical properties compare very favorably to those of crystals with similar compositions livre ; Synthese ; Met1 ; Met2 ; Met3 ; Met4 . More generally, many “soft” materials (foams Argon ; kabla ; debregeas ; Dennin ; Kraynik ; FoamLiu ; FoamLiu2 ; cantat , granular packings grains ; HJH1 ; HJH2 ; HJH3 , pastes coussot ; coussotshear ; colloidal ), are also characterized by a disordered microscopic structure, and their mechanical and rheological properties are associated with deformations of this structure. They can be studied either as mesoscopic analogs of “hard” glasses, or in many cases for the intrinsic interest of their rheological properties.
Both the elastic and plastic response of amorphous materials are currently studied, numerically and experimentally. In the elastic limit, numerical investigations on model materials (Lennard-Jones glasses) have shown the essential role of a non-affine contribution to the displacement field. This contribution, which vanishes in a standard, homogeneous elastic material, is organized in rotational structures on a mesoscopic scale tanguy02 ; tanguy02b ; tanguy04 ; tanguy05 ; maloneylemaitre ; maloney ; Weaire . These rotational structures store a substantial part of the elastic energy, and are responsible for the low value of the measured shear modulus tanguy02b ; maloneylemaitre ; Weaire .
On the onset of plastic, irreversible deformation, important changes are observed in the non-affine displacement field. In contrast to the case of plasticity in crystals, the microscopic description of plasticity in amorphous materials is still incomplete and controversial livre ; Rottler ; falklanger ; Chaudhari . Some points are now well established. When the behavior becomes irreversible, that is after a “spinodal” (in the mechanical sense) limit has been reached by the system Malendro , the deviation from the affine response becomes localized tanguy05 ; maloney ; Maeda . This deviation was identified first by Argon Argon and described by Falk et al. falklanger in terms of “Shear Transformation Zones” (STZ). These “STZ” have been considered for a long time as elementary processes for a mean-field treatment of the visco-plastic behavior of foams and emulsions. In the case of foams, these local rearrangements are associated with T1 events Argon ; kabla ; debregeas ; Dennin ; Kraynik ; FoamLiu ; FoamLiu2 , while a precise identification of these rearrangements in molecular glasses (like the metallic glasses for example) is still a matter of debate Met3 . Experimentally, at a larger scale, the plastic flow of these disordered dense systems gives rise to a heterogeneous flow behavior, where a large shear band coexists often with a frozen region coussot ; coussotshear ; colloidal ; grains ; Met1 ; Met2 . Theoretically, it has been shown, using mesoscopic numerical models vandembroucq ; Krishna ; picard with long range elasticity, that individual plastic events (like the STZ) can concentrate statistically to create large scale fragile zones where the deformation of the system takes place. However, a multiscale description including a realistic description of the local plastic events is still lacking, and the present mesoscopic models are based on empirical assumptions for the occurrence and the shape of the local plastic rearrangements.
In this paper, we study in details the local plastic rearrangements occurring in a model Lennard-Jones glass submitted to a quasi-static shear, at zero-temperature. We first identify the elementary plastic processes, and there spatio-temporal statistical correlations. This part of our work is closely related to a recent study by Lemaître and Maloney maloneylemaitre ; maloney , and our results are consistent with their observations, while not described in the same way. We then study the diffusive behavior of an individual particle immersed in this plastic flow.
II Sample preparation and quasi-static deformation procedure
The systems we study are slightly polydisperse two-dimensional Lennard-Jones glasses, described in detail in Ref. tanguy02b . Initial configurations at zero temperature are obtained using the quenching procedure described in Ref. tanguy02b . A liquid of spherical particles interacting via simple Lennard-Jones pair potentials (characterized by an interaction diameter ) is quenched, using a conjugate gradient method, into the nearest energy minimum. The average density and the starting temperature are, in Lennard-Jones units, and .
After the quench, two layers of particles, with thickness , are singled out and assumed to constitute parallel solid “walls” that will impose the deformation to the system. The resulting “shear cell” has a thickness (distance between walls) and a width . Other system sizes (but with the same density ) have also been checked when necessary: namely . The configurations are then submitted to a quasi-static imposed shear, by applying constant displacement steps to the particles of the upper wall, parallel to this wall, and keeping the lower wall fixed. After the displacement has been imposed to the upper wall, the entire system is relaxed, with fixed walls, into its new closest equilibrium position. The equilibrium position is defined here as a minimum in the total potential energy, hence the evolution of the system is studied at zero temperature. Strictly speaking, an “athermal, quasi-static” deformation maloneylemaitre corresponds to the procedure described above, in the limit .
It is important to understand the physical situation associated with such a “quasi-static” procedure. If we consider a glassy material (soft or hard) at finite temperature, we can define two different characteristic times. The first one, , is the time it takes for a localized energy input to spread over the whole system and be dissipated as heat. The corresponding mechanisms can be viscous (in a soft material) or associated with phonon propagation in a metallic glass. The quasi-static procedure corresponds to a shear rate, , much smaller than . A second, much longer time is the structural relaxation time of the system, , associated with spontaneous aging processes that take place within the system in the absence of any external drive. By quenching after every displacement step, we prevent any such processes from taking place, meaning that the equivalent shear rate is larger than . In this simplified picture, the plastic response of a glassy system driven at a shear rate smaller than the inverse relaxation time, which corresponds to many experimental situations both for hard and soft systems, should be reasonably well described by the quasi-static approach. This picture, however, is oversimplified. The relaxation of the system is in general stretched, meaning that relaxation processes take place over a broad spectrum of times. The quasi-static approach ignore the “fast” wing of this relaxation spectrum, which would take place in real experiments at a finite value of . Nevertheless, all these relaxation times are very large at small temperature.
In our case, the “quasi-static” procedure depends more significantly on the choice of the finite elementary displacement step. The next issue is thus to determine the value of the elementary displacement step, , that can be considered to be a reasonable approximation of the limit . ¿From our previous simulations tanguy02b ; tanguy04 ; tanguy05 , we know that for systems of size , prepared with the same quench protocol, the elastic character of the response is preserved in average for shear strains smaller than . By choosing an elementary displacement of the wall , we obtain an elementary strain step , clearly below this threshold. In order to allow the system relax between two successive elementary steps, the time ellapsed must be , and the corresponding shear rate is thus limited by the additional condition .
Finally, we note that the quasi-static procedure ensures that, after a local “bond” breaks, new bonds can form instantaneously. In a simple van der Waals system such as the one under study, this makes it very unlikely that the material could fracture, at least under the type of volume preserving deformation we are studying.
In the following, we will discuss the numerical results obtained for the onset of plastic deformation by averaging over 20 configurations. Each of these configurations has been subjected to 5000 elementary deformation steps, corresponding to a total strain of 25%. In order to study the “stationary” regime obtained for large plastic deformation, we will also discuss results obtained for a system deformed during 34000 steps, corresponding to a total shear strain of 170%.
III Stress-Strain relation: elastic thresholds and plastic flow.
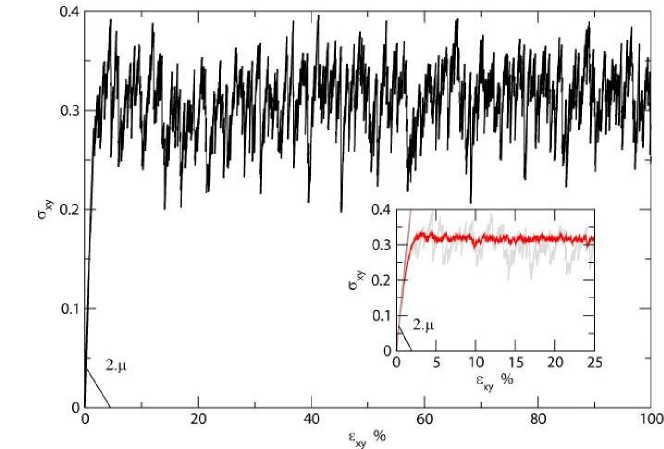
We start by discussing the “macroscopic” (i.e. computed for the whole sample) stress-strain relation. We show in Fig.1 the shear stress as a function of the total shear strain , computed from the boundary displacement. The stress is obtained from the usual microscopic Irving-Kirkwood definition tanguy02b ; Kirkwood , and averaged over the whole system. Results are shown for a single realization, and for an average over 20 realizations. From this figure, we identify two different regimes. A linear increase of the stress as a function of strain, followed by a very noisy plastic flow, with constant average shear stress.
Although it appears to be elastic in the usual, averaged sense, the linear part of the stress-strain curve is not strictly reversible at the microscopic level. In fact, the elastic reversible part is restricted for our systems to , as already shown in a previous paper tanguy02b . For , the shear stress evolves mainly linearly with increasing strain, but displays small jumps, giving evidence of irreversible energy losses. Then the stress-strain curve saturates. The upper threshold () does not seem to depend on the system size at least for the configurations we have checked. Its value is not far from the one deduced from experiments in metallic glasses Met2 . It corresponds approximately in our case to a displacement of one particle diameter at the border of a vortex-like structure of size as shown in the elastic inhomogeneous response of these systems tanguy02 ; tanguy02b ; tanguy04 ; tanguy05 (). After the linear increase, the stress thus reaches a very noisy plateau, characteristic of plastic flow. In this second part of the stress-strain relation, the fluctuations of the measured shear stress are enhanced (see figure 2).
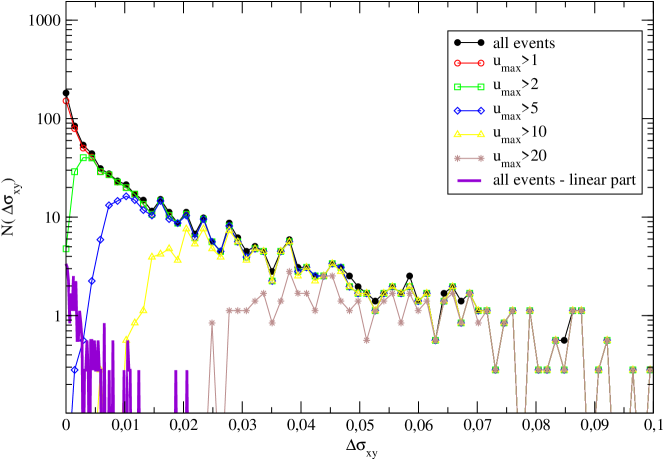
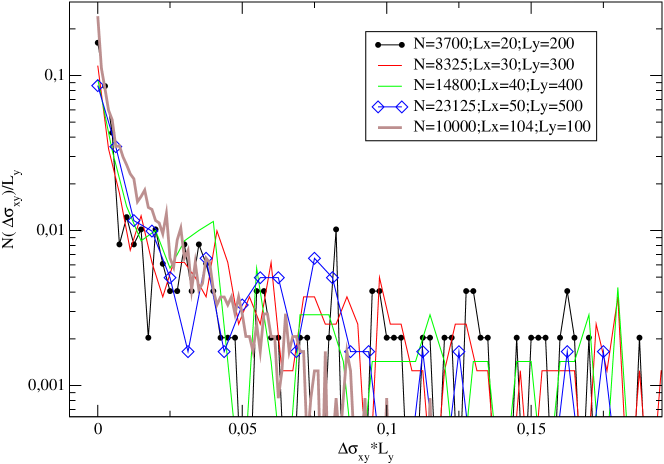
The distribution of the stress jumps is shown in figure 2. We show in this figure that the stress jumps in the linear part (straight line in the figure) are much smaller than the stress jumps in the noisy “plateau” region. The average energy loss (that can be obtained as the average stress jump times the elementary imposed deformation) is thus by at least one order of magnitude larger in the plateau than in the previous part. This suggests rather different types of microscopic response in the two different regions. Note that the distribution of the stress jumps is not strictly exponential as in Ref. maloney , but shows a marked deviation from the exponential decay that could be due to the difference of boundary conditions. Indeed, it is known that the presence of walls affects strongly the plastic behavior of glasses (see for example Ref. Varnik ). However, the size dependence of the stress jumps (figure 2-b) seems to be in agreement with the scaling already proposed in Ref. maloney and related to the existence of a characteristic displacement resulting from the instability. Note finally that the situation is quite different from the one observed in crystalline plasticity brechet , in which the characteristic size of stress drops in the linear and in the plateau region is rather similar, although the shape of the distribution may differ in both parts.
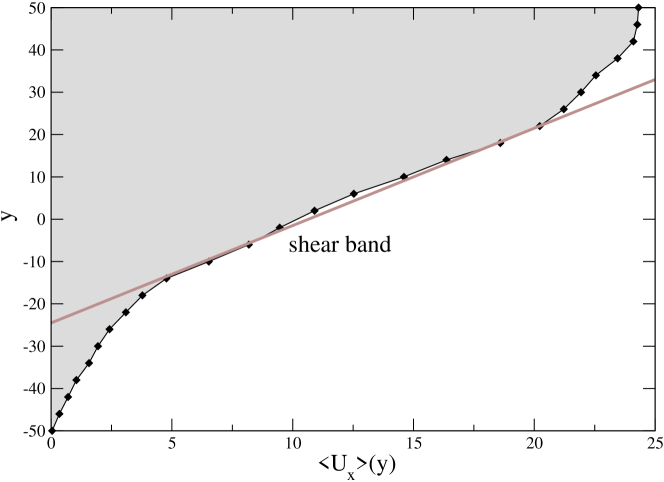
Before we start analyzing the response of the system at the atomic scale in these two different regimes, it is interesting to look at the cumulative displacement in the direction of the imposed shear. This is shown in figure 3, where the cumulative displacement of the particles has been averaged for each distance from the shearing wall on a layer with a thickness of few particle diameters (typically ), for a total deformation here of 25%. In general, the cumulative shear appears to be very heterogeneous, even for such large strains. In some cases (like in figure 3) a broad shear band appears in the center of the sample, while the particles close to the boundaries are dragged by the wall motion. In other cases several parallel sheared regions coexist, separated by unstrained regions. Note that, in all our samples, the cumulative shear zones are observed to occur away from the boundaries, unlike in experiments and simulations on foams in a 2D Couette Geometry kabla ; debregeas , or on concentrated emulsions coussotshear , where the shear is localized at a boundary, but closer to experiments on metallic glasses Met1 ; Met2 ; Met3 ; Met4 , or on granular systems grains ; HJH1 ; HJH2 ; HJH3 . This is one of the marked differences appearing in different amorphous systems.
We now turn to the detailed analysis of the atomistic response of the system.
IV Detailed analysis of the local plastic rearrangements
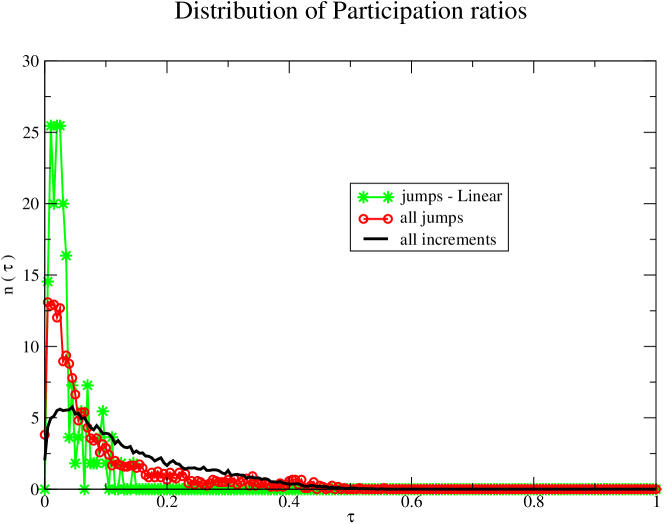
In the previous section, we inferred from the distribution of stress drops in the linear and plateau regions, respectively, that different microscopic events were taking place in these two regions. Following the distinction made previously between the dissipative behavior in the linear regime, and the one in the regime of plastic flow, we can distinguish two kinds of plastic events. In the following, we will distinguish between these events based on the participation ratio for the non-affine displacement field associated with the event. is defined as
where is the non-affine displacement of the particle , that is the displacement after its usual affine shear component (corresponding to a uniform shear strain) has been removed. Obviously, for events involving the whole system, and in case of a localized event. From figure 5 it appears that the linear part of the stress strain curve is dominated by events with a much smaller value of than the plateau region. Visual inspection allows a clear distinction between two types of events associated with small ( ) and large values of , which we now describe in more detail.
IV.1 Localized, quadrupolar rearrangements
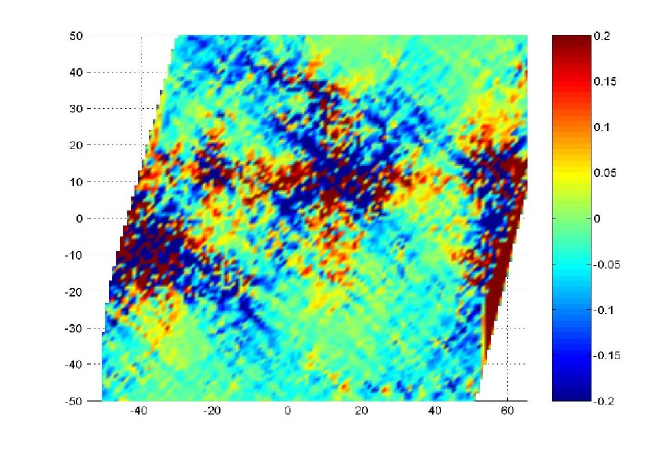
A typical example of localized event is shown in figure 4. All dissipative events in the linear part of the stress-strain curve are of this type. In contrast, only very few stress drops in the “flowing” regime (plateau region) are associated with such localized events. These events give rise to the small stress drops in figure 2, at various yield stresses. They do not, however, contribute substantially to the horizontal displacement field shown in figure 3.
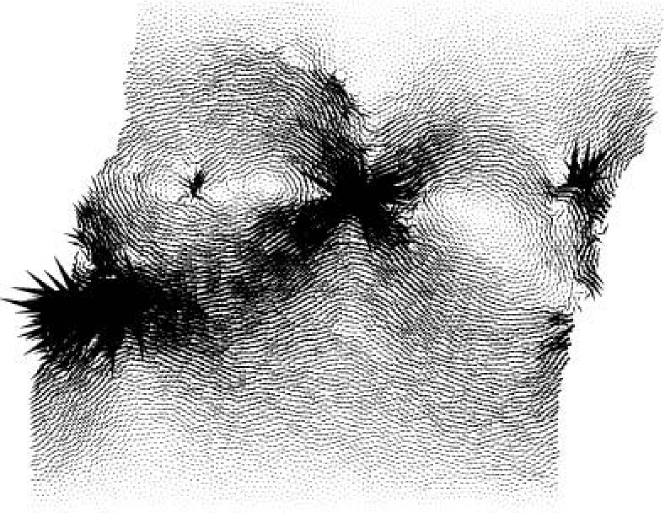
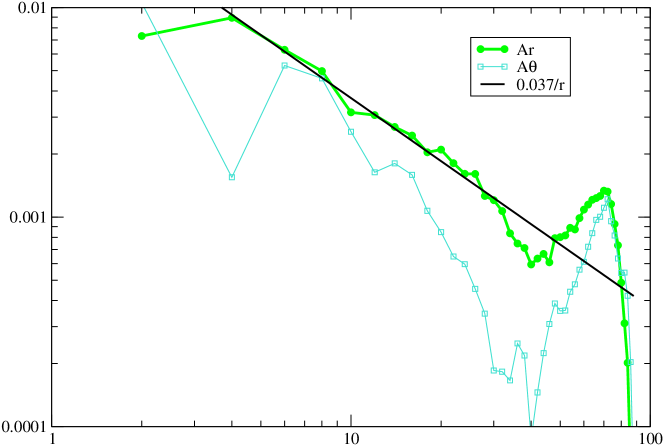
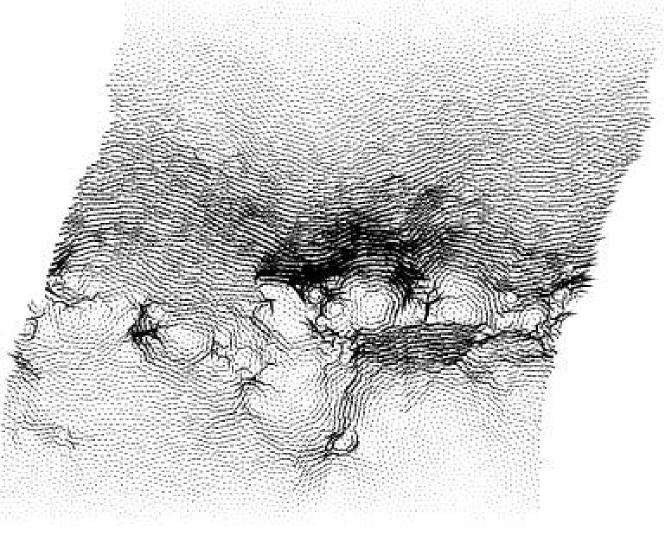
Figure 4 displays the non-affine displacement of each particle in a typical localized event. The large displacements indicate the location of the irreversible deformation. The few particles involved in the rearrangement are localized at the boundary between two adjacent vortices of the non-affine field, that are reminiscent of the non-dissipative (elastic) non-affine response of the system tanguy02b . It is possible to identify the center of the plastic rearrangement by selecting the particle undergoing the largest non-affine displacement. This particle is at the center of a redistribution of shear stresses with an apparent symmetry characteristic of a quadrupole (figure 4). In this figure, the change in the local shear stress is obtained from the usual Irving-Kirkwood definition, as described in tanguy02b ; Kirkwood . In order to identify more precisely as in Ref. maloney the symmetry of these rearrangements, we move to a coordinate system centered on this point, and project the corresponding radial and azimuthal part of the displacement field onto circular harmonics (see figure 6). For the (quadrupole) contribution, we get the well known dependence of the radial projection, corresponding to an homogeneous, linear and isotropic elastic medium picard . For unknown reasons however, the dependence of the azimuthal projection is much more noisy in this case. Note also that the contribution is far from being negligible (not shown here), indicating that the displacement field is not strictly quadrupolar, a deviation that may originate from the boundary conditions we are using.
When the flowing plateau is approached, many such local rearrangements tends to appear simultaneously and to concentrate spatially during a single plastic event. Eventually, when the plastic flow regime is reached, another kind of event appears, involving a much larger amount of dissipated energy (or stress drop). These larger events are made of an alignment of rotational rearrangements (see figure 7) along the direction of the imposed external shear. This second kind of event constitutes the “elementary shear bands”, that we now describe in more detail.
IV.2 Collective, large scale events: elementary shear bands
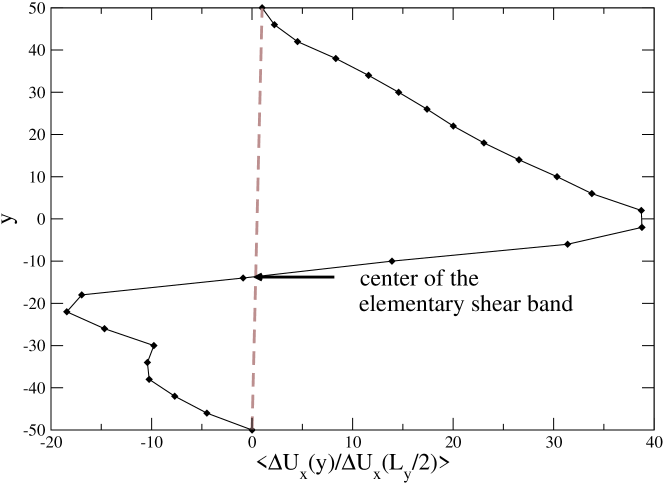
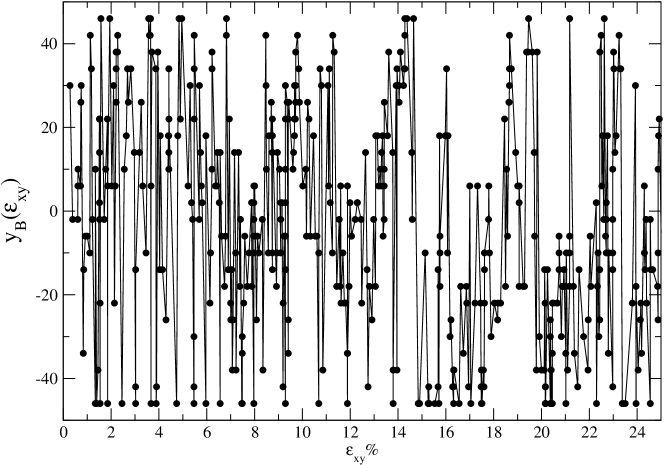
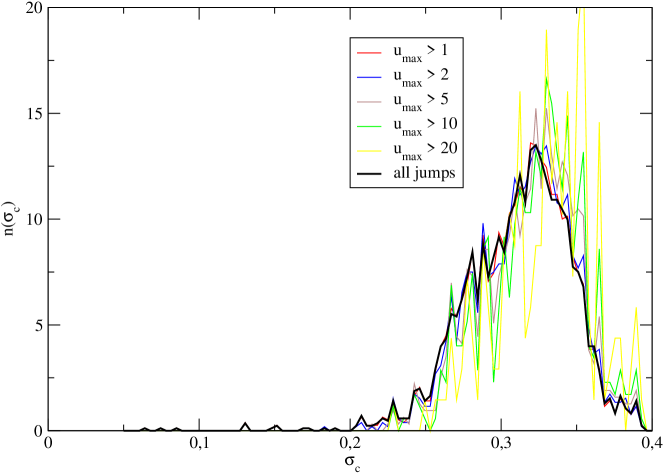
The collective events that dominate the flow behavior in the plateau region involve a large displacement that spans the whole length of the sample in the direction, and are localized in the direction. It is easy to identify the center line of such an elementary shear band, because the displacements of the particles are so high that they lead to an inversion of the instantaneous “velocity field” (i.e. the displacement within a single strain step) in the direction of the sollicitation, above and below the elementary shear band (figure 8-a). The largest displacement inside the sample (located at the edge of a shear band) can reach more than 100 times the displacement imposed at the wall, i.e. it is close to one particle size in our case. It is interesting to note that the distribution of the global shear stresses at which this kind of event occur (yield stress distribution), is unrelated to the spatial amplitude of the subsequent event (figure 9). However, the largest events (that is with the largest displacements) constitutes the enveloppe of the noisy stress-strain relation (not shown here).
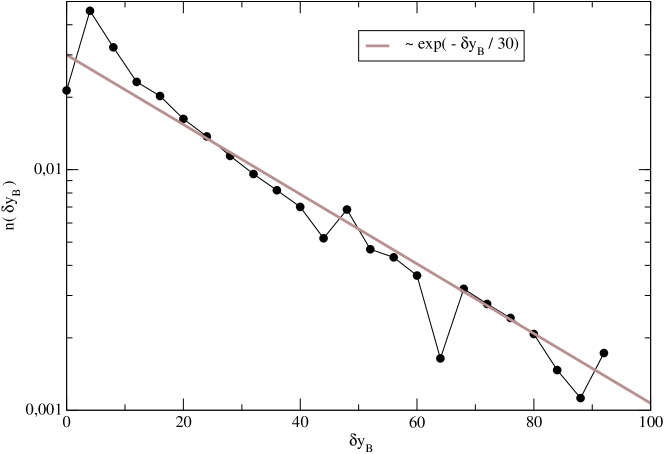
We see in figure 8-b that these elementary shear bands can take place anywhere in the sample, and not only at the boundaries. In fact, the distribution of the distances between the centers of successive shear bands (figure 10-a) is exponential, with a characteristic length , independent on the system size, that corresponds to the size of the rotational structures that have been identified in the elastic response of the system tanguy02 ; tanguy02b ; tanguy04 ; tanguy05 . The characteristic distance between successive elementary shear bands in our system is thus equal to the width of the elementary shear band itself. Moreover, the Fourier transform (not shown here) of the temporal evolution of the positions of the centers of the bands (figure 8-b) shows a behavior characteristic of a random, sub-diffusive signal. All these results mean that the elementary shear bands propagate essentially in a random walk manner, with a step size of approximately , confined by the two boundaries.
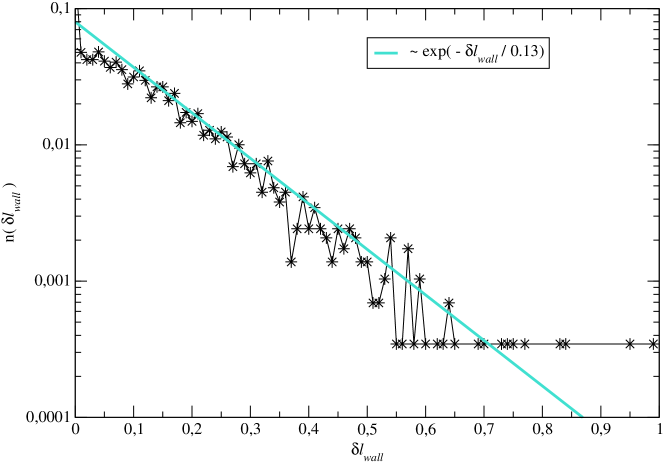
The distribution of distances covered by the upper wall between successive occurrence of elementary shear bands (figure 10-b) is also exponential. It shows a characteristic length ( in our case), equivalent to a characteristic number of quasistatic steps (here steps of amplitude on the upper wall). This length does not depend significantly on system size. We can find an explanation for the order of magnitude of this length , by dividing it by the radius of a vortex. If we assume that the deformation is localized within a “weak” region of thickness , and that the system outside this shear band is essentially unstrained, the characteristic distance covered by the wall between successive occurrence of elementary shear bands corresponds to a deformation of within the weak region. This order of magnitude is approximately the one that corresponds to the elastic threshold for the strain within the elementary shear band. The elementary shear bands can thus be seen as weak locations where all the deformation concentrates, giving rise - from a given local strain threshold - to a large plastic event that relaxes all the accumulated elastic energy. The next shear band event is spatially strongly correlated, within a distance .
Within this picture, we can simply describe the construction of the plastic flow “velocity” profile as a diffusive process. For a sample with transverse size , the number of bands that are created by a total strain is . If the bands are created in a spatially correlated manner, with typical distance , this will result in an effective diffusion coefficient for these plastic events of the form (here the strain plays the role of time). The shear will diffuse through the sample over a “time” scale . For our samples (, ) the corresponding strain is small, and the boundaries will almost immediately limit shear band diffusion. The shear profile then is created by essentially independent bands. An essentially homogeneous profile will be obtained when the shear band density becomes of the order of the inverse of the particle size, i.e. . In a larger sample, on the other hand, this picture suggests that the time (or strain) scale for establishing an homogeneous profile may be very large, in fact proportional to system size, which could explain the commonly observed tendency towards shear localization in such systems.
In the next section, we explore the effect of the two kinds of dissipative events described here (quadrupolar events and elementary shear band), on the local dynamics of the particles.
V Diffusive trajectory of an individual particle.
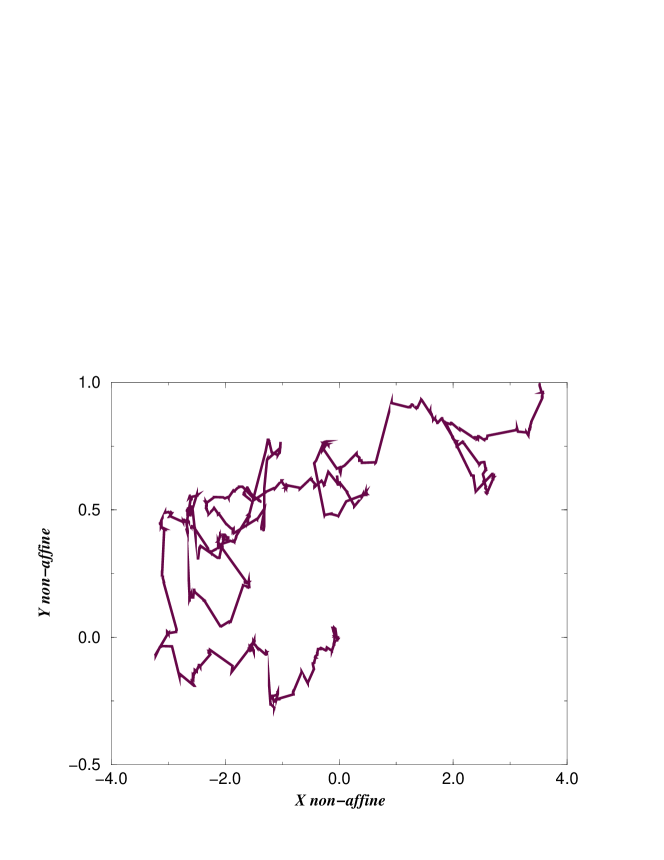
Due to the average shear flow, the motion of each individual particle is highly anisotropic. The motion in the direction of the sollicitation will mainly indicate the presence of a central sheared zone, while the motion in the transverse direction is zero on average. A diffusive contribution to the motion of an individual particle can be defined by removing the convective part of the motion (affine displacement) in the direction. A typical example of the resulting motion is shown in figure 11-a. In the following, in order to avoid potential ambiguities associated with the inhomogeneous character of the convective displacement along the shear direction, we concentrate on a statistical analysis of the motion in the transverse, direction.
The random motion of a particle can be described by the distribution of the size of its elementary jumps, and by the temporal correlations between jumps Crank . We find (see figure 12-a for ) that the distribution of the size of the transverse components of the elementary jumps is symmetric, with zero average and finite variance . This finite variance results from an upper exponential cutoff. It implies that, in the hypothetic absence of temporal correlations between jumps, the motion of the particle should be diffusive at large enough times.
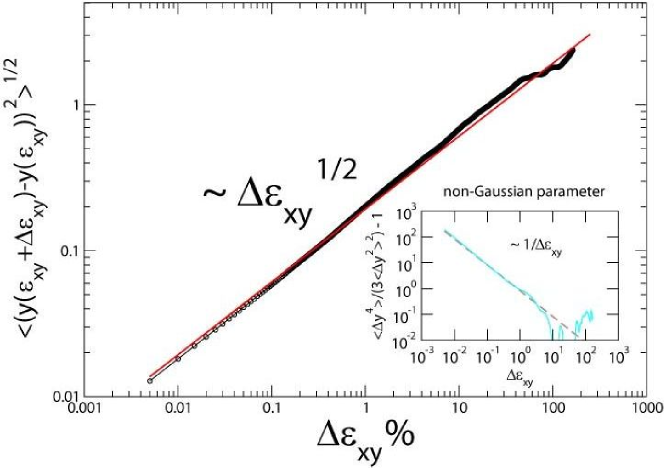
This seems to be confirmed by the study of the mean squared displacement of the particles in the transverse direction, which grows essentially linearly with the strain (see figure 11-b), and allows one to define a diffusion coefficient. But although the motion seems to be diffusive by looking only at the second moment of the distribution, the study of the non gaussian parameter (inset in figure 11-b) shows that the situation is much more complex, particularly at short times, with a markedly non-gaussian distribution for displacements smaller than typically one particle size.
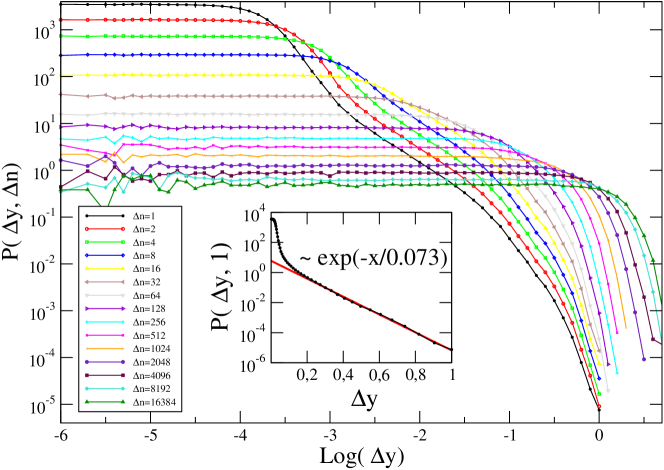
This deviation from gaussianity can be explored further through the distribution of the transverse distances between the positions of a particle, after a total strain has been imposed to the sample Frac . The distribution is shown in figure 12-a. It can be seen as a quasistatic equivalent of the van Hove distribution correlation function, which is a standard tool to characterize diffusion in glasses and supercooled liquids Diff1 . For a given , the function starts with a plateau, followed by a power-law decay, and ends with an exponential cutoff. The width of the power-law decay depends on the total strain . The function is clearly very different from the Gaussian propagator of simple diffusion.
In fact, the beginning and the end of this power-law behavior are not self-similar (i.e. cannot be rescaled in a form ). For small , the long distance contribution evolves less rapidly with than the short distance part. This is also why the amplitude of the initial plateau, , shows two different behaviors as a function of (see figure 12-a): a rapid decrease at small , followed by a slower decrease for larger after the power-law decay has disappeared.
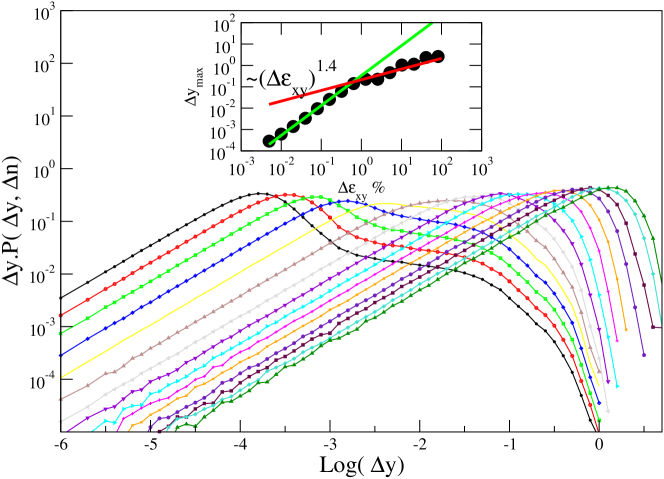
This behavior is also shown in figure 12-b where the function is plotted as a function of . In this representation, the values of that contribute most to the average displacement appear as peaks. It is clear that two main peaks are present. The first one corresponds to very small displacements, and its positions evolves as . The second one, which corresponds to the actual diffusive process, appears at distances of order , and its position increases as . As the deformation is increases, the intensity shifts progressively from the first peak to the second one. This result supports the idea of two different relaxation mechanisms in amorphous glasses, even at zero temperature Diff2 ; Diff3 ; Diff4 ; Diff5 .
To quantify the difference between the two regimes, we show in figure 12-b the position of the main peak in . Note that the increase observed in the position of this peak is essentially the counterpart of the decay of as a function of . We see here two distinct power-law behaviors, separated by a characteristic shear strain . This characteristic shear strain is of the same order of magnitude as the shear strain separating the linear behavior and the plastic flow (see section 1). It is interesting to note that this characteristic shear strain appears as well when the linear part of the shear-stress relation is not considered, that is in the pure plastic flow, while the same figure, restricted to the linear part of the stress-strain relation, gives only the first power-law decay. This means that the plastic flow contains a succession of elastic and plastic events with a small strain behavior different from the large strain behavior, in agreement with previous results obtained on the mechanical study of flowing foams Aubouy .
The hyper-diffusive motion of the first bump shown in figure 12-b, increasing as , implies hyper-diffusive motion of the particles at small shear strain. It is in perfect agreement with the variation for small and is related to a strong non-gaussian behavior. This non-gaussian behavior at small imposed strain has already been observed in other amorphous systems like foams Diff4 , or granular materials Diff5 ; Diff6 . In these systems however, the corresponding exponents, as measured in Diff6 for example, can be different. The exponent characterizing the hyper-diffusive motion of the particles dragged by the vortex motion in the linear regime seems thus to be material dependent, while the non-gaussian character of the motion could be a characteristic of the small strain deformation at zero temperature, in disordered systems.
Finally, we have seen here that, even at zero temperature, the disorder inherent to amorphous systems is sufficient to create, under sufficiently large external sollicitations with a marked dissipative behavior (i.e. in the plastic flow regime), a diffusive motion for the individual particles. Further investigation of this diffusion process and other nonequilibrium transport processes -e.g. mobility under an external force- could allow us to explore the idea of effective temperature in these systems Diff4 ; Diff7 .
VI Conclusion
We have shown that the quasi-static dissipative behavior of a two dimensional model glass is due to two different kinds of microscopic events. First, mainly quadrupolar local rearrangements involving only very few particles are present in the linear part of the stress-strain relation. These events involve only small energy release. Second, in the plastic flow regime (plateau of the stress strain curve), the plasticity is dominated by large scale events that involve rearrangements along lines parallel to the average shear direction. These events have a very broad distribution of energy losses, which overlaps with the one associated with the more localized events. These elementary shear bands are correlated in space over distances that are typical of the elastic inhomogeneity in the medium, and appear to propagate randomly throughout the system. We suggested that this behavior could be a source of shear localization in extended systems. Note that the boundary conditions are crucial to determine the orientation of the elementary shear bands, as already pointed out in maloney ; and they affect also the random propagation of shear bands in the system. In our case, the elementary shear bands reach very quickly the boundaries of our system, giving rise to confined motion, and a possible memory free behavior of the elementary shear bands was not observable for systems of this size. We must finally insist on the differences between the two kinds of dissipative events we have clearly pointed out here: particularly the spatial distribution of localized events is far from the one-dimensional alignement shown in the elementary shear bands. This is one of the crucial points of this paper to distinguish between the two.
We also analyzed the motion of individual particles, driven by the plastic deformation. We only consider the motion in the direction perpendicular to the average shear velocity. This motion also is, even at zero temperature, a two step process. In a first step, the motion is hyper-diffusive and non-gaussian; such displacements are the only ones that are observed in the linear part of the stress strain curve. Purely diffusive behavior is however observed on larger length scales, of the order of a particle size. This diffusive motion dominates the plastic flow regime, for sufficiently large imposed strain. Further exploration of the transport properties within this plastic flow regime will be the object of future work.
Acknowledgements.
During the course of this work, we had valuable discussions from L. Bocquet, M.L. Falk, A. Lemaître, C. Maloney, S. Roux, and D. Vandembroucq. Computational support by IDRIS/France, CINES/France and CEA/France is acknowledged.References
- (1) Les amorphes métalliques - Aussois 1983, A. Chamberod ed., les éditions de physique (Paris, 1983).
- (2) J.P. Wittmer, A. Tanguy, J.-L. Barrat, and L. Lewis, Europhys. Lett. 57, 423 (2002)
- (3) A. Tanguy, J.P. Wittmer, F. Leonforte, and J.-L. Barrat, Phys. Rev. B 66, 174205 (2002).
- (4) F. Leonforte, A. Tanguy, J. P. Wittmer, and J.-L. Barrat Phys. Rev. B 70, 014203 (2004)
- (5) F. Leonforte, R. Boissière, A. Tanguy, J.P. Wittmer and J.-L. Barrat, Phys. Rev. B 72, 224206 (2005).
- (6) C. Maloney and A. Lemaître, Phys. Rev. Lett. 93, 016001 (2004); Phys. Rev. Lett. 93, 195501 (2004) ; A. Lemaître and C. Maloney, arXiv: condmat/0410592 (2004).
- (7) C. Maloney and A. Lemaître, arXiv: condmat/0510677 (2005).
- (8) D. Weaire, M.F. Ashby, J. Logan and M.J. Weins, Acta metall. 19, 779 (1971).
- (9) S. Kobayashi, K. Maeda and S. Takeuchi, Acta Met 28, 1641 (1980); K. Maeda and S. Takeuchi, Philos. Mag. A - Phys. Condens. Matter Struct. Defect Mech. Prop. 44, 643 (1981).
- (10) F. Varnik, L. Bocquet, J.-L. Barrat and L. Berthier, Phys. Rev. Lett. 90, 095702 (2003); F. Varnik, L. Bocquet and J.-L. Barrat, J. Chem. Phys. 120, 2788 (2004).
- (11) J. Rottler and M.O. Robbins, Phys. Rev. E 68, 011507 (2003). J. Rottler and M.O. Robbins, Phys. Rev. E 64, 051801 (2001).
- (12) M. Falk, J. Langer, Phys. Rev. E, 57, 7192 (1998); Phys. Rev. B, 60, 7062 (1999).
- (13) D.L. Malendro and D.J. Lacks, Phys. Rev. Lett. 81, 5576 (1998); J. Chem. Phys. 110, 4593 (1999). D.J. Lacks, Phys. Rev. Lett. 87, 225502 (2001); D.J. Lacks and M.J. Osborne, Phys. Rev. Lett. 93, 255501 (2004).
- (14) C.A. Schuh and A.C. Lund, Nature materials 2, 449 (2003).
- (15) M. Nandagopal and M. Utz, J. Chem. Phys. 118, 8373 (2003).
- (16) N.P. Bailey, J. Schiotz and K.W. jacobsn Mater. Sci. Eng. A-Struct. Mater. Prop. Microstruct. Process. 387-389, 996 (2004).
- (17) I. Stankovic, S. Hess and M. Kroger, Phys. Rev. E 69, 021509 (2004).
- (18) K. Yoshimoto, T.S. Jain, K. van Workum, P.F. Nealey, J.J. de Pablo, Phys. Rev. Lett. 93, 175501 (2004).
- (19) M. Wyart, S.R. Nagel and T.A. Witten, Europhys. Lett. 72, 486 (2005); M; Wyart, L.E. Silbert, S.R. Nagel and T.A. Witten, Phys. Rev. E 72, 051306 (2005). L.E. Silbert, A.J. Liu, S.R. Nagel, arXiv: condmat/0501616 (2005).
- (20) I. Goldhirsch and C. Goldenberg, Eur. Phys. J. E 9, 245 (2002). C. Goldenberg and I. Goldhirsch in Handbook of Theoretical and Computational Nanotechnology, Vol. 4, M. Rieth and W. Schommers ed. (American Scientific, 2006).
- (21) J.Y. Cavaillé, J. Perez and G.P. Johari, Phys. Rev. B 39, 2411 (1989).
- (22) F. Radjai and S. Roux, Phys. Rev. Lett. 89, 064302 (2002).
- (23) J.C. Baret, D. Vandembroucq and S. Roux, Phys. Rev. Lett. 89, 195506 (2002).
- (24) J. Török, S. Krishnamurthy, J. Kertész and S. Roux, Phys. Rev. E 67, 021303 (2003).
- (25) G. Picard, A. Ajdari, F. Lequeux and L. Bocquet, Phys. Rev. E 71, 010501(R) (2005).
- (26) M. Telford in Materials Today, p. 24 (March 2004).
- (27) L.T. Shi and P. Chaudhari, Phys. Rev. Lett. 51, 1581 (1983).
- (28) A.S. Argon and H.Y. Kuo, Mater Sci Eng 39, 101 (1979); A.S. Argon and L.T. Shi, Philos. Mag. A-Phys. Condens. Matter Struct. Defet Mech. Prop. 46, 275 (1982).
- (29) A. Kabla and G. Debrégeas, Phys. Rev. Lett. 90, 258303 (2003).
- (30) G. Debregeas, H. Tabuteau and J.-M. di Meglio, Phys. Rev. Lett. 87, 178305 (2001).
- (31) Y. Wang, K. Krishan and M. Dennin, arXiv: condmat/0511071 (2005).
- (32) A.M. Kraynik, Ann. Rev. Fluid Mech. 20, 325 (1988).
- (33) S.A. Langer and A.J. Liu, Europhys. Lett. 49, 68 (2000).
- (34) S. Tewari, D. Schiemann, D.J. Durian, C.M. Knobler, S.A. Langer and A.J. Liu, Phys. Rev. E 60, 4385 (1999).
- (35) I. Cantat and O. Pitois, preprint (2006).
- (36) P. Coussot, “Rheometry of pastes, suspensions, and granular materials”, Wiley-Interscience ed. (2005).
- (37) P. Coussot, J.S. Raynaud, F. Bertrand, P. Moucheront, J.P. Guilbaud, H.T. Huynh, S. Jarny and D. Lesueur, Phys. Rev. Lett., 88, 218301 (2002).
- (38) W.H. Homes, P.T. Callaghan, D. Vlassopoulos and J. Roovers, J. Rheol. 48, 1085 (2004).
- (39)
- (40) F. Alonso-Marroquin and H.J. Herrmann, Phys. Rev. Lett. 92, 054301 (2004).
- (41) M. Latzel, S. Luding, H.J. Herrmann, D.W. Howell and R.P. Behringer, European Physical Journal E 11, 325 (2003).
- (42) A.N.B. Poliakov, H.J. Herrmann, Y.Y. Podladchikov and S. Roux, Fractals 2, 567 (1994).
- (43) T. Masumoto and R. Maddin, Materials Science and Engineering 19, 1 (1975).
- (44) W.L. Johnson, J. Lu and M.D. Demtriou, Intermetallics 10, 1039 (2002). C.C. Hays, C.P. Kim and W.L. Johnson, Phys. Rev. Lett. 84, 2901 (2000).
- (45) T.C. Hufnagel, C. Fan, R.T. Ott, J. Li and S. Brennan, Intermetallics 10, 1163 (2002); J. Li, F. Spaepen and T.C. Hufnagel, Philosophical Magazine A, 82, 2623 (2002); J. Li, Z.L. Wang and T.C. Hufnagel, Phys. Rev. B 65, 144201 (2002).
- (46) X.-Y. Fu, D.A. Rigney, M.L. Falk, Journal of Non-Crystalline Solids 317, 206 (2003).
- (47) S. Alexander, Phys. Rep. 296, 65 (1998).
- (48) M. Aubouy, Y. Jiang, J.A. Glazier and F. Graner, Granular Matter 5, 67 (2003).
- (49) J. Crank ”The Mathematics of Diffusion”, Oxford University Press (Oxford, 2004). G. Samorodnitsky and M.S. Taqqu ”Stable non-gaussian random processes”, Chapman et Hall (2000).
- (50) L. Furuberg, J. Feder, A. Aharony and T. Jossang, Phys. Rev. Lett. 61, 2117 (1988); S. Krishnamurthy, A. Tanguy, P. Abry and S. Roux, Europhys. Lett. 51, 1 (2000).
- (51) J-L. Barrat, M.L. Klein, Ann. Rev. Phys. Chem., 42, 23 (1991)
- (52) A.V. Lyulin, B. Vorselaars, M.A. Mazo, N.K. Balabaev and M.A.J. Michels, Europhys. Lett. 71, 618 (2005).
- (53) A. Crisanti and F. Ritord, Europhys. Lett. 66, 253 (2004).
- (54) S. Cohen-Addad and R. Höhler, Phys. Rev. Lett. 86, 4700 (2001).
- (55) G. Marty and O. Dauchot, Phys. Rev. Lett. 94, 015701 (2005).
- (56) F. Radjai and S. Roux, Phys. Rev. Lett. 89, 064302 (2002).
- (57) C.Song, P. Wang and H.A. Makse, PNAS 102, 2299 (2005).
- (58) M. Lebyodkin, Y. Brechet, Y. Estrin and L. Kubin, Acta Mater. 44 4531 (1996).