Quasiparticle Relaxation Across a Spin Gap in the Itinerant Antiferromagnet UNiGa5
Abstract
Ultrafast time-resolved photoinduced reflectivity is measured for the itinerant antiferromagnet UNiGa5 (85 K) from room temperature to 10 K. The relaxation time shows a sharp increase at consistent with the opening of a spin gap. In addition, the temperature dependence of below is consistent with the opening of a spin gap leading to a quasiparticle recombination bottleneck as revealed by the Rothwarf-Taylor model. This contrasts with canonical heavy fermions such as CeCoIn5 where the recombination bottleneck arises from the hybridization gap.
There has been a great deal of interest in the “115” series of rare-earth and actinide compounds, such as CeTIn5 (T=Co, Rh, Ir) Hegger00 ; Petrovic2001b ; Thompson01 , and PuT’Ga5 (T’=Co, Rh) Sarrao02 ; Wastin03 , all of which exhibit unconventional superconductivity. Attention has been drawn to the uranium isomorphs UMGa5 (M=Ni, Pd, Pt) which are isostructural to the Ce and Pu counterparts, yet do not exhibit superconductivity at either ambient or high pressure. It has been suggested that this is due to the strong hybridization and itinerant character of the 5f levels, which leads to a relatively wide 5f band at and a lack of spin fluctuations Kaneko03b . Understanding the evolution of behavior from the parent compound UGa3 to UMGa5, especially across M from Ni to Pt with a decreasing Nel temperature, is illuminating for future studies of delta-Pu and PuT’Ga5. UMGa5 also differs from PuT’Ga5 regarding the extent of itinerancy of the 5f electrons — the former is almost fully itinerant, while the latter is only partially itinerant. Our study thus sheds light on the effect of the degree of itinerancy on the relaxation dynamics of these materials.
Time-resolved photoinduced reflectivity measurements have been performed on heavy fermions (HF) such as YbAgCu4 Demsar03a and heavy-fermion superconductors such as CeCoIn5 Demsar06b . Both display a divergence of the electron-phonon (e-ph) relaxation time at the lowest temperatures, which can be explained by the Two-Temperature Model (TTM) Groeneveld95 . This model describes the time evolution of the electron () and lattice () temperatures by two coupled differential equations. In this model (which assumes a thermal electron distribution) varies as at low temperatures if there is no blocking of e-ph scattering of heavy electrons within the density-of-states (DOS) peak, but varies more strongly than , and has a larger magnitude, if there is e-ph blocking within the DOS peak Ahn04 . On the other hand, similar measurements have also been performed on materials with a gap in the quasiparticle spectrum including high-temperature superconductors like YBCO Han90 ; Demsar99c and charge-density-wave materials like K0.3MoO3 Demsar99b . In these materials the relaxation time diverges near the transition temperature when a gap opens in the single-particle DOS. The opening of a gap can lead to a relaxation bottleneck, arising in superconductors from the competition between quasiparticle recombination and pair breaking by phonons Demsar01 . However, at present there has been no measurements of the relaxation dynamics of the antiferromagnetic (AF) phase, where a spin gap opens up below the Nel temperature .
In this Letter, we present time-resolved optical pump-probe data where we measure photoinduced changes in the reflectivity () of UNiGa5 from room temperature down to 10 K. The decay time of (directly related to electron-boson relaxation time ) increases sharply at and shows a quasi-divergence below , consistent with the opening of a gap. Though at low temperatures is suggestive of HF behavior, our detailed TTM calculations show otherwise. Instead, data over the entire temperature range of the AF phase could be fit using the phenomenological Rothwarf-Taylor (RT) model Rothwarf67 , where a boson bottleneck occurs due to the opening of the spin gap. We emphasize that the observed dynamics arise from the opening of a spin gap and not a hybridization gap as in HFs with larger mass renormalization.
UNiGa5 is a 5f itinerant antiferromagnet with Nel temperature 85 K, and electronic specific heat coefficient = 30 mJ/mol.K2 Tokiwa01 . The moderate value of suggests that UNiGa5 is a marginal HF. Angle-resolved photoemission data Durakiewicz06 of UNiGa5 reveal a high intensity DOS peak near . Such peaks are characteristic of HFs. The full-width-half-max (FWHM) of the feature is about 150 meV. A small hump in the electrical resistivity at is reminiscent of the spin density wave (SDW) formation Tokiwa01 , where a spin gap forms.
Single crystals of UNiGa5 were grown in Ga flux Moreno05 , with dimensions 1mm x 1mm x 0.4mm. Specific heat measurements were performed in a Quantum Design PPMS from 2 K to 300 K. The photoinduced reflectivitiy measurements were performed using a standard pump-probe technique Demsar99d , with a Ti:sapphire laser producing 100-fs pulses at approximately 800 nm (1.5 eV) as the source of both pump and probe optical pulses. The pump and probe pulses were cross-polarized. The experiments were performed with a pump fluence of 1.0 J/cm2. The probe intensity was approximately 25 times lower. Data were taken from 10 K to 300 K. The photoinduced temperature rise at the lowest temperatures was estimated to be 10 K (in all of the data the increase of the illuminated spot has been accounted for).
The temperature dependence of the specific heat (not shown) shows a small hump at , indicative of the formation of a spin gap. At low temperatures we fit the data to = + = + , obtaining =21 mJ/mol.K2 and =0.34 mJ/mol.K4. The values of and will be used later in the TTM calculations.
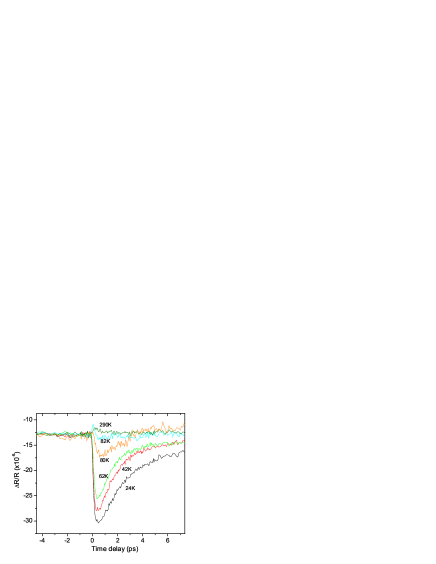
In Figure 1 we show the time dependence of the photoinduced signal at a number of temperatures below and above . The time evolution of the photoinduced reflection first shows a rapid rise time (of the order of the pump pulse duration) followed by a subsequent picosecond decay. These data can be fit using a single exponential decay over the entire temperature range, .
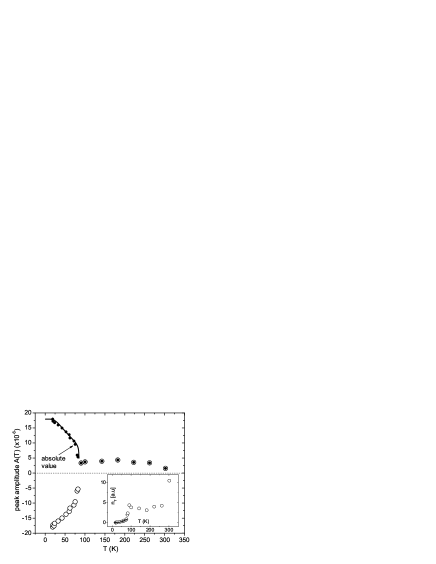

The temperature dependence of the amplitude and relaxation time of the photoinduced reflectivity are shown in Figures 2 and 3, respectively. We first analyze . We see that there is both a sign change and a decrease in magnitude as we approach from below. The origin of the sign change is under investigation. Its magnitude, however, has been shown to be Demsar99b
| (1) |
where is the spin gap magnitude, the pump laser intensity per unit cell, and is a constant. is taken to vary with temperature as , the mean-field result. Fitting the data in Fig. 2 to Eq. 1, we obtain and =47 K=0.55. This value for agrees well with the value of 44 K from resistivity data Moreno05 .
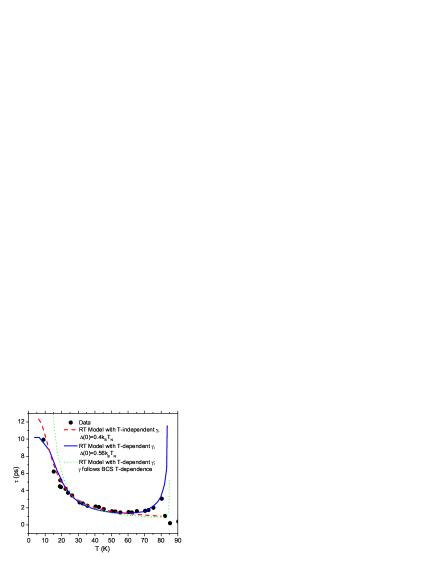
Turning to in Fig. 3, we observe that diverges at the lowest temperatures and near . The low-temperature divergence follows a dependence, initially suggesting that the TTM applies with no e-ph blocking within the DOS peak, in contrast to the presence of e-ph blocking in YbAgCu4 Demsar03a ; Ahn04 . Near , is shown to vary with temperature according to the expression Kabanov99
| (2) |
where is the Raman phonon linewidth and the phonon energy. However, absent experimental values for and , we use the expression , which is valid near and is shown as a dotted line in Fig. 3.
In the TTM the relaxation time is given by Groeneveld95
| (3) |
where and are the electronic and lattice specific heat, respectively. is termed the e-ph coupling function, and is given by , where
| (4) |
| (5) |
Here is the e-ph coupling constant, is the Debye temperature (=260 K for UNiGa5 from specific-heat data), , and . is included to account for the variation in the electronic DOS and the normalized e-ph scattering strength over the energy range , where the detailed procedure is described in Ref. Demsar03a, . In normal metals such as Au or Ag, , =1, giving =1. For UNiGa5, the phonon [] and electron [] DOS were chosen such that they fit the specific heat and photoemission data. For the electron DOS, we used , where =3.9 eV-1f.u.-1 spin-1, =0.18 eV, and =2.0 eV-1f.u.-1 spin-1. For the phonon DOS, we used the Debye model with =260 K. The lines of Figure 4 show the calculated values of using Equations 2-4 for 3 cases: (a) metal (dotted line), (b) HF with e-ph blocking within the DOS peak (dashed line), (c) HF with no e-ph blocking within the DOS peak (dashed-dotted line). It is clear that they do not agree with the experimental data, especially at the lowest temperatures where the slopes do not match, regardless of the value of , showing that the both the metal and HF picture (with or without blocking) cannot account for the temperature dependence of . In addition, recent investigations have called into question the validity of the TTM when a gap opens up in the DOS Demsar06a ; Demsar06b .

We turn next to the Rothwarf-Taylor (RT) model Rothwarf67 . This phenomenological model was used to describe the relaxation of photoexcited superconductors Demsar03c , where the presence of a gap in the electronic DOS gives rise to a relaxation bottleneck for carrier relaxation. When two quasiparticles (QP) with energies , where is the gap magnitude, recombine, a high-frequency phonon (HFP) () is created. Since a HFP can subsequently break a Cooper pair creating two QPs, the SC recovery is governed by the decay of the HFP population. The evolution of QP and HFP populations are described by a set of two coupled nonlinear-differential equations:
| (6) | |||||
| (7) |
Here and are the concentrations of QP and HFPs, respectively, is the probability for QP creation by HFP absorption, and the rate of QP recombination with the creation of a HFP. is the concentration of HFPs in thermal equilibrium, and their decay rate (governed either by anharmonic decay or by diffusion out of the excitation volume). The RT model has also been applied to the study of HFs, where the dynamics are associated with a gap resulting from the hybridization of the conduction electrons with the localized f-levels Demsar06a . In the following, we apply the RT model to UNiGa5.
The results of the RT model are as follows Kabanov05 ; Demsar06b : from the -dependence of the amplitude , one obtains the density of thermally excited QPs via the relation
| (8) |
where is the normalized amplitude (normalized to its low temperature value, . Then, from the QP density per unit cell at temperature Kabanov99
| (9) |
one can extract the value of the energy gap. The inset of Fig. 2 shows the -dependence of the peak amplitude , and the QP density calculated from Eq. 8. A fit of at low temperatures to Eq. 9 yields . Moreover, for a constant pump intensity, the -dependence of also governs the -dependence of , given by
| (10) |
where , and are -independent fit parameters. However, from Ref. Kabanov05, , we see that this expression for fit the data only up to 0.8 and fails to reproduce the upturn in near . The -dependence of near can be explained by taking into account the -dependence of , the phonon decay rate Kabanov99 ; Kabanov05 . We include this -dependence of into , where Kabanov99 , the (spin) gap magnitude, whose -dependence can be obtained from neutron scattering data Tokiwa02c . Fig. 5 shows the fit of Eq. 10 to data assuming a -independent (dashed line) and a -dependent (solid line). It is clear that using a -dependent in Eq. 10 matches data from low- to , for , in agreement with resistivity data. It is important to note that this fit uses the -dependence of the spin gap from neutron scattering data, which differs from the BCS -dependence from which a good fit is not possible (dotted line in Fig. 5). This strongly suggests that our data for arises from some sort of boson (most likely phonon) bottleneck due to the presence of the spin gap, as one enters the AF phase. Since our pump-probe setup only enables the observation of a gap in the charge channel, not the spin channel, the fact that we were able to observe the feature at in UNiGa5 suggests that a spin-driven charge gap, whose temperature dependence of its magnitude follows that of the spin gap, also opens up at . Since the TTM does not account for a gap opening at the Fermi level, the presence of a gap below in UNiGa5 probably explains why the TTM fails to explain our data. One could argue that what we are seeing here is the hybridization gap. However, the fact that (a) we see a gap open up at , and (b) we have used the temperature dependence of the spin gap (deduced from neutron scattering data) in our fit to the RT model imply that it is probably a spin-driven charge gap that opens up at . It seems fortuitous that a hybridization gap would open up at . Moreover, the (almost) fully itinerant nature of UNiGa5 implies a very small hybridization gap, consistent with the small value of , suggesting that one can observe the hybridization gap only at very low temperatures outside the temperature range of our setup.
We have performed time-resolved photoinduced reflectivity measurements on the itinerant antiferromagnet UNiGa5 (85 K) from room temperature to 10 K. The relaxation time increases sharply near , which we attribute to the opening of a spin gap. In addition, we fit the data over the entire temperature range of the AF phase using the Rothwarf-Taylor model Rothwarf67 , where a boson bottleneck occurs due to the opening of the spin gap, rather than a hybridization gap as found for heavy fermions. The transient amplitude exhibits a sign change at , whose temperature dependence is also consistent with the appearance of a spin gap.
E.E.M.C. appreciates useful conversations with J. Demsar, D. Mihailovic, J. Thompson, S. Trugman and M. Salamon. Work at Los Alamos National Laboratory was supported by the U.S. Department of Energy and the Los Alamos LDRD program. E.E.M.C. acknowledges postdoctoral fellowship support from the G. T. Seaborg Institute for Transactinium Science.
References
- (1) H. Hegger et al., Phys. Rev. Lett. 84, 4986 (2000).
- (2) C. Petrovic et al., Europhys. Lett. 53, 354 (2001).
- (3) J. D. Thompson et al., J. Magn. Magn. Mat. 226-230, 5 (2001).
- (4) J. L. Sarrao et al., Nature 420, 297 (2002).
- (5) F. Wastin et al., J. Phys. Condens. Matter 15, S2279 (2003).
- (6) K. Kaneko et al., Phys. Rev. B 68, 214419 (2003).
- (7) J. Demsar et al., Phys. Rev. Lett. 91, 027401 (2003).
- (8) J. Demsar, J. L. Sarrao, and A. J. Taylor, J. Phys.: Condens. Matter 18, R281 (2006).
- (9) R. H. M. Groeneveld, R. Sprik, and A. Lagendijk, Phys. Rev. B 51, 11433 (1995).
- (10) K. H. Ahn et al., Phys. Rev. B 69, 045114 (2004).
- (11) S. G. Han et al., Phys. Rev. Lett. 65, 2708 (1990).
- (12) J. Demsar et al., Europhys. Lett. 45, 381 (1999).
- (13) J. Demsar, K. Biljakovic, and D. Mihailovic, Phys. Rev. Lett. 83, 800 (1999).
- (14) J. Demsar et al., Phys. Rev. B 63, 054519 (2001).
- (15) A. Rothwarf and B. N. Taylor, Phys. Rev. Lett. 19, 27 (1967).
- (16) Y. Tokiwa et al., J. Phys. Soc. Jpn. 70, 1744 (2001).
- (17) T. Durakiewicz, unpublished .
- (18) N. O. Moreno et al., Phys. Rev. B 72, 035119 (2005).
- (19) D. Mihailovic and J. Demsar, in Spectroscopy of Superconducting Materials, ACS Symposium Series 730, edited by E. Faulques (The American Chemical Society, Washington D. C., 1999), p. 230.
- (20) V. V. Kabanov, J. Demsar, B. Podobnik, and D. Mihailovic, Phys. Rev. B 59, 1497 (1999).
- (21) J. Demsar, V. K. Thorsmølle, J. L. Sarrao, and A. J. Taylor, Phys. Rev. Lett. 96, 037401 (2006).
- (22) J. Demsar et al., Phys. Rev. Lett. 91, 267002 (2003).
- (23) V. V. Kabanov, J. Demsar, and D. Mihailovic, Phys. Rev. Lett. 95, 147002 (2005).
- (24) Y. Tokiwa et al., J. Phys. Soc. Jpn. 71, 725 (2002).