Defect Fluctuations and Lifetimes in Disordered Yukawa Systems
Abstract
We examine the time dependent defect fluctuations and lifetimes for a bidisperse disordered assembly of Yukawa particles. At high temperatures, the noise spectrum of fluctuations is white and the coordination number lifetimes have a stretched exponential distribution. At lower temperatures, the system dynamically freezes, the defect fluctuations exhibit a spectrum, and there is a power law distribution of the coordination number lifetimes. Our results indicate that topological defect fluctuations may be a useful way to characterize disordered systems.
pacs:
82.70.Dd,52.27.LwI Introduction
In two dimensional systems of interacting repulsive particles such as dusty plasmas Lin ; Woon ; Liu and colloidal assemblies Rice ; Dullens ; Levy ; Reichhardt , heterogeneous particle motions have been observed in the dense liquid phase. The heterogeneity appears close to the disordering transition where the system changes from having predominantly hexagonal ordering to being heavily defected. Recently, it was demonstrated that in the disordered regime where dynamical heterogeneities are present, the time dependent density fluctuations of the topological defects exhibits a power spectrum Reichhardt . The heterogeneous motion disappears at higher temperatures, and simultaneously the noise spectrum changes to a white form and the noise power is strongly reduced, indicating a lack of correlations in the fluctuations. It was argued that motion in the regime with dynamical heterogeneities occurs in a correlated manner and is spatially concentrated in areas containing a higher density of topological defects. As a result, the creation and annihilation of topological defects is strongly correlated, leading to the noise signature. Recent experiments on two-dimensional colloidal systems exhibiting heterogeneous motion have confirmed that the colloids with more rapidly changing coordination number are correlated with the regions of motion Dullens .
In the systems mentioned so far, the ground state at low temperatures is an ordered hexagonal lattice; however, it is known that intrinsically disordered or glassy systems also exhibit dynamical heterogeneities Kob ; Weeks . A natural question to ask is how do topological defect fluctuations behave in systems that are inherently disordered and that have no transition to an ordered state as the temperature is lowered. Although there is no ordering transition in an intrinsically disordered system, there can be a temperature at which a dynamical slowing down occurs, giving rise to glassy type behaviors. It would be interesting to study how or if the defect fluctuations change as dynamical freezing is approached. In the disordered system, the length scale of the dynamical heterogeneities increases as the temperature is lowered Kob ; Weeks . If the moving regions are associated with more highly defected regions, this may also be reflected in the defect fluctuations.
In this work we examine a two-dimensional system of a bidisperse mixture of Yukawa particles. Previously, this system has been shown to form a disordered state at all temperatures Hastings . We analyze the time dependent defect fluctuations, noise spectra, noise power, and the coordination number lifetimes for varied temperatures. At high temperatures where there is no heterogeneous motion, the defect fluctuations have a white power spectrum, the coordination number lifetimes are very short, and there is an exponential decay in the distribution of lifetimes. As the temperature is lowered, the defect fluctuations show a power spectrum with increased noise power. We also find a peak in the noise power at a finite temperature we label . Near this temperature, the motion is highly heterogeneous and the coordination lifetimes are power law distributed. For temperatures below , the noise power is reduced and the coordination number lifetimes become extremely long. We also probe the system by examining the motion of a single particle driven by an external force. At there is a well defined threshold force for motion Hastings . At finite temperatures, creep occurs; however, there is a well defined kink in the velocity force curves at a threshold force which vanishes at . These results suggest that measuring topological defect fluctuations may be a useful probe for understanding glassy and jamming behaviors in disordered systems.
II Simulation
We consider a two-dimensional system with sides of length and with periodic boundary conditions in the and directions. The system contains particles interacting via a Yukawa or screened Coulomb potential. For any two particles and of charge and located at positions and , the pair interaction potential is . Here and is the screening length which is set equal to . We consider a 50:50 mixture of particles with charges and where . We have previously shown that this system forms a disordered assembly at all temperatures Hastings . The particles obey overdamped dynamics and the time dependent particle positions and velocities are obtained by integrating the overdamped Brownian dynamics brownian equations of motion, which for a single particle is
| (1) |
Here is the damping coefficient and . The particle-particle interactions are cut off at lengths larger than and are calculated using a neighbor index method for computational efficiency. Further cutoff lengths have negligible effects. The thermal force is modeled as random Langevin kicks with and . The initial conditions are obtained by simulated annealing. For our parameters, if all the charges are set equal to the larger charge , melting as defined by the onset of defects occurs at a temperature of . The driving force is applied to a single particle only, such that for the driven particle and for all other particles. For most of this work, we set . We anneal from a temperature of down to a final temperature in steps of and sit at each increment temperature for over Brownian dynamics (BD) time steps. After annealing, we analyze the topological defect density and particle motions at a fixed temperature. Unless otherwise noted, we consider systems of size containing particles.
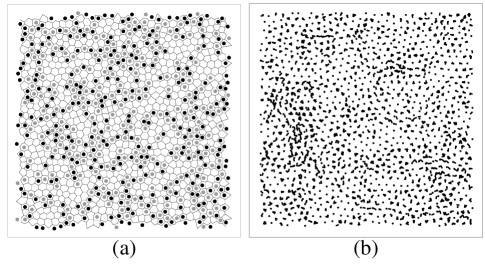
In Fig. 1(a) we show the topological defects as obtained from a Voronoi construction for a system at . The Voronoi construction forms a polygon around each particle and is used to define the coordination number of the particle. Particles with five, six, and seven neighbors corresponding to , 6, and 7 are marked black, white, and gray, respectively. The system is also highly defected at other temperatures and there is little change in the average defect density with temperature; however, the time dependent fluctuation rate of the defects changes significantly with temperature as we show later. In Fig. 1(b) we illustrate the particle trajectories during BD time steps at . The motion is highly heterogeneous, and certain regions show motion during this time interval while other regions do not. At higher temperatures the motion becomes more homogeneous throughout the sample.

III Defect Fluctuations and Power Spectra
In order to characterize the defect fluctuations, we perform a series of simulations at different and examine the time dependent density of six-fold coordinated particles, , defined as , where is the coordination number of particle . The power spectrum of the resulting time series is defined as
| (2) |
The noise power is defined as the average value of the noise spectrum at a particular value of the frequency . After annealing we wait time steps before acquiring the time series to avoid any transient behaviors. In Fig. 2(a) we show the power spectra of for and . At the power spectrum has a form with , as indicated by the upper solid line. For the noise spectrum is approximately white and . We plot the evolution of with in the inset of Fig. 2(a). For , we find noise with , while at high , the noise spectrum becomes white with . The particle trajectories also indicate that the motion is no longer heterogeneous for . In monodisperse systems near the disorder transition, a similar noise signal was observed when the particle motions were highly heterogeneous Reichhardt . We note that for there is very little particle motion and the defect fluctuations are strongly suppressed. This can be more clearly seen by examining the noise power at fixed as shown in Fig. 2(b). At high temperatures, is low, but it increases rapidly to a peak value as the temperature is reduced to , and then decreases quickly for . We associate the peak in at with the temperature at which the system begins to undergo a dynamical freezing.
In the inset of Fig. 2(b), we plot the variation in for systems of different sizes ranging from to 54. As increases, the peak in the noise power becomes more pronounced. Additionally, although the height of the peak in increases with , at higher or lower the noise power at the non-peak temperatures is reduced with increasing . For temperatures away from , the individual power spectrum curves have a rollover to a white spectrum at the lowest frequencies. At , the behavior persists down to the lowest frequencies, as shown in Fig. 2(a). The suppression of the noise power away from in the larger systems can be understood as arising from the fact that there is a length scale associated with the correlated creation or annihilation of defects. The fluctuations with the largest correspond to the lowest frequencies. If is constant, then when the system size is small or comparable to , the fluctuations will have a character down to the lowest observable frequencies and the noise power will be increased away from the peak in , as seen for in the inset of Fig. 2(b). As the system is made larger, the fluctuations begin to average out, a low frequency cutoff appears in the spectrum, and the noise power is reduced. Near the dynamical freezing temperature , the fluctuations grow with the system size and noise is present for all arbitrarily large and low . For , the fluctuations are again cut off and the noise power is reduced. We have compared our results against simulations of collections of non-interacting particles, where the motion is homogeneous and diffusive at all temperatures. In this case, there is no peak in and the spectra are white for all temperatures.

IV Diffusion
To quantify the amount of motion present in the system as a function of temperature, we measure the diffusion of the particles by computing the square displacements of the particles from an initial position as a function of time,
| (3) |
where is the position of particle at time with the effect of crossing the periodic boundary conditions removed. For particles undergoing normal diffusion, . In Fig. 3(a) we plot at , 2.5, 1.5, 1.0, and from top to bottom. The data was taken over a period of time steps which started after the system had entered a stationary state. In general, we find a transient time period which lasts for time steps after annealing. This transient behavior was excluded from the analysis so that time steps. For , the long time behavior of the system is consistent with normal diffusion, as indicated by the dashed line showing a linear slope in Fig. 3(a). For , within our time frame saturates to a constant value, while at the long time behavior is more consistent with subdiffusion, where . We note that this agrees with the measures of the noise fluctuations which indicate that the noise which appears at is associated with the presence of system-wide slow dynamics. For the fluctuations are instead associated with the rattling motions of single particles rather than long time system wide motions. In Fig. 3(b) we plot the value of obtained at the end of steps. For , saturates to a constant value since within our time frame the particles are no longer diffusing significantly, while increases with for higher .
We note that since we are restricted to performing simulations over finite periods of time, we cannot be certain that the subdiffusive motion at does not cross over to regular diffusion at extremely long times. If this were the case, the power spectrum of the corresponding very long time series would show a low frequency cutoff in the signature at the time scale where the regular diffusion begins to dominate. What we can conclude from our data is that over the time regimes which we are able to access, the appearance of the defect fluctuations is correlated with the subdiffusive behavior.
V Defect Lifetimes
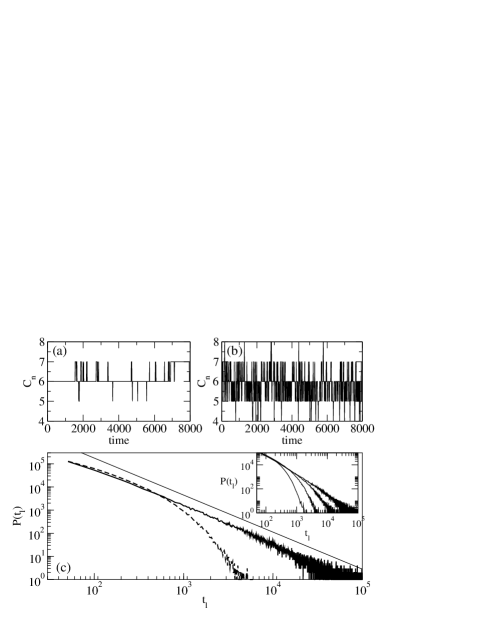
We next consider the lifetimes of the coordination numbers. In Fig. 4(a) we show the coordination number as a function of time for one particle in a system at . During this time frame, the particle is predominantly sixfold coordinated with , while there are occasional jumps to a configuration with or 7. In some cases, such as for , the particle maintains for a longer period of time. We obtain a similar plot regardless of which particle in the system is selected. In Fig. 4(b) we plot vs time for the same particle at , showing that the particle coordination number is changing much more rapidly. The coordination lifetimes are obtained by measuring the length of time that elapses between changes in for a given particle. We histogram this quantity over all the particles, and plot the resulting in Fig. 4(c) for two systems at (lower curve) and (upper curve). The straight solid line is a power law fit to with , while the curve at is fit well to a stretched exponential. In the inset of Fig. 4(c) we plot for , 3.5, 2.5, and , which shows that for the higher temperatures the average lifetime is shorter. For , can be fit reasonably well to an exponential distribution. For the intermediate temperatures, we can fit the data with a stretched exponential form, and at we obtain a power law fit. For , the lifetimes become extremely long and we observe close to a bimodal distribution where there are a few particles jumping back and forth giving rise to short values of , while of the other particles does not change for the duration of the simulations over times of BD steps.

VI Yielding Behavior
The results from Figs. 2, 3 and 4 suggest that near , some type of dynamical crossover or freezing occurs. We can also probe the system by slowly driving a single particle through it. If the system acts rigidly at low drives, then there is a threshold force above which the driven particle moves with respect to the background. Previous work on this system at has characterized this threshold force Hastings . Experiments have also shown evidence for a threshold force to motion for disordered colloidal systems Habdas . In general, we find that creep can occur at low but finite temperatures; however, a threshold force can still be identified by a sudden increase or kink in the particle velocity vs applied force. In Fig. 5 we plot the velocity vs applied drive for a single probe particle which has a charge moving through a disordered assembly of particles at temperatures ranging from to . If the surrounding particles are absent, the probe particle moves linearly with . The velocity-force curves are obtained by slowly increasing the applied drive . For , shows a sharp downward concavity at finite . We define the threshold force as the value at which . For , the curves show a slight positive concavity and if we linearly extrapolate the curves to , the threshold force is indistinguishable from zero. In the inset of Fig. 5 we plot the threshold force extracted from the velocity-force curves. We have considered various rates of increasing and find no differences in the extracted values of . The threshold decreases with increasing temperature up to , and above this temperature there is no threshold for motion. These results add further evidence that there is a dynamical freezing or jamming that occurs near , as also reflected in the defect fluctuations. We note that it is beyond the scope of this paper to determine the true nature of the finite temperature dynamical freezing, such as whether it resembles a glass transition.
VII Discussion
The main goal of this paper is to introduce a new measure, the fluctuations in the defect density, for characterizing disordered systems near freezing. The question of whether there is really a finite temperature freezing transition in the equilibrium system near is beyond the scope of our paper. Although we have found several signatures for some form of dynamical slowing down at , it is possible that for very long times beyond our simulation time scales, the system would show linear diffusion and the fluctuations would lose the characteristic at very low frequencies. We note that there is other evidence that topological fluctuations and defects appear to be correlated with jamming. Recently, the shape features of topological defects have been utilized to study the jamming transition in two-dimensional granular materials Abbatecondmat . In this case the fluctuations are nonthermal; however, a jamming transition can still occur. Measurements of fluctuations of for the granular system, in the manner we suggest in the present work, reveal the same trends that we have found here. The defect fluctuations have a white noise characteristic away from the jamming transition which crosses over to a signature near jamming with a peak in the finite frequency noise power Abbate . This indicates that the topological fluctuations near jamming or freezing may universally exhibit noise features.
There has also been recent work on two-dimensional binary glass forming systems showing correlations between the onset of glassy properties and the disappearance of certain types of topological defects at finite temperature. This adds further evidence that there may indeed be a finite temperature freezing or jamming transition in two-dimensional disordered systems that is connected with the motion of defects Hentchel .
VIII Summary
To summarize, we have shown that the topological defect fluctuations is a useful quantity that can be employed to understand dynamical freezing and heterogeneities in disordered systems. We specifically find that in regimes where there are dynamical heterogeneities, the time dependent defect density fluctuations show a characteristic noise spectrum, and that at higher temperatures where the motion is uniform, a white noise spectrum appears. The defect noise power also shows a peak just before the dynamics of the system freezes, and this effect is robust for increasing system sizes. The coordination number lifetimes show a power law distribution in the heterogeneous regions which crosses over to an exponential form at higher temperatures where the heterogeneities are lost. We correlate the peak in the noise power with the onset of subdiffusive behavior as well as with the temperature where a threshold force for the motion of a driven probe particle disappears. Our results should be testable for disordered charge-stabilized colloidal assemblies, dusty plasmas, and other disordered charged systems. We note that recent experiments on granular system near jamming have found the same type of behavior in the time series analysis of the defect fluctuations as the jamming transition is approached.
We thank M.B. Hastings for useful discussions. We also thank A. Abate for sharing his unpublished data with us. This work was supported by the U.S. DoE under Contract No. W-7405-ENG-36.
References
- (1) Y.J Lai and Lin I, Phys. Rev. Lett. 89, 155002 (2002).
- (2) W.Y. Woon and Lin I, Phys. Rev. Lett. 92, 065003 (2004).
- (3) B. Liu, J. Goree, and O.S. Vaulina, Phys. Rev. Lett. 96, 015005 (2006).
- (4) B. Cui, B. Lin, and S.A. Rice, J. Chem. Phys. 114, 9142 (2001); R. Zangi and S.A. Rice, Phys. Rev. Lett. 92, 035502 (2004).
- (5) R.P.A. Dullens and W.K. Kegel, Phys. Rev. E 71, 011405 (2005).
- (6) A. Ghazali and J.C.S. Levy, Europhys. Lett. 74, 355 (2006).
- (7) C. Reichhardt and C.J. Olson Reichhardt, Phys. Rev. Lett. 90, 095504 (2003).
- (8) W. Kob, C. Donati, S.J. Plimpton, P.H. Poole, and S.C. Glotzer, Phys. Rev. Lett. 79, 2827 (1997); C. Donati, J.F. Douglas, W. Kob, S.J. Plimpton, P.H. Poole, and S.C. Glotzer, ibid. 80, 2338 (1998); S.C. Glotzer, J. Non-Cryst. Solids 274, 342 (2000).
- (9) E.R. Weeks, J.C. Crocker, A.C. Levitt, A. Schofield, and D.A. Weitz, Science 287, 627 (2000); E.R. Weeks and D.A. Weitz, Phys. Rev. Lett. 89, 095704 (2002).
- (10) M.B. Hastings, C.J. Olson Reichhardt, and C. Reichhardt, Phys. Rev. Lett. 90, 098302 (2003).
- (11) M.P. Allen and D.J. Tildesley, Computer Simulation of Liquids (Oxford University Press, Oxford, 1987).
- (12) P. Habdas, D. Schaar, A.C. Levitt, and E.R. Weeks, Europhys. Lett. 67, 477 (2004).
- (13) A.R. Abate and D.J. Durian, cond-mat/0604632.
- (14) A. Abate et al., to be published.
- (15) E. Aharonov, E. Bouchbinder, H.G.E. Hentschel, V. Ilyin, N. Makedonska, I. Procaccia, and N. Schupper, cond-mat/0608305.