Observation of three-dimensional bulk Fermi surfaces for a strongly correlated material by soft x-ray -dependent (700-860 eV) ARPES
Abstract
Three-dimensional Fermi surfaces at a high temperature have been clarified for a strongly correlated Ce compound, ferromagnet CeRu2Ge2 in the paramagnetic phase, by virtue of a soft x-ray -dependent (700-860 eV) ARPES. Although the observed Fermi surfaces as well as quasiparticle dispersions are partly explained by a band-structure calculation based on a localized model, qualitative discrepancy in experiments, between our APRES in the paramagnetic phase and de Haas-van Alphen measurement in the ferromagnetic phase, is revealed. This suggests a fundamental change in the contribution to the Fermi surfaces across the magnetic phase transition widely seen for Ce compounds.
pacs:
71.18.+y, 71.27.+a, 79.60.-iMany macroscopic properties of solids such as resistivity, specific heat and susceptibility depend strongly on momentum distribution of electrons on the chemical potential, namely, shapes and characters of the Fermi surfaces. Therefore, detection of the Fermi surfaces is important to clarify the electronic properties of solids. The quantum oscillation measurement using de Haas-van Alphen (dHvA) effect is known as a powerful technique to observe the cross-sections of the Fermi surfacesAandM . The dHvA measurement has so far been applied also for many strongly correlated rare-earth materialsCeNi ; CeCu6 ; CeRuSi_2 . Since the successful consistency between the experimentally observed Fermi surfaces and the band-structure calculation assuming itinerant electrons for CeSn3CeSn3_1 ; CeSn3LDA , the dHvA mesurement has been recognized as a convincing tool to qualitatively judge whether the electrons are ”itinerant” or ”localized” for the ground state of strongly correlated Ce compounds. However, the Fermi surfaces at high temperature above several tens K, at which the electronic structures are often deviated from the ground state due to magnetic phase transitions and/or the Kondo effect, have not been experimentally clarified for many Ce compounds because a low temperature is required for the dHvA measurement. The low- angle-resolved photoemission spectroscopy (ARPES) is also useful to reveal the characters of the two-dimensional and/or surface Fermi surfaces as seen in the results for high- cupratesDamRMP . As for the rare-earth compounds, ARPES measurements for XRu2Si2 (X = La, Ce, Th, U) have been performed by using in a 14-230 eV rangefs_La-Ce . Recently high-energy (500 eV) photoemission is found to be very effective in probing bulk statesbulk ; Si_Ge_res ; High-energyARPES ; Suga_B . In this letter, we demonstrate the power of soft x-ray -dependent ARPES for clarifing the bulk three-dimensional Fermi surface topology of a strongly correlated rare-earth compound, whose electronic states are mutually different between the bulk and surfaceSi_Ge_res .
We have performed the ARPES measurements for CeRu2Ge2 which has one electron per unit cell then we have compared with the band calculation for electron localized model LaRu2Ge2. CeRu2Ge2 is a requisite material to understand the electronic states of Ce heavy fermion systems because the rather localized electrons become itinerant under high pressuresHP . CeRu2Ge2 is a ferromagnet with 8 Kele_heat ; TC and the electrons of CeRu2Ge2 are thought to be localized because RKKY interaction is dominant compared with the Kondo effect at low temperatures with the electronic specific heat coefficient of about 20 mJ/mol K2ele_heat and the Kondo temperature 1 Kneutron ; KondoTemp . CeRu2Ge2 crystallizes in a tetragonal ThCr2Si2-type structure with a=4.268 Å and c=10.07 Å at 18 Kele_heat and its Brillouin zone is shown in Fig. 1(a). On the other hand, isostructural CeRu2Si2 has itinerant electrons with its low-temperature electronic specific heat coefficient of about 350 mJ/mol K2 Si_ele_heat and 20 KKondoTemp . These properties are consistent with the bulk sensitive - resonant photoemission resultsSi_Ge_res . The larger lattice constant of CeRu2Ge2 than that of CeRu2Si2 makes such different electron properties.
CeRu2Ge2 single crystal was grown by the Czochralski pulling method. The high energy ARPES measurements have been performed from =700 to 860 eV with an energy step of 5 eV at BL25SU in SPring-8SR . The light incidence angle was degrees with respect to the sample surface normal. The base pressure was about Pa. We have performed the measurements at 20 K, where the sample was in the paramagnetic phase. The clean surface was obtained by cleaving in situ providing a (001) plane. A GAMMADATA-SCIENTA SES200 analyzer was used covering more than a whole Brillouin zone along the direction of the slit. The energy resolution was set to 200 meV for Fermi surface mapping. The cleanliness was confirmed by the absence of the O 1s and C 1s photoemission signals. First, we have performed mapping at several and angles. After determining the corresponding to the high symmetry points along the [001] direction, we have performed detailed angle-dependent ARPES for mapping. Then we have performed dependent ARPES for mapping through the high symmetry points in the Brillouin zone.
In order to experimentally determine the exact value of , we have taken the incident photon momentum into account. If x-ray was incident onto a sample at 45 degrees with respect to the surface normal, for example, this incident photon has the momentum parallel () and perpendicular () to the surface, which are (Å-1)=(eV). In the case of eV, the photon momentum values of both and are about 0.25 Å-1. Because the value of the 1st Brillouin zone of CeRu2Ge2 ( Å-1) is comparable to the value of the photon momentum, both and cannot be negligible.
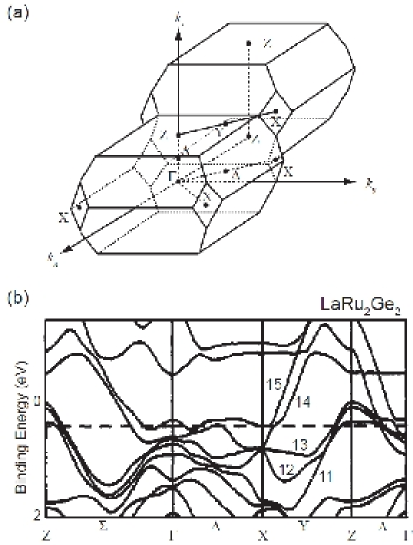
The observed ARPES data have been compared with the band calculation of paramagnetic LaRu2Ge2 performed by H. Yamagami and A. HasegawaGe with using a symmetrized relativistic augmented-plane wave (APW) methodAPW . According to their calculation, five bands (11 - 15) cut the Fermi level () (Fig. 1(b)) forming five Fermi surfaces which are composed of the La and Ru states. Five Fermi surfaces are likewise derived for the itinerant electron system CeRu2Si2Ce . Between the localized LaRu2Ge2 and itinerant CeRu2Si2, the shapes of Fermi surfaces derived from the bands 11 to 14 are not much different but the shape of the band 15 is mutually different. Among the calculated bands of LaRu2Ge2, the lower four bands from 11 to 14 form the hole-like Fermi surfaces which are centered at the Z point in the Brillouin zone, and the highest band 15 forms the electron-like Fermi sheet.
Figure 2(a) shows the energy distribution curves (EDCs) along the in-plane X - Z - X direction for CeRu2Ge2. The positions of the wave number where each band cuts is also estimated by the momentum distribution curves(MDCs). Five bands corresponding to the bands 11 to 15 predicted by the band calculation for LaRu2Ge2 are clearly seen. There is a clear peak near at the Z point in Fig. 2(a). The presence of this peak is in a strong contrast to the result of the band-structure calculation for LaRu2Ge2, which predicts no quasiparticle peak near at the Z point in Fig. 1(b). It is thus revealed that the band 11 is located on the occupied side and does not form the Fermi surface. Although the band 15 does not cut at the X point in the calculation for LaRu2Ge2, our experimental results show that the band 15 exists on the occupied side at the X point. Figure 2(b) shows EDCs along the in-plane Z - - Z direction. The comparison between Fig. 1 (b) and Fig. 2 has shown the similarity of the observed bands 15 and 14 in CeRu2Ge2 with the result of the band calculation of LaRu2Ge2.
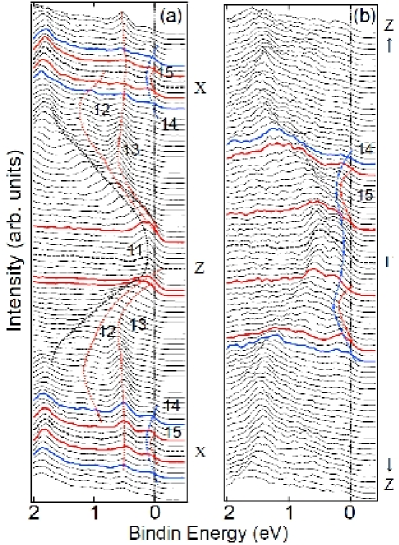
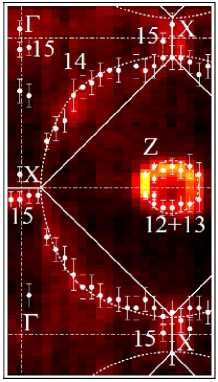
Figure 3 displays Fermi surfaces’ topology at by integrating the intensity around of EDCs. The X - Z - X line corresponds to Fig. 2(a). The intensities around the Z point are due to the bands 11-13. We have clearly observed the small Fermi surface contours around the Z point derived from both bands 12 and 13 and the large Fermi surface contour derived from the band 14 as judged from Fig. 2(a). Furthermore, we recognize a small Fermi surface contour centered at the X point. The possible origin of this small Fermi surface is the band 15, whereas its crossing is not predicted by the calculation for LaRu2Ge2.
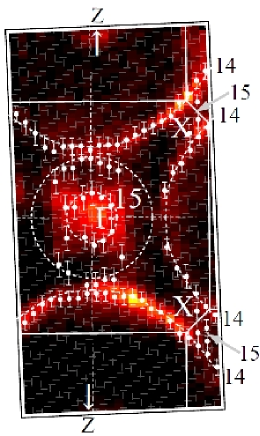
Figure 4 demonstrates Fermi surfaces’ topology at . The Z - - Z line corresponds to Fig. 2(b). The very large Fermi surface derived from the band 14 is clearly seen around the Z points. Furthermore a part of the Fermi surface derived from the band 15, whose shape looks like a doughnut centered at the point according to the calculation for LaRu2Ge2, can be traced.
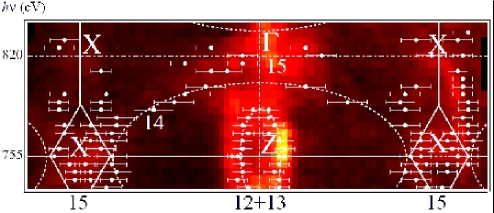
Meanwhile, Fig. 5 shows the Fermi surface slice at plane measured with an energy step of 5 eV. In this figure are recognized the Fermi surfaces 12 and 13 centered at the Z point, which are prolongated along the direction. The very large Fermi surface 14 compressed vertically can be also experimentally traced. Along the horizontal X - - X direction, the band 15 cuts near the and X points. The Fermi surface of the band 15 is only partly observed near the point because of the noticeable background. The nonnegligible intensities around the point and the Z point suggest the proximity of the band 14 and the band 11, respectively, which are not crossing near these points but staying in the vicinity of as we can see in Fig. 2. We have also observed the Fermi surface continuing along the ordinate X - X axis derived from the band 15. In our Fermi surface mapping, this Fermi surface along the X - X axis in Fig. 5 is also detected near the X point in Fig. 3 corresponding to the upper X - Y - Z plane (Fig. 1(a)) and also near the X point in Fig. 4 corresponding to the middle - - X plane (Fig. 1(a)).
The band calculation for LaRu2Ge2 predicts that there are three hole pockets derived from the band 11-13 and a large hole Fermi surface derived from the band 14 centered at the Z point. In addition it predicts that the band 15 forms both a doughnut-like electron pocket centered at the point and a discontinuous Fermi surface along the ordinate X - X direction. On the other hand, the dHvA measurements for CeRu2Ge2 in the ferromagnetic phase have confirmed the existence of all Fermi surface sheets spin-splitdHvA ; dHvA_1 corresponding to the bands 11-15 predicted for LaRu2Ge2. The agreement between the experimental Fermi surfaces by dHvA and ARPES measurements and the calculated results is quite good for the bands 12, 13 and 14.
From our ARPES results, however, the Fermi surface of CeRu2Ge2 derived from the band 11 is found not to exist as revealed in Fig. 2(a). It is also found that the band 15 has a continuous Fermi surface along the direction in the paramagnetic phase. These results are in a strong contrast to the dHvA results in the ferromagnetic phase. Although the Fermi surface of CeRu2Ge2 in the ferromagnetic phase is similar to that of LaRu2Ge2, the difference of our ARPES results from them are consistently understood if of CeRu2Ge2 in the paramagnetic phase is energetically higher than that of the calculation for LaRu2Ge2. shift of CeRu2Ge2 in the paramagnetic phase from LaRu2Ge2 or CeRu2Ge2 in the ferromagnetic phase is thought to be due to the increased number of the electrons contributing to the near bands in CeRu2Ge2, where the weak but nonnegligible hybridization of the Ce electron should be additionally taken into account in the paramagnetic phase. The difference of the electric resistivity between CeRu2Ge2 and LaRu2Ge2 is suddenly diminished below of CeRu2Ge2ele_heat , indicating the reduction of electron scattering by the ferromagnetic ordering. This suggests that the contribution of the electrons to the Fermi surfaces due to the hybridization is reduced in the ferromagnetic phase. Then the number of the electrons contributing to the Fermi surfaces decreases below . Accordingly, the band 11 crosses near the Z point and the band 15 might form discontinuous Fermi surfaces along the X - X () direction as predicted by the band-structure calculation.
We have performed three-dimensional bulk-sensitive ARPES measurements for paramagnetic CeRu2Ge2 by using soft x-rays. Although the Fermi surfaces obtained for the bands 12, 13 and 14 are in good agreement with the result of the band calculation for paramagnetic LaRu2Ge2, the predicted band 11 is found to be not contributing to the Fermi surface in paramagnetic CeRu2Ge2. The band 15 is confirmed to have the doughnut-like shape around the point whereas a rod-like continuous Fermi surface along the X - X axis is observed in a strong contrast to the band calculation. The slight hybridization in the paramagnetic phase and the magnetic ordering below are thought to be essential to understand the behaviors of three-dimensional electronic structures of CeRu2Ge2.
We are grateful to H. Yamagami for fruitful discussions. We thank T. Miyamachi and H. Higahsimichi for their help in the experiments. The present work was performed at SPring-8 under the proposal (2004A6009-NS-np, 2004B0400-NSa-np) supported by the Grant-in-Aids for Creative Scientific Research (15GS0213) of MEXT Japan and 21st Century COE program (G18) of Japan Society for Promotion of Science.
References
- (1) N. W. Ashcroft, and N. D. Mermin, 1976, Solid State Physics (Saunders College, Philadelphia).
- (2) H. Yamagami and A. Hasegawa, J. Phys. Soc. Jpn. 60, 1011 (1991).
- (3) P. H. P. Reinders, M. Springford, P. T. Coleridge, R. Boulet, and D. Ravot, Phys. Rev. Lett. 57, 1631 (1986).
- (4) G. Zwicknagl, Adv. Phys. 41, 203 (1992).
- (5) W. R. Johanson, G. W. Crabtree, A. S. Edelstein and O. D. McMasters, Phys. Rev. Lett. 46, 504 (1981).
- (6) A. Hasegawa et al., J. Phys. Soc. Jpn. 59, 2457 (1990).
- (7) A. Damascelli, Z. Hussain, and Z.-X. Shen, Rev. Mod. Phys. 75, 473 (2003).
- (8) J.D. Denlinger et al., J. Electron Spectrosc. Relat. Phenom. 117, 347 (2001).
- (9) A. Sekiyama et al., Nature (London) 403, 396 (2000).
- (10) A. Sekiyama et al., J. Phys. Soc. Jpn. 69, 2771 (2000).
- (11) A. Sekiyama et al., Phys. Rev. B 70, 060506(R) (2004).
- (12) S. Suga et al., Phys. Rev. B 70, 155106 (2004).
- (13) H. Wilhelm and D. Jaccard, Phys. Rev. B 69, 214408 (2004).
- (14) M.J. Besnus et al., Physica B 171, 350 (1991).
- (15) A. Böhm et al., J. Magn. Magn. Mater. 76-77, 150 (1988).
- (16) A. Loidl et al., Phys. Rev. B 46, 9341 (1992).
- (17) A. Loidl, G. Knopp, H. Spille, F. Steglich, A.P. Murani, Physica B 156, 794 (1989).
- (18) G. G. Lonzarich, J. Magn. Magn. Mater. 76-77, 1 (1988).
- (19) Y. Saitoh et al., J. Synchrotron Rad. 5, 542 (1998).
- (20) H. Yamagami and A. Hasegawa, J. Phys. Soc. Jpn. 63, 2290 (1994).
- (21) H. Yamagami and A. Hasegawa, J. Phys. Soc. Jpn. 59, 2426 (1990).
- (22) H. Yamagami and A. Hasegawa, J. Phys. Soc. Jpn. 62, 592 (1993).
- (23) C.A. King and G.G. Lonzarich, Physica B 171, 161-165 (1991).
- (24) H. Ikezawa et al., Physica B 237, 210 (1997).