Ion and polymer dynamics in polymer electrolytes PPO-LiClO4:
insights from NMR line-shape analysis
Abstract
We investigate ion and polymer dynamics in polymer electrolytes PPO-LiClO4 performing 2H and 7Li NMR line-shape analysis. Comparison of temperature dependent 7Li and 2H NMR spectra gives evidence for a coupling of ion and polymer dynamics. 2H NMR spectra for various salt concentrations reveal a strong slow down of the polymer segmental motion when the salt content is increased. The 2H NMR line shape further indicates that the segmental motion is governed by dynamical heterogeneities. While the width of the distribution of correlation times is moderate for low and high salt content, an extremely broad distribution exists for an intermediate salt concentration 15:1 PPO-LiClO4. For the latter composition, a weighed superposition of two spectral components, reflecting the fast and the slow polymer segments of the distribution, describes the 2H NMR line shape over a broad temperature range. Analysis of the temperature dependent relative intensity of both spectral components indicates the existence of a continuous rather than a discontinuous distribution . Such continuous distribution is consistent with gradual fluctuation of the local salt concentration and, hence, of the local environments of the polymer segments, whereas it is at variance with the existence of large salt-depleted and salt-rich domains featuring fast and slow polymer dynamics, respectively. Finally, for all studied mixtures PPO-LiClO4, the 2H NMR line shape strongly depends on the echo delay in the applied echo-pulse sequence, indicating that the structural relaxation of the polymer segments involves successive rotational jumps about small angles .
I Introduction
Many polymers can dissolve salts so as to form mixtures supporting high ionic conductivity. These polymer electrolytes are promising candidates for applications in electrochemical devices such as solid state batteries. However, the use of these materials is limited by the achievable electric conductivities at ambient temperature and, hence, there is considerable interest to accelerate the ionic diffusion. Such efforts require a thorough understanding of the mechanisms for the ion transport. Despite considerable progress over the past decades, a general theory of ion dynamics in polymer electrolytes is still lacking.
The interactions of cations and anions with the polymer matrix are important factors governing the charge transport in polymer electrolytes. It is well established that the segmental motion of the host polymer facilitates the ionic diffusion.Armand ; Ratner However, the understanding of this coupling is incomplete. For example, it was emphasized that couplings for the ionic species may differ since cation-polymer interactions are stronger than anion-polymer interactions.Vincent In addition, structural inhomogeneities can affect ionic diffusion in polymer electrolytes. Along these lines, it was stressed that the spatial distribution of the ions, in particular the formation of ionic aggregates, is a relevant factor of the charge transport in polymer electrolytes.Vincent ; Stolwijk ; Ferry ; Frech In general, the relevance of all these aspects depends on sample composition and temperature, leading to a further complication for a comprehensive theoretical treatment.
Polymer electrolytes based on polypropylene oxide (PPO) have attracted much attention because of their high ionic conductivities together with an amorphous nature. Armand We use 2H and 7Li NMR to investigate mixtures PPO-LiClO4 with different salt concentrations or, equivalently, different ether oxygen to lithium ratios, O:Li. In the past, various experimental methods were used to characterize structure and dynamics of the PPO-LiClO4 system. The electric conductivity at room temperature shows a broad maximum at intermediate O:Li ratios ranging from about 10:1 to 30:1.McLin ; Furukawa For such intermediate salt concentrations, differential scanning calorimetry (DSC) revealed two glass transition steps,Moacanin ; Vachon_1 ; Vachon_2 suggesting a liquid-liquid phase separation into salt-rich and salt-depleted regions. Likewise, an inhomogeneous structure in the intermediate composition range was proposed to explain results from dielectric spectroscopy (DS),Furukawa which give evidence for the existence of two processes related to fast and slow polymer dynamics. Consistently, for PPO-NaCF3SO3, fast and slow relaxation processes were found using photon correlation spectroscopy (PCS).Bergman In contrast, other studies on polymer electrolytes PPO-LiClO4 challenged the existence of salt-rich and salt-depleted microphases. Small angle neutron scattering indicated that there are no structural inhomogeneities on a length scale of several nanometers, Carlsson_1 in harmony with the interpretation of data from coherent quasielastic neutron scattering (QENS).Carlsson_2 Finally, it was proposed that these apparent discrepancies can be reconciled based on a structure model resulting from reverse Monte-Carlo (RMC) simulations of diffraction data.Carlsson_3 Specifically, the RMC model of PPO-LiClO4 features salt-rich and salt-depleted regions on a small length scale of about . In addition, it reveals that the chain conformation changes as a consequence of coordination to the cations.
In view of the importance of the polymer dynamics for the ionic migration, there is considerable interest to ascertain how presence of salt affects the segmental motion in polymer electrolytes. For PPO as host polymer, it was established that addition of salt slows down the polymer dynamics.Furukawa ; Bergman ; Carlsson_2 ; Torell ; Roux This effect was regarded as a consequence of cations acting as transient intra- or intermolecular cross links between different monomers, leading to a reduction of chain flexibility. Furthermore, neutron and light scattering studies reported that the PPO dynamics is more nonexponential when salt is present.Carlsson_2 ; Torell This additional stretching was explained by either heterogeneous effects, Torell i.e., a broadening of the distribution of correlation times , or homogenous effects, Carlsson_2 i.e., intrinsic stretching. Finally, a DS study on PPO-LiClO4 reported that, over a broad concentration and temperature range, there is a linear relationship between the ionic diffusion coefficient and the relaxation rate of the polymer segments in contact with salt,Furukawa suggesting that the segmental motion triggers the elementary steps of the ionic migration.
Concerning NMR work on polymer electrolytes, several studies provided insights into the ion dynamics, whereas applications on the polymer motion are rare. In detail, NMR field-gradient techniques were used to determine cationic and anionic self diffusion coefficients,Vincent ; Arumugam ; Ward while measurements of the NMR spin-lattice relaxation and the line shape provided information about ion dynamics on a more local scale.Roux ; Chung_1 ; Chung_2 ; Adamic ; Fan ; Donoso ; Forsyth On the other hand, investigation of polymer dynamics was limited to analysis of 1H spin-lattice relaxation at high temperatures.Ward ; Roux ; Donoso Here, we use 7Li and 2H NMR to study both the ion and the polymer dynamics in polymer electrolytes PPO-LiClO4. In particular, we exploit that 2H NMR provides straightforward access to the rotational jumps of specific polymer segments.Spiess While 2H NMR line-shape analysis is in the focus of the present contribution, future work will present 2H NMR multi-time correlation functions. Using this concerted approach, we ascertain in detail to which extent the presence of salt affects the segmental motion in polymer electrolytes.
II Experiment
In addition to the neat PPO melt, we investigate polymer electrolytes PPO-LiClO4 with three salt concentrations, namely, 30:1, 15:1 and 6:1. PPO () and LiClO4 were purchased from Polymer Source Inc. and Aldrich, respectively. Strictly speaking, the used polymer was poly(propylene glycol), having terminal OH groups. To prepare the polymer electrolytes, weighed amounts of PPO and LiClO4 were dissolved in acetonitrile. The resulting mixtures were stirred at 80∘C until a clear homogeneous solution was obtained. Afterwards, solvent and moisture were removed on a vacuum line for several days. The resulting samples were sealed in the NMR tube. 1H and 13C NMR spectra confirmed absence of water and solvent.
A Netsch DSC-200 instrument was used to perform DSC experiments at a heating rate of . We find glass transition temperatures for PPO and 30:1 PPO-LiClO4, consistent with results reported in the literature.Furukawa ; McLin ; Torell ; Vachon_1 For 6:1 PPO-LiClO4, we obtain , which is smaller than the literature value,Vachon_1 suggesting some differences in the respective compositions. For 15:1 PPO-LiClO4, a very broad glass transition range extending from about to is observed. In previous studies, two glass transition temperatures and were found for the 16:1 composition.Vachon_1
The 2H (7Li) NMR experiments were performed on Bruker DSX 400 and DSX 500 spectrometers working at Larmor frequencies of () and (), respectively. Two Bruker probes were used to apply the radio frequency pulses resulting in pulse lengths between and , depending on the nucleus and setup. A flow of nitrogen gas controlled by a Bruker VT 3000 heading unit was utilized to adjust the sample temperature. To remove deviations between set and actual temperature within an uncertainty of , temperature calibration was done using 207Pb NMR spectra of lead nitrate.Takahashi Comparing 2H NMR spectra for different setups, we determined that neither the magnetic field strength nor the probe affects the results. Moreover, changing the sample position within the coil, we found no evidence for the presence of temperature gradients in the sample. The solid-echo pulse sequence was applied to measure the 2H and 7Li NMR spectra. To take into account the respective nuclear spin ,Kanert the sequences - - and - - were used in 2H NMR and 7Li NMR, respectively. The 2H spin-lattice relaxation times were measured utilizing the saturation-recovery pulse sequence.
III Theory
III.1 Basics of 2H and 7Li NMR
In solid-state 2H NMR and 7Li NMR, the first order quadrupolar interaction, describing the interaction of the nuclear quadrupole moment with the electric field gradient (EFG) at the nuclear site, is the dominant internal interaction. It results in a frequency shift, , which is detected in the experiment. Specifically, the quadrupolar precession frequency is given bySpiess
| (1) |
Here, and specify the orientation of the principal axes system of the EFG tensor with respect to the external static magnetic flux density and is the asymmetry parameter of this tensor. The anisotropy parameter is related to the quadrupolar coupling constant according to for 2H () and for 7Li (). For the 2H nucleus, the two signs in Eq. (1) correspond to the two allowed transitions between the three Zeeman levels. For the 7Li nucleus, these signs are associated with two satellite transitions , while the first order quadrupolar interaction does not affect the frequency of the central transition .
In 2H NMR, the EFG tensor is intimately linked to the molecular frame. In our case of deuterated PPO, [CD2-CD(CD3)-O]n, the monomeric unit features three deuterons in the backbone and three deuterons in the methyl group, which will be denoted as B deuterons and M deuterons, respectively. For the B deuterons, the EFG tensor is axially symmetric, i.e., , and its principal axis points along the direction of the C-D bond.Spiess For the M deuterons, fast rotation of the methyl group leads to an averaging of the coupling tensor at the studied temperatures. The averaged tensor is also axially symmetric and its principal axis is aligned with the three-fold symmetry axis of the methyl group.Spiess Altogether, the quadrupolar precession frequency for the B and M deuterons can be written as
| (2) |
Here, due to the motional averaging, the anisotropy parameters of the B and the M deuterons are related according to .Spiess For the B deuterons, specifies the angle between and the direction of the C-D bond, whereas, for the M deuterons, denotes the angle between and the three-fold symmetry axis of the methyl group. In polymer melts, there is an isotropic distribution of molecular orientations and, hence, a broad spectrum results from the powder average at low temperatures, when molecular dynamics can be neglected. In 2H NMR, this rigid-lattice spectrum has a specific line shape, called Pake spectrum.Spiess For PPO, we expect a superposition of two Pake spectra since the anisotropy parameters for the B and the M deuterons are different.
In 7Li NMR, rigid-lattice spectra are comprised of two contributions resulting from the central and the satellite transitions, respectively. The central transition, being independent of the quadrupolar interaction, yields a narrow line, while a broad spectral component results from the satellite transitions due to the action of the quadrupolar interaction together with the powder average, see Eq. (1). In polymer electrolytes, the large diversity of lithium ionic environments leads to a broad variety of EFG tensors and, hence, values of and . Therefore, one expects a rather unstructured satellite component.Chung_1
III.2 2H and 7Li NMR line-shape analysis
Molecular dynamics with correlation times on the order of the inverse spectral width, i.e., on the order of microseconds, results in a collapse of the discussed 2H and 7Li NMR rigid-lattice spectra. In 2H NMR, there is a well defined relation between the resonance frequency and the orientation of specific molecular units, see Eq. (2), and, hence, analysis of the time dependence provides straightforward access to the polymer segmental motion. In 7Li NMR, line-narrowing of the satellite component indicates a variation of the EFG tensor at the nuclear site with time, which can result from either lithium ionic motion or, for a static ion, from a rearrangement of the neighboring polymer chains. In polymer electrolytes, both dynamic processes occur on a similar time scale and, hence, it is difficult to disentangle effects due to ion and polymer dynamics. The central line is broadened due to dipolar interactions between the magnetic moments of different nuclei, which are more important in 7Li than in 2H NMR. Since homonuclear and heteronuclear dipole-dipole interactions contribute, also the central line narrows as a consequence of both ion and polymer dynamics.
III.2.1 2H NMR two-phase spectra
To discuss effects of molecular dynamics on the 2H NMR line shape in more detail, let us assume that there is a single anisotropy parameter . Further, we suppose that the polymer segments show isotropic reorientation, as may be expected in the melt.Spiess If this dynamics is characterized by a single correlation time , a rigid-lattice spectrum and a Lorentzian line will be found at low and high temperatures, respectively, where the limits of slow motion () and fast motion () are valid, while a crossover will occur for . For polymer electrolytes, a distribution of correlation times can be expected so that both fast and slow segmental reorientation may occur at the same temperature. Then, the spectrum would be comprised of a weighed superposition of a rigid-lattice spectrum and a narrow line.Roessler_2 ; Roessler In general, such ”two-phase spectra” can result from two limiting cases for the shape of the distribution of correlation times . On the one hand, it is possible that the existence of well defined microphases is reflected in a discontinuous distribution of correlation times, which is comprised of two narrow non-overlapping contributions and associated with fast segmental motion in salt-depleted domains () and slow segmental motion salt-rich domains (). On the other hand, one can imagine that gradual fluctuations in the local salt concentration lead to a wide variety of local environments that manifests themselves in a very broad continuous distribution . Then, the fast and slow segments of this continuous distribution would yield a narrow line and a rigid-lattice spectrum, respectively, whereas contributions from segments with are negligible.Roessler_2 ; Roessler
In both limiting cases, the temperature dependent normalized spectral intensity can be written asRoessler_2 ; Roessler
| (3) |
Here, and are the normalized line shapes for the limits of fast and slow motion, respectively. The weighting factor of the former spectral pattern () is related with the distribution of correlation times according to
| (4) |
Based on the temperature dependence of the weighting factor, it is possible to distinguish between both limiting cases for the shape of the distribution . For a discontinuous distribution, two rapid rises of separate three temperature ranges in which the weighting factor is constant. Specifically, at low temperatures (), at intermediate temperatures (), and at high temperatures (). Here, is the contribution of to the total distribution of correlation times. In contrast, the temperarure dependent shift of a broad continuous leads to a gradual variation of . For a logarithmic Gaussian distribution, characterized by a temperature independent width,
| (5) |
one obtains after short calculation
| (6) |
where and is the error function. Therefore, given the temperature dependent shift of is known, analysis of provides information about the width of this distribution, as will be used below.
III.2.2 2H NMR spectra for various solid-echo delays
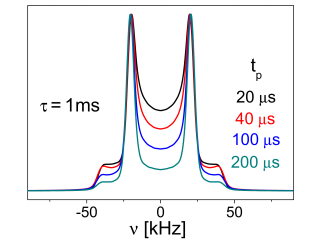
Finally, we illustrate that, in 2H NMR, variation of the echo delay in the solid-echo pulse sequence provides access to the reorientational mechanism, as was shown for various types of motion.Spiess_2 ; Vold ; Jones ; Pschorn ; Vogel_1 ; Vogel_2 ; Roessler ; Vogel_3 ; Vogel_4 ; Aze For polymer melts, it was reported that the isotropic reorientation of the polymer segments during the process results from successive rotational jumps about small angles.Spiess ; Pschorn ; Tracht Then, the elementary rotational jumps occur on a much shorter time scale, than the overall loss of correlation. Strictly speaking, the ratio of the jump correlation time and the correlation time depends on the jump angle according toAnderson
| (7) |
Thus, for small jump angles , say, one may encounter a situation at appropriate temperatures. In the literature, it was shown that, in this case, the 2H NMR line shape shows a characteristic dependence on the echo delay . Pschorn ; Vogel_1 ; Roessler ; Vogel_3 To illustrate the effects, we calculate 2H NMR spectra from random-walk (RW) computer simulations. The methodology of these computation was described in previous work.Vogel_1 ; Vogel_3 Here, we assume that C-D bonds perform isotropic rotational jumps with a jump angle , which is a typical value for the process near the glass transition.Tracht ; Roessler Further, we use a correlation time , corresponding to a jump correlation time . In Fig. 1, we show 2H NMR spectra resulting from such dynamics for various values of . We see that the intensity in the center of the solid-echo spectrum strongly decreases with respect to the intensity of the ”horns” when the echo delay is extended. The characteristics of this effect depend on the value of the correlation time and the jump angle so that, in principle, the dependence of the line shape enables determination of these quantities. However, we refrain from such analysis since unambiguous quantification will be difficult if distributions of correlation times and jump angles exist, as expected in our case.
IV Results
IV.1 2H NMR spin-lattice relaxation
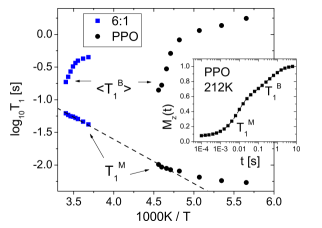
First, we measure the 2H NMR spin-lattice relaxation of the mixtures PPO-LiClO4. The inset of Fig. 2 shows the recovery of the normalized longitudinal magnetization for PPO at . We see a two-step increase as a consequence of diverse spin-lattice relaxation behaviors of the different deuteron species. Specifically, due to fast three-fold jumps of the methyl group, the M deuterons exhibit faster spin-lattice relaxation than the B deuterons. Therefore, we interpolate the data with the function
| (8) |
to extract the respective spin-lattice relaxation times. In doing so, we consider our finding that the spin-lattice relaxation of the M deuterons () and the B deuterons () is exponential and nonexponential, respectively, see below. In harmony with an equal amount of M and B deuterons in the monomeric unit of the studied polymer, we obtain coefficients from these fits. In Fig. 2, we see that the spin-lattice relaxation time decreases upon cooling, indicating for the methyl group jumps at the studied temperatures.BPP Below , a somewhat weaker temperature dependence of suggests that the minimum () is approached. Above , the values for PPO and 6:1 PPO-LiClO4 fall on the same line and, hence, the presence of salt does not affect the methyl group motion. Interpolation of these data with an Arrhenius law yields an activation energy . Consistent with our results, QENS work on PPO-LiClO4 found that an exponential correlation function, which is not affected by addition of salt, describes the methyl group jumps.Ea ; Andersson However, this study reported a somewhat higher activation energy of .
In harmony with previous 2H NMR work on molecular and polymeric glass formers near ,Roessler ; Schnauss ; Leissen we find that the 2H spin-lattice relaxation of the B deuterons is nonexponential. Fitting the data for PPO at to Eq. (8), we obtain a stretching parameter , see Fig. 2. For the studied polymer electrolytes PPO-LiClO4, including the compositions 15:1 and 30:1, which were measured at a Larmor frequency , we find stretching parameters in the range at temperatures somewhat above . Therefore, we use the -function to calculate the mean spin-lattice relaxation time according to . In Fig. 2, it is evident that increases when the temperature is decreased, indicating for the segmental motion at the studied temperatures. Further, we see that is shifted to higher temperatures for 6:1 PPO-LiClO4, implying that addition of salt slows down the dynamics of the B deuterons. In particular, for both samples, the curves show a kink near the respective glass transition temperature, as was observed for other glass-forming liquids.Roessler ; Lusceac
In the literature,Roessler ; Leissen it was demonstrated that nonexponential 2H spin-lattice relaxation is due to a distribution of spin-lattice relaxation times, . Since depends on the spectral density , which is given by the Fourier transform of the correlation function, such distribution indicates the existence of a distribution of correlation times. In general, fast relaxation processes, e.g., a process, can dominate the spin-lattice relaxation near so that a priori it is not clear whether this distribution of correlation times is associated with the process.Roessler For PPO, findings in DS and PCS give no evidence for the presence of fast processes other than the methyl group motion,Furukawa ; Bergman consistent with our 2H NMR results, see below. Therefore, we conclude that the nonexponential 2H spin-lattice relaxation of the B deuterons results from a distribution for the process. Thus, dynamical heterogeneities govern the structural relaxation of the host polymer in polymer electrolytes PPO-LiClO4, as was shown for neat polymer melts and supercooled molecular liquids.Spiess ; Roessler ; 13
IV.2 2H NMR line shape


In Figs. 3-6, we present temperature dependent 2H NMR spectra of PPO-LiClO4 mixtures. At low temperatures, the rigid-lattice spectra () are comprised of two Pake spectra, reflecting the two deuteron species, see Sec. III.1. Fitting the line shapes, we obtain anisotropy parameters and . For both deuteron species, the lower values of the specified line-width ranges are found for higher salt contents. At high temperatures, we observe a narrow line, indicative of fast () isotropic reorientation of the polymer segments. When we compare the results for the different compositions, it is evident that the line shape changes at higher temperatures for higher salt concentrations, indicating that the presence of salt slows down the segmental motion. The temperatures, at which , are about higher for 6:1 PPO-LiClO4 than for PPO, showing that the effects are strong, cf. Figs. 3 and 6.
Closer inspection of the 2H NMR line-shape changes at intermediate temperatures reveals interesting aspects of the polymer segmental motion in the PPO-LiClO4 mixtures. For PPO, there is a more or less continuous collapse of the rigid-lattice spectrum when the temperature is increased, see Fig. 3, consistent with previous results on glass-forming liquids.Lusceac ; Roessler Revisiting Figs. 4 and 6, we see some deviations from a continuous line narrowing for the low (30:1) and the high (6:1) salt concentrations. In narrow temperature ranges (), the 2H NMR line shape resembles a two-phase spectrum, see Sec. III.2, although the effect is not pronounced. In Fig. 5, it is obvious that the two-phase signature is much better resolved for the intermediate 15:1 salt concentration. Over a broad temperature range, the 2H NMR spectrum can be described as a weighed superposition of a narrow line and a rigid-lattice spectrum, indicating the coexistence of fast () and slow () polymer segmental motion. Hence, for all studied polymer electrolytes PPO-LiClO4, the 2H NMR line shape indicates that the segmental motion exhibits dynamical heterogeneities. However, the degree of the nonuniformity of the motion depends on the composition. While the dynamical heterogeneities are very prominent for intermediate salt concentrations, the effect is weaker for both low and high salt content.
For a more detailed analysis of the two-phase spectra for 15:1 PPO-LiClO4, we determine the weighting factor characterizing the relative contribution of the narrow line, cf. Eq. (3). In Fig. 7, we see that increases gradually from to when the temperature is increased. As was discussed in Sec. III.2, such behavior indicates the existence of a continuous rather than a discontinuous distribution of correlation times . Specifically, the latter scenario would manifest itself in a discontinuous variation of the weighting factor.
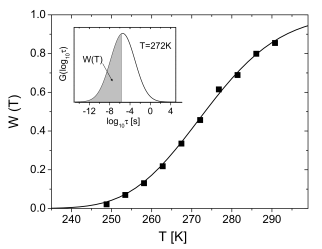
To estimate the width of the distribution for 15:1 PPO-LiClO4, we use input from our 2H NMR stimulated-echo study on this material.UP There, we find that the segmental motion exhibits nonexponential correlation functions, which can be described by a Kohlrausch function, . The small stretching parameter shows no systematic variation with temperature, consistent with a temperature independent width of the distribution . In the temperature range of the two-phase signature, the mean correlation time follows an Arrhenius law, , where and . Based on these results, we assume that the segmental motion exhibits a logarithmic Gaussian distribution that shifts with an activation energy , where the width parameter is temperature independent. For various values of , we then calculate according to Eq. (6). In doing so, we also vary the prefactor since, for broad logarithmic Gaussian distributions, the mean correlation time is longer than .PCCP Further, we use , which is the average of the values resulting from and , respectively.
In Fig. 7, we see that the experimental data is well reproduced for a width parameter and a prefactor . This width parameter corresponds to a full width at half maximum of more than five orders of magnitude and, hence, the polymer segmental motion in 15:1 PPO-LiClO4 is extremely heterogeneous, see inset of Fig. 7. For this intermediate salt concentration, the two-phase signature is observed in the temperature range . The lower and the higher end of this range correspond roughly to the temperatures where the line-shape changes for PPO and 6:1 PPO-LiClO4 are found, see Figs. 3 and 6, suggesting that the broad distribution of correlation times for the 15:1 composition results from large fluctuations in the local salt concentration. Although the present results rule out the presence of a discontinuous distribution for the 15:1 composition, it is possible that the broad continuous distribution is comprised of two distributions, which are associated with polymer dynamics in salt-rich and salt-depleted regions, provided these distributions overlap in large parts.
IV.3 7Li NMR line shape
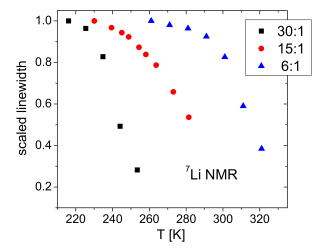
Next, we analyze 7Li NMR spectra to investigate the lithium ionic dynamics in PPO-LiClO4. For all studied polymer electrolytes, we find that the 7Li NMR rigid-lattice spectra at low temperatures are comprised of a narrow and a broad Gaussian associated with the central and the satellite transitions, respectively, see Sec. III.1. The full width at half maximum (FWHM) of the satellite component amounts to for the 6:1 composition and to about for the 15:1 and 30:1 compositions. Thus, the EFG tenors at the nuclear sites show a broader distribution in shape for the high salt concentration. For the FWHM of the central component, we find values of (30:1), (15:1) and (6:1). Hence, an increase of the lithium ionic concentration is accompanied by a line narrowing rather than a line broadening, suggesting that the heteronuclear dipole-dipole interaction dominates the width of the central line.
In Fig. 8, we show the temperature dependent FWHM of the central line for the 30:1, 15:1 and 6:1 compositions. For the sake of comparison, the data were scaled to the value for the respective rigid-lattice spectrum. Obviously, the line narrowing sets in at higher temperatures for high salt concentrations, implying a slow down of the lithium dynamics when the salt content is increased. For all compositions, rigid-lattice spectra are observed up to , indicating that there is no lithium ionic diffusion on the -time scale in a rigid polymer matrix. A strong temperature dependence of the 7Li line width is found at temperatures where 2H NMR line-shape changes are observed, see Figs. 4-6, suggesting a strong coupling of the lithium ionic and the polymer segmental motion. However, one has to consider that both ion and polymer dynamics render the 7Li NMR frequency time dependent and, hence, lead to a line narrowing so that the 7Li line width does not necessarily provide access to the lithium ionic diffusion. At , the 7Li NMR spectra start to split up into several lines, suggesting the existence of different lithium ionic environments. Therefore, we refrain from analysis of the line width at higher temperatures.
IV.4 2H NMR solid-echo spectra for various echo-delays


To study the mechanisms for the polymer segmental motion in the PPO-LiClO4 systems, we analyze the dependence of the 2H NMR solid-echo spectra on the echo delay . In our case, the superposition of two Pake spectra complicates such analysis. Therefore, we exploit that the spin-lattice relaxation of the M deuterons is faster than that of the B deuterons, see Fig. 2, and single out the contribution of the former species in partially relaxed 2H NMR spectra. In detail, after saturation of the longitudinal magnetization, we do not wait for its complete recovery, but start the solid-echo pulse sequence at times , when the longitudinal magnetization is dominated by the contribution of the M deuterons. In Figs. 9-11, we show partially relaxed 2H NMR solid-echo spectra of PPO-LiClO4 systems. Evidently, the narrow Pake spectrum of the M deuterons dominates the line shape, whereas contributions from the B deuterons are suppressed in large parts. Only for the 6:1 composition, suppression of the latter contribution is somewhat less effective because of a smaller difference of the spin-lattice relaxation times and , see Fig. 2.
The dependence of the partially relaxed 2H NMR spectra on the solid-echo delay is displayed for PPO at in Fig. 9 and for 15:1 PPO-LiClO4 at in Fig. 10. In both cases, a rigid-lattice spectrum is observed for , while the relative intensity in the center of the spectrum decreases when the echo delay is extended. These line-shape changes are a fingerprint of small angle rotational jumps, see Fig. 1.Pschorn ; Vogel_1 ; Vogel_2 ; Vogel_3 The specific effects can be explained when we recall two effects, see Sec. III.2. First, the angular resolution of the experiment depends on the value of so that the line shapes for short and long echo delays probe large-angle and small-angle displacements, respectively. Second, for isotropic rotational jumps about small angles , say, the jump correlation time is much shorter than the correlation time , see Eq. (7), since many elementary rotational jumps are required until the memory of the initial orientation is lost completely. Thus, for such type of motion one encounters the situation at appropriate temperatures. Then, the elementary jumps lead to line-shape changes for large , i.e., high angular resolution, while a rigid-lattice spectrum results for short , since angular displacements, which are sufficiently large to as to lead to effects for poor spatial resolution, are not achieved on the time scale of the experiment.
According to this argumentation, the dependence of the 2H NMR solid-echo spectra in Figs. 9 and 10 indicates that holds for the reorientation of the threefold methyl group axes in PPO and 15:1 PPO-LiClO4 at the studied temperatures, consistent with the results Figs. 3 and 5. This time scale separation is indicative of reorientation resulting from small angle jumps, see Eq. (7). For PPO, this reorientational mechanism is consistent with results from previous work on polymer melts.Spiess ; Tracht ; Pschorn Our findings for 15:1 PPO-LiClO4 together with that for 6:1 PPO-LiClO4, see Fig. 11, show that the isotropic reorientation of the polymer segments in polymer electrolytes also involves successive small-angle jumps. Hence, on a qualitative level, we find no evidence that addition of salt leads to a change of the mechanism for the reorientation of the polymer segments. In a future publication, we will show that analysis of 2H NMR two-time correlation functions confirms this conclusion on a quantitative level.
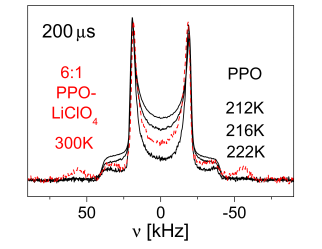
Figure 11 displays temperature dependent 2H NMR spectra of PPO for a large solid-echo delay . We see that the intensity in the center of the spectrum is diminished for , cf. also Fig. 9, while this effect becomes less prominent when the temperature is decreased, until the line shape is independent of for . Since the line shape for is sensitive to small-angle motion, these results indicate that cooling slows down the elementary rotational jumps so that, near , any polymer segmental motion is frozen in on the time scale. We further emphasize that the observed temperature dependence of the spectra for a large echo delay together with a independent line shape at low temperatures rule out that the observed effects are due to experimental imperfections, e.g., due to an inaccurate time origin for the Fourier transformation of the time signal. Moreover, these observations exclude spin diffusion, i.e., a transfer of magnetization as a consequence of flip-flop processes of the spins, as possible origin of the dependent line shape. Since spin diffusion is not directly related to molecular dynamics, it shows, if at all, a weak temperature dependence and, hence, it cannot account for the pronounced effects in Fig. 11.Vogel_2
Many molecular and polymeric glass formers show a secondary relaxation ( process) that is intrinsic to the glassy state.JG In the literature,Vogel_2 ; Vogel_3 ; Vogel_4 it was demonstrated that, at , the spatially restricted motion associated with the process leads to a dependence of the 2H NMR solid-echo spectrum, which resembles that resulting from the elementary steps of the process at , see Figs. 9-11. In previous NMR work, it was suggested that a process exists in polymer electrolytes PPO-LiClO4, too.Chung_2 Here, the 2H NMR solid-echo spectra give no evidence that PPO-LiClO4 mixtures electrolytes exhibit a process. In particular, we determined that the 2H NMR spectra of 15:1 PPO-LiClO4 are independent of the solid-echo delay in the temperature range . Consistently, no process was oberved in DS on polymer electrolytes PPO-LiClO4.Furukawa
V Conclusion and Summary
Previous work on the polymer segmental motion in polymer electrolytes PPO-LiClO4 reported nonexponential two-time correlation functions and broad dielectric loss spectra.Furukawa ; Carlsson_2 Two limiting scenarios can explain such nonexponential relaxation. In the heterogeneous limit, all particles obey exponential correlation functions, however, a distribution of correlation times exists. In the homogeneous limit, all particles obey the same correlation function, which is, however, intrinsically non-exponential. For disordered materials, heterogeneous and homogeneous contributions may coexist. Measurements of two-time correlation functions and, hence, the previous approaches do not allow one to discriminate between both scenarios and to quantify the relevance of homogeneous and heterogeneous contributions.13 Here, we demonstrated that 2H NMR spin-lattice relaxation and line shape consistently indicate that pronounced dynamical heterogeneities govern the polymer segmental motion in polymer electrolytes PPO-LiClO4. Specifically, at appropriate temperatures, the existence of a distribution of correlation times manifests itself in a nonexponential 2H spin-lattice relaxation and in a 2H NMR two-phase line shape, i.e., the spectrum is comprised of a weighed superposition of a narrow line and a rigid-lattice spectrum. While the former spectral component is due to the fast polymer segments of the rate distribution, the latter is due to the slow segments. Hence, in both the 2H NMR experiments, the existence of dynamical heterogeneities is demonstrated without invoking any model assumptions. However, the present data do not provide information whether or not homogeneous dynamics yields an additional contribution to the nonexponential relaxation. In future work, we will show that quantification of homogeneous and heterogeneous contributions is possible based on analysis of 2H NMR three-time correlation functions, as was demonstrated for neat molecular and polymeric glass formers.Roessler ; 3T
Analysis of 2H NMR spin-lattice relaxation and line shape gave further evidence for the existence of a continuous rather than a discontinuous distribution of correlation times for all studied polymer electrolytes PPO-LiClO4. Specifically, such shape of the rate distribution is consistent with a 2H spin-lattice relaxation following a stretched exponential, as was observed in the experiment. Moreover, in an analysis of the two-phase spectra, a continuous distribution was indicated by a continuous variation of the weighting factor , quantifying the relative contribution of the narrow line. However, the width of the distribution of correlation times strongly depends on the salt concentration. While the width is moderate for both low and high salt concentrations, an extremely broad distribution exists for the intermediate salt content 15:1 PPO-LiClO4, leading to the observation of two-phase spectra over a broad temperature range. For 15:1 PPO-LiClO4, we used information about the temperature dependent shift of from our concomitant 2H NMR stimulated-echo studyUP to estimate the width of this distribution from the temperature behavior of the weighting factor . An estimate of more than five orders of magnitude for the full width at half maximum shows that this polymer electrolyte exhibits very pronounced dynamical heterogeneities.
Since it is established that presence of salt slows down the polymer dynamics, it is reasonable to assume that the shape of the distribution of correlation times for the polymer segmental motion reflects features of the salt distribution in polymer electrolytes PPO-LiClO4. Thus, the width of implies strong fluctuations in the local salt concentration for the intermediate 15:1 composition, while the structural diversity is reduced for both high and low salt content. In the literature, the possibility of liquid-liquid phase separation into salt-rich and salt-depleted regions was controversially discussed for intermediate salt concentrations.Vachon_1 ; Vachon_2 ; Furukawa ; Bergman ; Carlsson_1 ; Carlsson_2 ; Carlsson_3 ; Torell Given the rate of the polymer segmental motion is related to the local salt concentration, the existence of well-defined microphases should manifest itself in the existence of a bimodal distribution . Our 2H NMR results for 15:1 PPO-LiClO4 indicate the existence of a continuous so that they are at variance with a bimodal distribution of correlation times and, hence, of local salt concentrations unless the contributions from salt-rich and salt-depleted regions overlap in large parts. On the other hand, they are in harmony with short ranged fluctuations of the local salt concentration. In this case, one expects a large variety of local structural motifs leading to a broad continuous . For example, our 2H NMR findings for the intermediate salt content are consistent with a RMC model of 16:1 PPO-LiClO4, which features salt-rich and salt-depleted regions on a short length scale of about ,Carlsson_3 corresponding to about two monomeric units. When we consider the cooperativity of molecular dynamics near the glass transition, the chain connectivity and the effect that salt migration renders the spatial salt distribution time depend on the time scale of the polymer segmental motion, it is highly likely that a continuous distribution of correlation times results from this RMC model, consistent with our 2H NMR results.
Acknowledgements.
We are grateful to J. Jacobsson for providing us with deuterated PPO. Further, we thank H. Eckert for allowing us to use his NMR laboratory and S. Faske for helping us to prepare the samples. Finally, funding of the Deutsche Forschungsgemeinschaft (DFG) through the Sonderforschungsbereich 458 is gratefully acknowledged.References
- (1) M. B. Armand, J. M. Chabagno and M. J. Duclot, in Fast Ion Transport in Solids, eds. P. Vasishta, J. N. Mundy and G. K Shenoy, North-Holland, Amsterdam (1979)
- (2) M. A. Ratner, in Polymer Electrolyte Reviews 1, eds. J. R. MacCallum and C. A. Vincent, Elsevier, London (1987)
- (3) C. A. Vincent, Electrochim. Acta 40, 2035 (1995)
- (4) N. A. Stolwijk and S. Obeidi, Phys. Rev. Lett. 93, 125901 (2004)
- (5) A. Ferry, P. Jacobsson and L. M. Torell, Electrochim. Acta 40, 2369 (1995)
- (6) R. Frech, S. York, H. Allcock, C. Kellam, Macromolecules 37, 8699 (2004)
- (7) M. G. McLin and C. A. Angell, J. Phys. Chem. 95, 9464 (1991)
- (8) T. Furukawa, Y. Mukasa, T. Suzuki and K. Kano, J. Polym. Sci., Part B 40, 613 (2002)
- (9) J. Moacanin and E. F. Cuddihy, J. Polym. Sci., Part C 14, 313 (1966)
- (10) C. Vachon, M. Vasco, M. Perrier, J. Prud’homme, Macromolecules 26, 4023 (1993)
- (11) C. Vachon, C. Labreche, A. Vallee, S. Besner, M. Dumont, J. Prud’homme, Macromolecules 28, 5585 (1995)
- (12) R. Bergman, A. Brodin, D. Engberg, Q. Lu, C. A. Angell, L. M. Torell, Electrochim. Acta 40, 2049 (1995)
- (13) P. Carlsson, B. Mattsson, J. Swenson, L. M. Torell, M. Käll, L. Börjesson, R. L. McGreevy, K. Mortensen and B. Gabrys, Solid State Ionics 113-115, 139 (1998)
- (14) P. Carlsson, R. Zorn, D. Andersson, B. Farago, W. S. Howells and L. Börjesson, J. Chem. Phys. 114, 9645 (2001)
- (15) P. Carlsson, D. Andersson, J. Swenson, R. L. McGreevy, W. S. Howells, L. Börjesson, J. Chem. Phys. 121, 12026 (2004)
- (16) L. M. Torell and S. Schantz, J. Non-Cryst. Solids 131-133, 981 (1991)
- (17) C. Roux, W. Gorecki, J.-Y. Sanchez, M. Jeannin and E. Belorizky, J. Phys.: Condens. Matter 8, 7005 (1996)
- (18) S. Arumugam, J. Shi, D. P. Tunstall and C. A. Vincent, J. Phys.: Condens. Matter 5, 153 (1993)
- (19) I. M. Ward, N. Boden, J. Cruickshank and S. A. Leng, Electrochim. Acta 40, 2071 (1995)
- (20) S. H. Chung, K. R. Jeffrey and J. R. Stevens, J. Chem. Phys. 94, 1803 (1991)
- (21) S. H. Chung, K. R. Jeffrey and J. R. Stevens, J. Chem. Phys. 108, 3360 (1998)
- (22) K. J. Adamic, S. G. Greenbaum, K. M. Abraham, M. Alamgir, M. C. Wintersgill and J. J. Fontanella, Chem. Mater. 3, 534 (1991)
- (23) J. Fan, R. F. Marzke, E. Sanchez and C. A. Angell, J. Non-Cryst. Solids 172-174, 1178 (1994)
- (24) J. P. Donoso, T. J. Bonagamba, P. L. Frare, N. C. Mello, C. J. Magon, H. Panepucci, Electrochim. Acta 40, 2361 (1995)
- (25) M. Forsyth, D. R. MacFarlane, P. Meakin, M. E. Smith and T. J. Bastow, Electrochim. Acta 40, 2343 (1995)
- (26) K. Schmidt-Rohr and H. W. Spiess, Multidimensional Solid-State NMR and Polymers, Academic Press, London (1994)
- (27) T. Takahashi, H. Kawashima, H. Sugisawa and T. Baba, Sol. St. Nucl. Magn. Reson. 15, 119 (1999)
- (28) O. Kanert and. M. Mehring, in NMR Basic Principles and Progress, Vol. 3, eds. P. Diehl, E. Fluck and R. Kosfeld, Springer, Berlin (1971)
- (29) E. Rössler, M. Taupitz, K. Börner, M. Schulz, H.-M. Vieth, J. Chem. Phys. 92, 5847 (1990)
- (30) R. Böhmer, G. Diezemann, G. Hinze and E. Rössler, Prog. Nucl. Magn. Reson. Spectrosc. 39, 191 (2001)
- (31) H. W. Spiess and H. Sillescu, J. Magn. Reson. 42, 381 (1981)
- (32) J. H. Ok, R. R. Vold, R. L. Vold, M. C. Etter J. Phys. Chem. 93, 7618 (1989)
- (33) U. Pschorn, E. Rössler, H. Sillescu, S. Kaufmann, D. Schaefer and H . W. Spiess, Macromolecules 24, 398 (1991)
- (34) J. Zhao, Y. H. Chin, Y. Liu, A. A. Jones, P. T. Inglefield, R. P. Kambour, D. M. White, Macromolecules 28, 3881 (1995)
- (35) M. Vogel and E. Rössler, J. Magn. Reson. 147, 43 (2000)
- (36) M. Vogel and E. Rössler, J. Chem. Phys. 114, 5802 (2001)
- (37) M. Vogel, P. Medick and E. Rössler, Ann. Rep. NMR Spectrosc. 56, 231 (2005)
- (38) M. Vogel, C. Tschirwitz, G. Schneider, C. Koplin, P. Medick and E. Rössler, J. Non-Cryst. Solids 307-310, 326 (2002)
- (39) E. R. deAzevedo, T. J. Bonagamba and D. Reichert, Prog. Nucl. Magn. Reson. Spectrosc. 47, 137 (2005)
- (40) U. Tracht, A. Heuer and H. W. Spiess, J. Chem. Phys. 111, 3720 (1999)
- (41) J. E. Anderson, Faraday Symp. Chem. Soc. 6, 82 (1972)
- (42) N. Bloembergen, E. M. Purcell and R. V. Pound, Phys. Rev. 73, 679 (1948)
- (43) G. Allen and J. S. Higgins, Macromolecules 10, 1006 (1977)
- (44) D. Andersson, P. Carlsson, D. Engberg, L. M. Torell, L. Börjesson, R. L. McGreevy and W. S. Howells, Physica B, 126 (1999)
- (45) W. Schnauss, F. Fujara, K. Hartmann, H. Sillescu, Chem. Phys. Lett. 166, 381 (1990)
- (46) J. Leisen, K. Schmidt-Rohr and H. W. Spiess, J. Non-Cryst. Solids 172-174, 737 (1994)
- (47) S. A. Lusceac, C. Koplin, P. Medick, M. Vogel, N. Brodie-Linder, C. LeQuellec, C. Alba-Simionesco and E. Rössler, J. Phys. Chem. B 108, 43 (2004)
- (48) R. Böhmer, R. V. Chamberlin, G. Diezemann, B. Geil, A. Heuer, G. Hinze, S. C. Kuebler, R. Richert, B. Schiener, H. Sillescu, H. W. Spiess, U. Tracht and M. Wilhelm, J. Non-Cryst. Solids 235, 1 (1998)
- (49) M. Vogel and T. Thorbrügge, unpublished results
- (50) M. Vogel, C. Brinkmann, H. Eckert and A. Heuer, Phys. Chem. Chem. Phys. 4, 3237 (2002)
- (51) G.P. Johari and M. Goldstein, J. Chem. Phys. 53, 2372 (1970)
- (52) A. Heuer, U. Tracht, S. C. Kuebler and H. W. Spiess, J. Molec. Structure 479, 251 (1999)