Unidirectional Diagonal Order and 3D Stacking of Charge Stripes in Orthorhombic and .
Abstract
The interplay between crystal symmetry and charge stripe order in and has been studied by means of single crystal x-ray diffraction. In contrast to tetragonal , these crystals are orthorhombic. The corresponding distortion of the planes is found to dictate the direction of the charge stripes, similar to the case of diagonal spin stripes in the insulating phase of . In particular, diagonal stripes seem to always run along the short -axis, which is the direction of the octahedral tilt axis. In contrast, no influence of the crystal symmetry on the charge stripe ordering temperature itself was observed, with 240 K for La, Pr, and Nd. The coupling between lattice and stripe degrees of freedom allows one to produce macroscopic samples with unidirectional stripe order. In samples with stoichiometric oxygen content and a hole concentration of exactly 1/3, charge stripes exhibit a staggered stacking order with a period of three layers, previously only observed with electron microscopy in domains of mesoscopic dimensions. Remarkably, this stacking order starts to melt about 40 K below . The melting process can be described by mixing the ground state, which has a 3-layer stacking period, with an increasing volume fraction with a 2-layer stacking period.
pacs:
74.72.Dn, 74.25.Ha, 61.12.-qI Introduction
In recent years the nickelate has been studied intensively because of its similarity to the high temperature superconductor . Tranquada98e ; Chen93aN ; Kajimoto03aN ; Ishizaka03aN ; Boothroyd03aN ; Homes03aN Of particular interest is that, in both materials, incommensurable spin correlations and lattice modulations are observed which are consistent with the concept of charge and spin stripes. Tranquada95a Undoped, both systems are insulating antiferromagnets (AF). Doping with Sr () or O () introduces hole-like charge carriers, at a concentration , into the and planes, which leads to a suppression of the commensurate AF order. However, with increasing hole concentration both systems show a strong tendency towards a frustrated electronic phase separation. Emery93 For certain compositions the holes segregate into one-dimensional charge stripes, separating intermediate spin stripes with low hole concentration. Tranquada95a In , stripe order results in an insulating ground state. Cheong94a Stripes run diagonally to the square lattice and are most stable for , with the charges ordering at 240 K and the spins at 190 K. Cheong94a ; Tranquada95a ; Yoshizawa00aN ; Kajimoto03aN Stripes can be identified by various techniques. Chen93aN ; Tranquada95a ; Vigliante97a ; Yoshinari99aN ; Lee02aN ; Li03aN ; Blumberg98aN ; Abbamonte05a ; Langeheine05aN Here we focus on the characterization of the charge stripes with x-ray diffraction by probing the lattice modulation associated with the spatial modulation of the charge density. Vigliante97a
We are particularly interested in the response of the charge stripe order to changes of the crystal lattice symmetry. For certain cuprates it was shown that lattice distortions can pin stripes or influence their orientation with respect to the lattice. The most prominent example is observed in and Nd or Eu-doped around a hole doping of , where stripes are pinned parallel to the square lattice as a result of a structural transition from orthorhombic to tetragonal symmetry. Fujita04a ; Tranquada95a ; Niemoeller99a ; Klauss00a In samples with a fully developed static stripe order, superconductivity is strongly suppressed. Wagener97a ; Tranquada97a ; Klauss00a ; Fujita04a Another example is observed in orthorhombic below the metal insulator (MI) transition (), i.e., in the short-range ordered spin-stripe phase. The ground state is insulating, with spin stripes running diagonally to the square lattice. Wakimoto99a ; Fujita02a In this case the coupling to the orthorhombic distortions is evident from the finding that the spin stripes always order parallel to the orthorhombic -axis. Wakimoto00a Note that, below the MI transition, no diffraction evidence for charge stripes has been found. Therefore, one has to consider the possibility that here the incommensurate magnetism might emerge from ground states different from stripe order, such as helical spin structures or disorder-induced spin topologies. Shraiman92a ; Gooding97 ; Berciu04a ; Sushkov04a ; Luescher05a ; Lindgard05a
To gain insight into the mechanisms of the charge-lattice coupling in the cuprates, we have carried out a study of the diagonal stripes in the isostructural nickelates. The particular question which motivated this work is: do lattice distortions in the nickelates, which are very similar to those in the cuprates, have an impact on the stripe orientation? In this context, we consider the crystal structure of with Ln=La, Pr, and Nd.
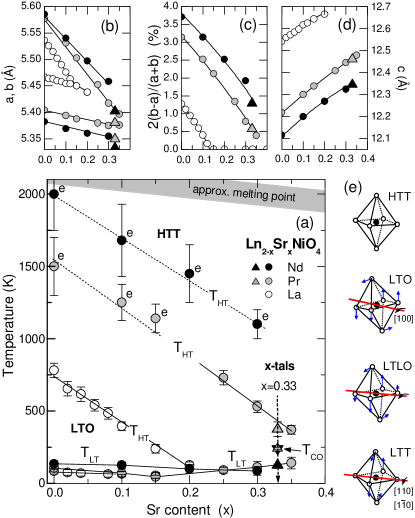
As summarized in Fig. 1(a), undoped (open symbols) undergoes two structural transitions: From the high-temperature-tetragonal (HTT) phase to the low-temperature-orthorhombic (LTO) phase at K, and from the LTO phase to the low-temperature less-orthorhombic (LTLO) phase at K. (See Sec. II for definition of phases.) With increasing Sr content, both transitions decrease in temperature and, above a critical Sr content of , the HTT phase is stable for all temperatures. Rodriguez88aN ; Medarde97aN ; Sachan95aN ; FriedtDipl ; Huecker04a Hence, in , stripe order takes place in a tetragonal lattice, which results in an equal population of domains with stripes running along the orthorhombic [100] and [010] directions. Boothroyd03aN ; Woo05aN Obviously, such stripe twinning complicates any anisotropy study of stripes, such as electronic transport parallel and perpendicular to the charge stripes or magnetic excitations parallel and perpendicular to the spin stripes.
The substitution of trivalent La with the smaller, isovalent Pr or Nd causes a significant increase of the chemical pressure on the planes. Huecker04a ; Ishizaka03aN As a result, the HTT/LTO phase boundary shifts to much higher temperatures and Sr concentrations so that ,even for , the transition takes place above room temperature (see Fig. 1). Therefore, the Pr and the Nd-based systems allow us to investigate the formation of stripes under the influence of orthorhombic strain. The effect of the Pr and Nd substitution on both the high temperature and the low temperature structural transitions has been characterized by several groups, although in some studies samples with non-stoichiometric oxygen content were investigated. Martinez91aN ; Buttrey90aN ; Medarde94aN In Ref. Ishizaka03aN, , the charge order in with was studied with the focus on the evolution from stripe to checkerboard order.
In the present paper we focus on the coupling between charge stripes and lattice distortions in the LTO phase of and . In particular, we find that stripes always order parallel to the short -axis of the LTO unit cell. This will allow one to produce macroscopic samples with unidirectional stripe order by detwinning the crystals under unidirectional strain. The identified stripe orientation is the same as for the short range spin stripe order in lightly doped with LTO structure, as will be discussed. The critical temperature, , turns out to be the same as for , i.e., no significant dependence on the orthorhombic strain is observed. Furthermore, we find a strong dependence of the stacking order of stripes along the -axis on the oxygen and hole concentration. Notably, crystals containing excess oxygen exhibit strong stacking disorder. Crystals with stoichiometric oxygen content show a tendency towards a 3-layer stacking period, resulting in a unit cell enlarged by a factor of 1.5 along the -direction. However, only for a hole concentration of exactly 1/3 does this 3-layer period lead to a well defined superstructure.
II Crystal structure
, with , Pr, or Nd, crystallizes in the structure and at high temperature is expected to assume tetragonal symmetry, space group , regardless of the Sr and O contents. Tamura96aN ; Sullivan91aN For convenience, it is common to index all phases on the basis of the orthorhombic supercell, in which case the space group of the HTT phase is . Huecker04a As a function of temperature and doping, a total of four structural phases are observed, which can be described by different buckling patterns of the octahedral network. Axe89 ; Crawford91 ; Huecker04a The HTT phase is the only phase with untilted octahedra, i.e., the planes are flat [cf. Fig. 1(e)]. In the LTO phase, space group , octahedra rotate about the -axis, which runs diagonally to the square lattice. In the LTT phase, space group , the octahedral tilt axis is parallel to the Ni-O bonds, which means that it has rotated by with respect to the LTO phase. Moreover, its direction alternates between [110] and [1-10] from plane to plane. The LTLO phase, space group , is an intermediate between LTO and LTT with .
III Experiment
Two single crystals, with compositions and and sizes of 4.5 mm in diameter and several centimeters in length, were grown at the Laboratoire de Physico-Chimie des Solides at Orsay by the travelling-solvent floating-zone method. In both cases, crystal growth was performed in 1 atm of air. The polycrystals used to map the phase diagram in Fig. 1 were synthesized by a standard solid-state reaction. BakeheDiss ; FriedtDipl To remove non-stoichiometric oxygen interstitials (excess oxygen), the polycrystals were annealed under reducing conditions that depended on the Sr content. Powder x-ray diffraction patterns of the polycrystals for temperatures up to 800 K were taken with a standard laboratory diffractometer. BakeheDiss ; FriedtDipl
Single crystal x-ray diffraction experiments were performed at beamline X22C of the National Synchrotron Light Source (NSLS) at Brookhaven and at beamline BW5 of the Hamburg Synchrotron Laboratory (HASYLAB). At BW5, the photon energy was set to 100 keV. Bouchard98 At this energy, a sample several millimeters thick can be studied in transmission geometry, allowing one to probe its bulk. In contrast, at Brookhaven 8.1 keV photons, which have a penetration depth on the order of m, were used, so that, here, samples were studied in reflection geometry. The crystal, with a polished and twinned [100]/[010] surface, at first has been studied as-grown-in-air at X22C and BW5. Subsequently, it was studied again at X22C, after removing the excess oxygen () by Ar-annealing at 900∘C for 24 h. The crystal was studied at BW5 after being subjected to an identical Ar-annealing. For the hard x-ray diffraction experiments no polished surface is required.
The specific heat of the Ar-annealed crystal was measured with a Physical Property Measurement System from Quantum Design. The -plane resistivity of a bar-shaped, Ar-annealed crystal was measured using the four-probe technique.
IV Results
IV.1 Phase diagram
To put the results for the two single crystals () into context with , we refer back to Fig. 1(a), the Sr-doping phase diagram for Ln=La, Pr, and Nd. BakeheDiss ; FriedtDipl The shift of the HTT/LTO phase boundary to higher temperatures and with decreasing rare earth ionic radius is obvious (). In those cases where K, the transition temperature was determined by linearly extrapolating the orthorhombic strain to higher temperatures. The low-temperature structural transition was observed in all orthorhombic samples. However, it changes qualitatively as a function of the Sr content. At low , the transition is of the discontinuous LTO/LTLO type whereas, at higher , it becomes continuous. No reliable information was obtained for the crossover concentrations, or whether these are different for the La, Pr, and Nd-based systems. However, with approaching , the transition becomes very broad and the orthorhombicity barely decreases below . For Nd-based samples, similar results were reported in Ref. Medarde94aN, . Note that while in the Pr-based polycrystal with a weak LTO/LTLO is still visible, it is not observed in the Pr-based single crystal with (see next section). In Figs. 1(b) and (d) we show the Sr-doping dependence of the lattice parameters, and in Fig. 1(c) the orthorhombic strain at room temperature.
Corresponding data for the single crystals (triangular symbols) are in fair agreement with the polycrystal data (cf. Fig. 1). The largest deviations concern the absolute values of the lattice parameters and . It seems that the single crystal data are systematically too low by about 0.5%. Differences of this magnitude are within the error of our single crystal diffraction experiment, where , , and were determined from basically one reflection each. The temperatures of the HTT/LTO transition are 370 K (315 K) for the surface (bulk) in (details in Sec. IV.3), and an estimated 1100 K in . In addition, the Nd-based crystal undergoes the LTO/LTLO transition at 125 K.
The approximate melting temperatures in Fig. 1(a) are based on measurements of the surface temperature of the melt using an optical pyrometer. These results were obtained in earlier crystal growth experiments on with , 0.25, and 1.5 in which the skull melting method was applied. We mention that our results in Fig. 1 are consistent with available data by other groups, in particular when taking the effect of oxygen doping into account. Martinez91aN ; Medarde94aN ; Sullivan91aN ; Ishizaka03aN ; Huecker04a However, Fig. 1 may be the most coherent account of with stoichiometric oxygen content for and Ln=La, Pr, and Nd.
IV.2 Structural transitions in single crystals
In this and the next section, we focus on the temperature dependence of the crystal symmetry and its influence on charge stripe order. As mentioned earlier, the Pr and Nd-based compounds undergo the HTT/LTO transition above room temperature. It is well known that below this transition, crystals tend to form twin boundaries in the -plane. In particular, in space group , up to four twin domains can form, resulting in a corresponding manifold of fundamental reflections. Wakimoto00a In both crystals studied, only two out of these four domains are present, which we call domains and .
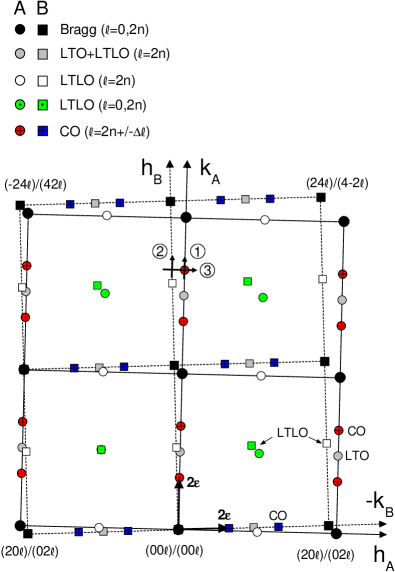
Figure 2 shows a projection of the -zone along the -direction in the case of the LTLO phase with charge stripe order, as we find it in the crystal at low temperatures. The legend shows the -conditions for the different types of reflections. The fundamental reflections of the domains and are indicated by black symbols. The angle between the two domains amounts to 0.7∘ at 200 K (exaggerated in the figure). Superstructure reflections in the LTO phase, such as (032), are indicated by grey symbols. In the LTLO phase, additional reflections appear, such as (110) and (302), which are indicated by symbols with dot (green) and open symbols, respectively. Furthermore, the angle between the domains is smaller than in the LTO phase. In the LTT phase, the reflections of the two domains are merged into single peaks. In our crystal, the LTT phase is not observed down to K.
IV.3 Unidirectional Stripes in the LTO phase
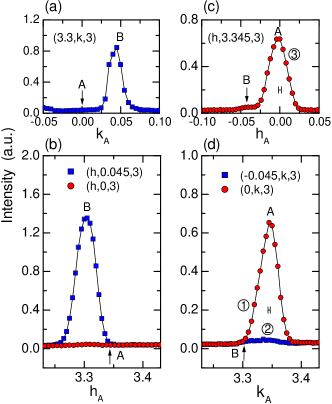
Now let us turn to the weak reflections which appear below K due to the charge stripe order, indicated in Fig. 2 by symbols with cross for domain (red) and domain (blue). In both crystals, as well as in each of their two domains, these peaks were always found along . This conclusion is based on scans through possible charge-peak positions in both domains, similar to those presented in Fig. 3. NSNOpeaks Note that all scans where performed in the orientation matrix of domain , so that the positions of the peaks of domain appear slightly shifted. The results indicate a lattice modulation along the -axis, which means that in the LTO phase stripes are parallel to the short -axis. Obviously, the orthorhombic strain in the LTO phase dictates the direction of the stripes. No change of the stripe pattern was observed in the LTLO phase of , which is not surprising because in the LTLO phase one still has .
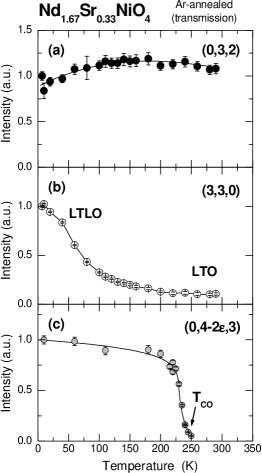
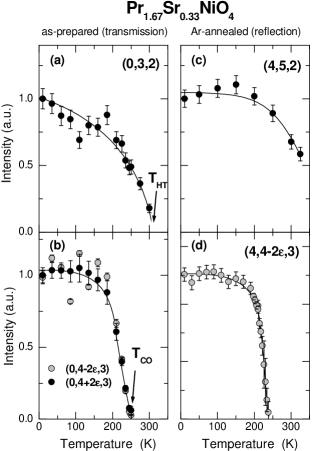
For the crystal, the temperature dependence of various superstructure peaks is shown in Fig. 4. Below room temperature, the (032) peak intensity first increases slightly, but starts to decrease below 125 K. The decrease of the (032) peak coincides with a strong increase of the (330) peak, indicating the LTO/LTLO transition. LTLOpeak Above 125 K, the (330) peak is very weak and broad but remains visible up to room temperature. newXTAL The decrease of the (032) peak in the LTLO phase is due to a shift of intensity to the (302) peak (white symbols in Fig. 2). Below the charge stripe transition at K, the intensity of the peak first increases steeply, but tends to saturate below 200 K. There is no obvious change of the intensity of this peak due to the LTO/LTLO transition.
In Fig. 5 we show corresponding data for . As mentioned before, no LTO/LTLO transition was observed in this crystal. The figures on the left side show 100 keV x-ray data collected in transmission geometry on the crystal in the as-prepared-in-air state (). The (032) reflection strongly decreases with increasing temperature, indicating a LTO/HTT transition temperature of 315 K. Charge stripe order sets in at the same temperature as in , although the transition is somewhat broader [Fig. 5(b)]. The latter effect is due to the non-stoichiometric oxygen and its inhomogeneous distribution in the crystal. The influence of excess oxygen will be discussed in more detail in Secs. IV.4 and IV.5.
The figures on the right side of Fig. 5 show data collected at 8.1 keV in a reflection geometry after Ar-annealing (). The charge stripe transition now is much sharper, though the transition temperature remains the same. On the other hand, the LTO/HTT transition is observed at a significantly higher temperature. [Note that in this experiment we have studied the equivalent (452) reflection.] In addition to the data in Fig. 5, we have collected another set of data (not shown) in reflection geometry on the as-prepared crystal. Also in this case the LTO/HTT transition occurs at a much higher temperature (370 K) than in transmission geometry. Therefore, we think that not only depends on the hole concentration [cf. Fig. 1(a)], but generally seems to be somewhat higher in the surface layer than in the bulk.
IV.4 In-plane Charge Stripe Distance
Excess oxygen increases the total hole concentration in the planes. One way to measure is to measure the in-plane distance between the charge stripes via the incommensurability (see Fig. 2). The property was studied intensively in recent years and it is well known that it is not precisely linear. Yoshizawa00aN However, around , one finds that is approximately satisfied. Hence, deviations from can be probed quite accurately. A precise way to determine is to take one fourth the distance between the simultaneously measured reflections at and .
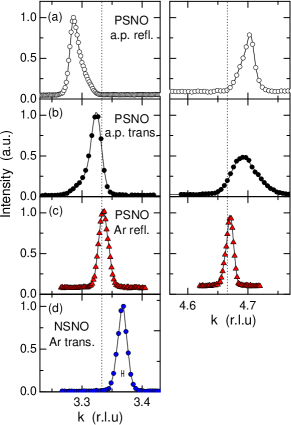
In Fig. 6 we show representative scans for as-prepared-in-air and Ar-annealed crystals taken at different photon energies, as indicated in the figure. The larger the distance between the peaks, the larger . The dashed lines are for . By comparing the 8.1 keV and 100 keV data in Figs. 6(a) and (b), we find that in the as-prepared crystal the oxygen content in the surface is larger than in the bulk. Only after the Ar-annealing is the hole concentration in this crystal very close to the nominal value , suggesting that [Fig. 6(c)]. In the Ar-annealed crystal we observe , which we attribute to a Sr content slightly below , assuming that [Fig. 6(d)]. Note that for we have measured the peak at , only. Another feature is that, in the as-prepared crystal, the peaks are asymmetric and obviously broader in than in both Ar-annealed crystals, indicating that excess oxygen leads to a enhanced distribution of .
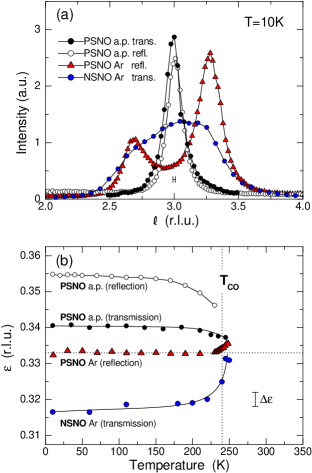
In Fig. 7(b) we show the corresponding temperature dependencies of . The symbols are the same as in Fig. 6. At low temperatures one can clearly see the deviations from for as-prepared and Ar-annealed . It is believed that the low temperature values of represent the true hole concentration . However, close to , in all measurements gravitates towards a value of . This lock-in effect is well known and indicates that the in-plane stripe distance prefers to be three Ni sites (1.5), i.e., commensurate with the lattice. Tranquada96aN ; Vigliante97a ; Wochner98aN ; Kajimoto01aN ; Ishizaka04aN Note that in the case of the Ar-annealed crystal, for all temperatures, which indicates that this is in fact the only experiment where we were truly looking at a sample with .
IV.5 Three Dimensional Charge Stripe Order
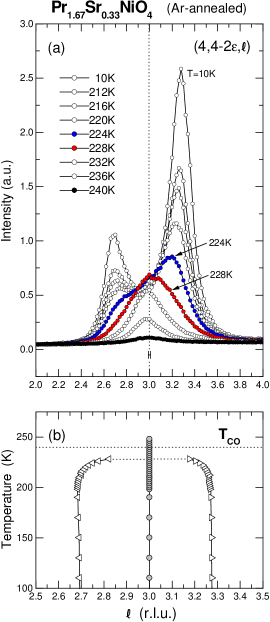
The most dramatic effect the Ar-annealing had on the crystal was a drastic change of the correlations between charge stripes along the -axis. Corresponding -scans through the charge stripe peak at K are shown in Fig. 7(a). In the as-prepared crystal, a single narrow peak appears at , which is in accordance with results by other groups on . Vigliante97a ; Lee01aN ; Du00aN After the Ar-annealing, however, the peak is split with two pronounced maxima appearing at and . Since these values are close to and , the split most likely indicates that a long range stacking order of stripes has developed along the -axis with a period of , corresponding to a period of three layers. Figure 8 shows the locations of the charge stripe peaks in the -zone as observed for the Ar-annealed (left) and the as-prepared crystal (right). The corresponding ordering wave vectors are and as well as , respectively. Details will be discussed in Sec. V. In the crystal, a similarly clear splitting in was not observed, but, as one can see in Fig. 7(a), the scan is extremely broad and shows two shoulders at comparable -positions, plus a central maximum, indicating the presence of incommensurate peaks obscured by disorder.
In Fig. 9(a) we show the temperature dependence of -scans through for . To extract the peak positions we have fit the data with three lines, keeping the position of the central line fixed at . As one can see in Fig. 9(b), the splitting in is about constant up to 200 K and then starts to decrease. Eventually, for K the three peaks have merged into a single reflection at , indicating the loss, or a qualitative change, of the long-range correlations along the -axis.
In Fig. 9 peaks appear at slightly asymmetric positions with respect to . We have performed additional scans through charge and nearby Bragg peaks, which confirm that the peak positions are symmetric. The deviations in Fig. 9 are due to a small misalignment of the crystal, as well as the temperature dependence of the lattice parameter . In our data analysis in Sec. V, this deviation is compensated by a small offset in .
V Discussion
V.1 Modelling the stacking of stripes
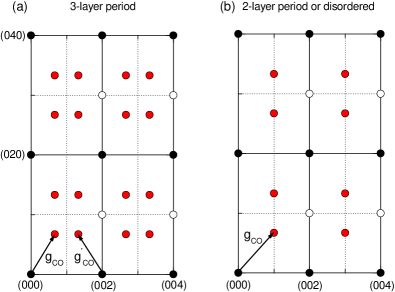
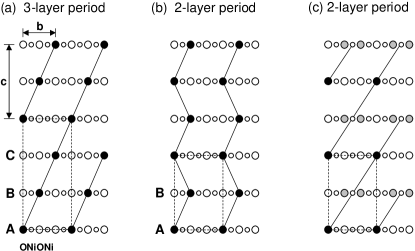
Previous studies of have shown that the stacking of stripes along the -axis is mainly controlled by two mechanisms Tranquada96aN ; Wochner98aN : the minimization of the Coulomb repulsion between the charge stripes, and the interaction of the charge stripes with the underlying lattice. The Coulomb interaction favors a body centered-type stacking to maximize the distance between nearest neighbor stripes in adjacent planes. On the other hand, the interaction with the lattice favors shifts by increments of half of the in-plane lattice parameter. This means that nearest-neighbor stripes do not stack on top of each other. For a hole content of and 0.5, a body-centered stacking also satisfies commensurability with the lattice. This is not the case for . Here, a body-centered stacking is achieved only in the case of an alternation of layers with site-centered and bond-centered stripes, similar to the stacking shown Fig. 10(c). However, our results for Ar-annealed strongly suggest a stripe ground state with a 3-layer period, consistent with a stacking similar to Fig. 10(a). Stripes successively shift by increments of , i.e., there are three different types of planes with stripes at in-plane positions 0, and . A stacking pattern such as that in Fig. 10(a) but with all stripes centered on Ni-sites is possible, too.
This problem can be projected onto that of the stacking of close-packed layers of atoms, where layers can be shifted by 1/3 of the primitive translation, again resulting in three types of planes: A, B and C. Hendricks42a The two most simple arrangements of these planes are the hexagonal packing …ABAB…, BCBC and the cubic packing …ABCABC…, corresponding to stripe stacking patterns with 2-layer and 3-layer periods, respectively [cf. Fig. 10(a,b)]. Energetic differences between these two stacking types appear only if second-nearest-neighbor interactions are included.
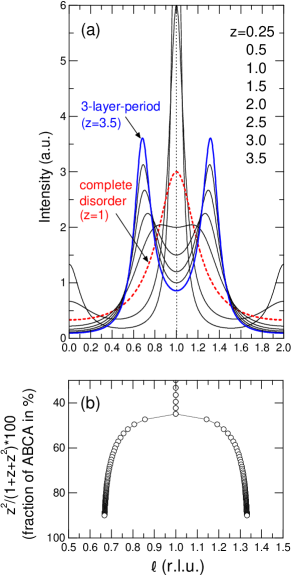
In Fig. 11(a) we show the -dependence of the scattered x-ray intensity for close-packed structures with second neighbor interaction, following the calculations by Hendricks and Teller. Hendricks42a ; Kakinoki54a Stacking faults can be introduced by tuning the probability for second neighbor layers to be alike or unlike. For details, see section 6 of Ref. Hendricks42a, . The curves in Fig. 11(a) were calculated for different degrees of stacking disorder , ranging from a predominant 2-layer period for (central peaks at integer ) to a predominant 3-layer period for (split peaks at with even). The dashed line (red) line is for complete disorder (), which is characterized by a central peak for odd and no obvious remains of the peaks at even . evenpeaks In Fig. 11(b) we show that, as the volume fraction with a 3-layer period decreases, the splitting in decreases and eventually disappears close to the point where complete disorder is reached.
The experimental results for Ar-annealed , in Fig. 9, clearly show that for a ground state with a 3-layer stacking period is favored over a 2-layer period. First, this indicates that stripes prefer to be all of the same type, i.e., either bond- or site-centered, but not mixed as in Fig. 10(c). Second, it shows that the Coulomb repulsion between stripes in second neighbor planes is significant. The fact that in Fig. 9(a) at 10 K the splitting in is somewhat smaller than , indicates a certain degree of disorder [cf. Fig. 11(b)]. Furthermore, it is obvious that the peak intensity at approximately is significantly lower than at . We assume that this difference is largely due to the structure factor, since the Bragg intensity at (442) is about a factor forty smaller than at (444). ABCimbalance From the width of the larger of the two peaks we have estimated a correlation length of Å, which corresponds to approximately three layers. correlationlength
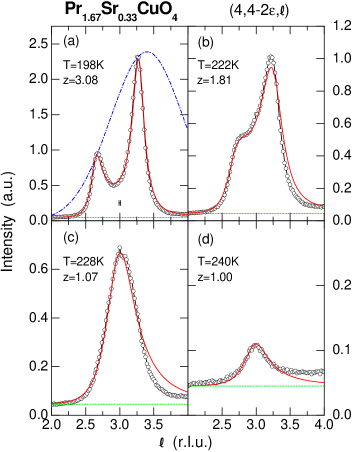
In Fig. 12 we present fits to the data obtained by the matrix method used by Hendricks and Teller, Hendricks42a multiplied by a slowly varying structure factor for which we assume the phenomenological, Gaussian -dependence indicated in Fig. 12(a). The only variables are the stacking parameter and the amplitude. A finite background estimated from -scans, a small offset in of -0.04 (explanation in Sec. IV.5), and the structure factor were kept constant for all temperatures. Obviously, the model provides a good description of the data. Moreover, the parameter gives us access to the temperature dependence of the stacking disorder. Note that fits with a different than the one shown in Fig. 12(a), e.g., with the maximum centered at , had virtually no effect on the -dependence of .
V.2 The charge stripe melting process
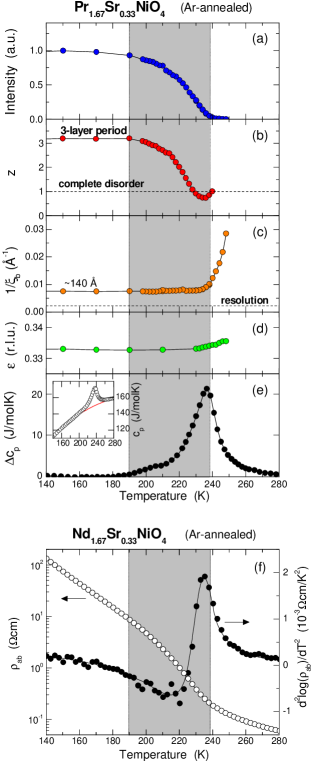
In Fig. 13 we compare the fitted with various properties of the Ar-annealed and crystals, such as the -integrated charge-peak intensity, the inverse in-plane correlation length of the charge stripe order, the incommensurability , the specific heat , and the in-plane resistivity . A pronounced maximum is observed in at 238 K, which we identify with , the onset of static charge stripe order. Above this temperature, charge peaks become very small, and starts to diverge, i.e., the in-plane stripe order melts. Du00aN In contrast, the parameter already starts to decrease at 200 K and reaches complete disorder () at about 228 K. From this we conclude that the melting of the 3D charge stripe lattice sets in with a melting of the interlayer correlations, leaving the 2D correlations intact, until these eventually melt at as well.
In Fig. 13(b) one can see that goes through a minimum and then increases for K. This anew increase goes along with the increase of and reflects the drastic decrease of the stripe correlations above . Note that, in , a clear minimum in was observed at about the same temperature. Du00aN We believe that there the increase of at temperatures below the minimum is a precursor of the formation of the 3-layer period stacking order. According to Fig. 13(b), at the temperature of the minimum, which, if taken serious, implies a slight tendency towards a 2-layer stacking period. It is certainly possible that, once the stacking order starts to melt, stripes can arrange more freely, and may assume a body-centered stacking order, for which the ordering wave vector is the same as in the case of disorder [cf. Figs. 8(b) and 10(c)]. However, further work is necessary to verify if our analysis, which is based on the model by Hendricks and Teller, correctly describes even such small details.
The spin stripe ordering temperature of our crystals has not yet been determined. While in both and can be identified by weak anomalies in the static magnetic susceptibility of the planes, this is impossible in the case of our crystals, because of the large paramagnetic contribution of the and ions. Klingeler05aN However, results from neutron diffraction in Ref. Kajimoto03aN, show that, in , spin stripes order at essentially the same temperature as in , with K. This means that the spin stripe order disappears just about the temperature where the -axis stacking correlations of the charge stripes start to melt. In this context it is worth noting that the low temperature side of the anomaly in has a shoulder which extends down to . Measurements of in Ref. Klingeler05aN, for a single crystal show this even more clearly. We believe that the shoulder indicates that the melting of the stripe stacking order is associated with a significant entropy change. entropy
Fingerprints of the melting of the interlayer stripe order well below are also observed in the electronic transport. In , in Fig. 1(f), the onset of the charge stripe order at is announced by a kink in log(), as is also evident from a peak in . However, the entire transition in log() is not sharp, but extends down to about 200 K, similar to the behavior of , , and the charge-peak intensity. One might think of this as a manifestation of the intimate connection between charge and spin stripe order, since it implies that the charge order has to be fairly progressed, before spin stripe order can occur.
Another interesting feature of the anomaly in is its extension towards high temperatures. In this region charge peaks become extremely weak and broad. It is reasonable to consider that both effects are related to slowly fluctuating charge stripe correlations. Du00aN Intensity from these correlations is picked-up due to the poor energy resolution of the x-ray diffraction experiment. An inelastic neutron scattering study of the incommensurable magnetic fluctuations in gives indirect evidence for a liquid phase of charge stripes above . Lee02aN
The present observations are consistent with a stripe smectic or nematic phase at . Kivelson98 (Note that this assignment is different from that originally made by Lee and Cheong. Lee97aN )
V.3 Comparison with TEM data
Our results concerning the stacking of stripes are in qualitative agreement with a recent transmission-electron-microscopy (TEM) study on tetragonal with x=0.275. Li03aN In this study, it was shown that, in domains of mesoscopic dimension, charge stripes are indeed one dimensional. However, the Sr content of gave rise to a mixing of features expected either for or , as well as features unique to this intermediate doping. In particular, the obtained average in-plane stripe distance () results in a mixture of site- and bond-centered stripes within the same plane. As a consequence, the stacking of stripes along is strongly disordered, with both simple body-centered arrangements as well as staggered shifts by prevalent. Li03aN
Here, we have shown that the orthorhombic symmetry of and can be used as a tool to obtain large single crystals with unidirectional stripe order, suited to the study of macroscopic properties. For and , stripes in a single plane are likely to be either all bond-centered or all site-centered, since the stripe distance of is commensurate with the lattice. In the case of long range in-plane order, the Coulomb interaction between stripes in first and second neighbor planes becomes crucial and stabilizes a stacking such as depicted in Fig. 10(a). Thus, for the first time, a stripe order with a 3-layer period has been observed in the x-ray diffraction pattern of a macroscopic crystal.
It is worthwhile mentioning that there are several studies of with matching the critical value of 1/3 quite well. Lee97aN ; Kajimoto01aN ; Du00aN ; Ishizaka04aN However, a stripe stacking order of the kind identified here in and has not been reported. These observations suggest that the stabilization of the 3-layer stacking period may benefit from the fact that, in orthorhombic crystals, the in-plane stripe order is unidirectional.
V.4 Comparison with
Besides the obvious differences, the electronic phase diagrams of nickelates and cuprates show some interesting similarities. In the present context it is particularly remarkable that, in , as long as is below the MI transition, a static diagonal spin stripe order forms. Wakimoto99a ; Wakimoto00a ; Fujita02a It remains an open experimental question, whether corresponding samples also exhibit diagonal charge stripes. In this respect, it is an interesting finding that, in nickelates with the LTO structure, stripes prefer to be parallel to the octahedral tilt axis, similar to the stripes in the cuprates. These findings thus provide motivation for further experimental searches for charge stripes in the insulating cuprates.
There are certainly alternative models for the lightly-doped cuprates that do not involve stripes Berciu04a ; Sushkov04a ; Luescher05a ; Lindgard05a ; Gooding97 ; however, there is also additional evidence for the cuprates suggesting a common coupling of charge and spin stripes to an orthorhombic lattice distortion. In and , both systems with parallel stripes and LTO structure, it was observed that the direction of the spin stripes is not perfectly parallel to the Cu-O bonds, but slightly inclined towards the diagonally running octahedral tilt axis (), by an angle too large to be explained with the orthorhombic lattice distortion. Lee99 ; Kimura00a Unfortunately, in these compounds, no charge peaks were detected. However, in Ref. Kimura04a, and Ref. Fujita02b, it was shown that in orthorhombic with , both spin stripes and charge stripes show the same inclination towards the octahedral tilt axis. This strongly suggests that, in both classes of materials, nickelates and cuprates, the response of charge stripes to orthorhombic lattice distortions is similar.
VI Conclusion
We have presented a detailed x-ray diffraction study which sheds light on
the coupling between the charge stripes and structural distortions in
and single crystals. In contrast to the sister compound
, both crystals undergo a HTTLTO transition well above
room temperature, so that stripe order at takes place in an
anisotropic environment. We find that the orthorhombic strain causes the
stripes to align parallel to the short -axis, which is also the
direction of the octahedral tilt axis. In addition to these
in-plane correlations, we have observed correlations between the planes,
which are consistent with a stacking period of three layers.
This stacking order is extremely vulnerable to interstitial oxygen
impurities and deviations of the total hole concentration from ; as
a result, it was observed in Ar-annealed samples, only. Further, we find
that the melting of the static charge stripe order is a two-step process,
which starts at 200 K with the melting of the interlayer correlations, and
is completed at with the melting of the in-plane correlations.
Implications for the stripe order in insulating have been
discussed. The observation of unidirectional stripes in and opens up the unique possibility to characterize their
anisotropic properties.
The work at Brookhaven was supported by the Office of Science, U.S. Department of Energy under Contract No. DE-AC02-98CH10886.
References
- (1) J.M. Tranquada. In A. Furrer, editor, Neutron Scattering in Layered Copper-Oxide Supercondcutors page 225. Kluwer, Dordrecht 1998.
- (2) R. Kajimoto, K. Ishizaka, H. Yoshizawa and Y. Tokura, Phys. Rev. B 67, 14511 (2003).
- (3) C. H. Chen, S-W. Cheong and A. S. Cooper, Phys. Rev. Lett. 71, 2461 (1993).
- (4) A. T. Boothroyd, P. G. Freeman, D. Prabhakaran, A. Hiess, M. Enderle, J. Kulda and F. Altorfer, Phys. Rev. Lett. 91, 257201 (2003).
- (5) K. Ishizaka, Y. Taguchi, R. Kajimoto, H. Yoshizawa and Y. Tokura, Phys. Rev. B 67, 184418 (2003).
- (6) C. C. Homes, J. M. Tranquada, Q. Li, A. R. Moodenbaugh and D. J. Buttrey, Phys. Rev. B 67, 184516 (2003).
- (7) J. M. Tranquada, B. J. Sternlieb, J. D. Axe, Y. Nakamura and S. Uchida, Nature 375, 561 (1995).
- (8) V. J. Emery and S. A. Kivelson, Physica C 209, 597 (1993).
- (9) S-W. Cheong, H. Y. Hwang, C. H. Chen, B. Batlogg, L. W. Rupp Jr. and S. A. Carter, Phys. Rev. B 49, 7088 (1994).
- (10) H. Yoshizawa, T. Kakeshita, R. Kajimoto, T. Tanabe, T. Katsufuji and Y. Tokura, Phys. Rev. B 61, R854 (2000).
- (11) A. Vigliante, M. von Zimmermann, J. R. Schneider, T. Frello, N. H. Andersen, J. Madsen, D. J. Buttrey, D. Gibbs and J. M. Tranquada, Phys. Rev. B 56, 8248 (1997).
- (12) Y. Yoshinari, P. C. Hammel and S-W. Cheong, Phys. Rev. Lett. 82, 3536 (1999).
- (13) S.-H. Lee, J. M. Tranquada, K. Yamada, D. J. Buttrey, Q. Li and S-W. Cheong, Phys. Rev. Lett. 88, 126401 (2002).
- (14) J. Li, Y. Zhu, J. M. Tranquada, K. Yamada and D. J. Buttrey, Phys. Rev. B 67, 12404 (2003).
- (15) G. Blumberg, M. V. Klein and S-W. Cheong, Phys. Rev. Lett. 80, 564 (1998).
- (16) P. Abbamonte, A. Rusydi, S. Smadici, G. D. Gu, G. A. Sawatzky and D. L. Feng, Nature Physics 1, 155 (2005).
- (17) C. Schüßler-Langeheine, J. Schlappa, A. Tanaka, Z. Hu, C. F. Chang, E. Schierle, M. Benomar, H. Ott, E. Weschke, G. Kaindl, O. Friedt, G. A. Sawatzky, H.-J. Lin, C. T. Chen, M. Braden, and L. H. Tjeng, Phys. Rev. Lett. 95, 156402 (2005).
- (18) M. Fujita, H. Goka, K. Yamada, J. M. Tranquada and L. P. Regnault, Phys. Rev. B 70, 104517 (2004).
- (19) T. Niemöller, N. Ichikawa, T. Frello, H. Hünnefeld, N. H. Andersen, S. Uchida, J. R. Schneider and J. M. Tranquada, Eur. Phys. J. B 12, 509 (1999).
- (20) H.-H. Klauss, W. Wagener, M. Hillberg, W. Kopmann, H. Walf, F. J. Litterst, M. Hücker and B. Büchner, Phys. Rev. Lett. 85, 4590 (2000).
- (21) W. Wagener, H.-H. Klauss, M. Hillberg M. A. C. de Melo, M. Birke, F. J. Litterst, B. Büchner and H. Micklitz, Phys. Rev. B 55, R14761 (1997).
- (22) J. M. Tranquada, J. D. Axe, N. Ichikawa, A. R. Moodenbaugh, Y. Nakamura and S. Uchida, Phys. Rev. Lett. 78, 338 (1997).
- (23) S. Wakimoto, G. Shirane Y. Endoh, K. Hirota, S. Ueki, K. Yamada, R. J. Birgeneau, M. A. Kastner, Y. S. Lee, P. M. Gehring and S. H. Lee, Phys. Rev. B 60, R769 (1999).
- (24) M. Fujita, K. Yamada, H. Hiraka, P. M. Gehring, S. H. Lee, S. Wakimoto and G. Shirane, Phys. Rev. B 65, 64505 (2002).
- (25) S. Wakimoto, R. J. Birgeneau, M. A. Kastner, Y. S. Lee R. Erwin, P. M. Gehring, S. H. Lee, M. Fujita, K. Yamada, Y. Endoh, K. Hirota and G. Shirane, Phys. Rev. B 61, 3699 (2000).
- (26) B. I. Shraiman and E. D. Siggia. Phys. Rev. B 46, 8305 (1992).
- (27) R. J. Gooding, N. M. Salem, R. J. Birgeneau and F. C. Chou, Phys. Rev. B 55, 6360 (1997).
- (28) M. Berciu and S. John, Phys. Rev. B 69, 224515 (2004).
- (29) O. P. Sushkov and V. N. Kotov, Phys. Rev. B 70, 24503 (2004).
- (30) A. Lüscher, G. Misguich, A. I. Milstein and O. P. Sushkov, cond-mat /0511453.
- (31) P.-A. Lindgård, Phys. Rev. Lett. 95, 217001 (2005).
- (32) J. Rodríguez-Carvajal, J. L. Martínez, J. Pannetier and R. Saez-Puche, Phys. Rev. B 38, 7148 (1988).
- (33) M. Medarde and J. Rodríguez-Carvajal, Z. Phys. B 102, 307 (1997).
- (34) V. Sachan, D. J. Buttrey, J. M. Tranquada, J. E. Lorenzo and G. Shirane, Phys. Rev. B 51, 12742 (1995).
- (35) O. Friedt, Diploma thesis, University of Cologne, Germany (1998).
- (36) M. Hücker, K. Chung, M. Chand, T. Vogt, J. M. Tranquada and D. J. Buttrey, Phys. Rev. B 70, 64105 (2004).
- (37) H. Woo, A. T. Boothroyd, K. Nakajima, T. G. Perring, C. D. Frost, P. G. Freeman, D. Prabhakaran, K. Yamada and J. M. Tranquada, Phys. Rev. B 72, 64437 (2005).
- (38) J. L. Martínez, M. T. Fernández -Díaz, J. Rodríguez -Carvajal and P. Odier, Phys. Rev. B 43, 13766 (1991).
- (39) D. J. Buttrey, J. D. Sullivan, G. Shirane and K. Yamada, Phys. Rev. B 42, 3944 (1990).
- (40) M. Medarde, J. Rodríguez-Carvajal, M. Vallet-Regí, J. M. González-Calbet and J. Alonso, Phys. Rev. B 49, 8591 (1994).
- (41) S. Bakehe, Ph.D. thesis, University of Cologne, Germany (2002).
- (42) H. Tamura, A. Hayashi and Y. Ueda, Physica C 258, 61 (1996).
- (43) J. D. Sullivan, D. J. Buttrey, D. E. Cox and J. Hriljac, J. Solid State Chem. 94, 337 (1991).
- (44) J. D. Axe, A. H. Moudden, D. Hohlwein, D. E. Cox, K. M. Mohanty, A. R. Moodenbaugh and Y. Xu, Phys. Rev. Lett. 62, 2751 (1989).
- (45) M. K. Crawford, R. L. Harlow, E. M. McCarron, W. E. Farneth, J. D. Axe, H. Chou and Q. Huang, Phys. Rev. B 44, 7749 (1991).
- (46) R. Bouchard, D. Hupfeld, T. Lippmann, J. Neuefeind, H.-B. Neumann, H.F. Poulsen, U. Rütt, T. Schmidt, J.R. Schneider, J. Süssenbach and M. von Zimmermann, J. Synch. Rad. 5, 90 (1998).
- (47) These reflections were measured after the crystal was exposed to air for about one year. Therefore, the crystal contains some excess oxygen, resulting in a larger and more inhomogeneous hole concentration than immediately after the Ar-annealing. This is apparent from the larger value of , and an approximately twice as large peak width [cf. Figs. 6(d) and 7(b)].
- (48) Note that we have integrated the intensity of the (330) peaks in both domains, i.e., and .
- (49) We mention that a newly grown crystal shows a sharp LTO/LTLO transition at 100 K and no intensity above that temperature. Results will be published elsewhere.
- (50) Note that the Hendricks-Teller model allows us to simulate the mixing of 3-layer and 2-layer period stacking segments at any ratio. In the case of a 2-layer stacking period like the one depicted in Fig. 10(b), peaks for even are allowed. However, it is very unlikely that in our samples the mixing of the 3-layer ground state with this 2-layer stacking type goes beyond the point of complete disorder. On the other hand, a ground state with a 2-layer period of the kind depicted in Fig. 10(c) is possible. For this body centered stacking type, charge peaks for even should be absent.
- (51) J. M. Tranquada, D. J. Buttrey and V. Sachan, Phys. Rev. B 54, 12318 (1996).
- (52) P. Wochner, J. M. Tranquada, D. J. Buttrey and V. Sachan, Phys. Rev. B 57, 1066 (1998).
- (53) R. Kajimoto, T. Kakeshita, H. Yoshizawa, T. Tanabe, T. Katsufuji and Y. Tokura, Phys. Rev. B 64, 144432 (2001).
- (54) K. Ishizaka, T. Arima, Y. Murakami, R. Kajimoto, H. Yoshizawa, N. Nagaosa and Y. Tokura, Phys. Rev. Lett. B 67, 196404 (2004).
- (55) S.-H. Lee, S-W. Cheong, K. Yamada and C. F. Majkrzak, Phys. Rev. B 63, 60405 (2001).
- (56) C-H. Du, M. E. Ghazi, Y. Su, I. Pape, P. D. Hatton, S. D. Brown, W. G. Stirling, M. J. Cooper and S-W. Cheong, Phys. Rev. Lett. 84, 3911 (2000).
- (57) S. Hendricks and E. Teller, The Journal of Chemical Physics 10, 147 (1942).
- (58) Equivalent with this are the sequences …BCBC… and …CACA… .
- (59) J. Kakinoki and Y. Komura, J. Phys. Soc. Japan 9, 169 (1954).
- (60) In Ref. Hendricks42a, it is mentioned that an imbalance in the population of domains with stacking sequence …ABCABC… and …CBACBA… can cause a similar effect. However, this effect should vary between different crystals. In contrast, in about half a dozen samples with a pronounced 3-layer stacking period, we always have observed a similar intensity ratio.
- (61) The correlation lengths were calculated from the peak width using and where HWHM is the half width at half maximum in reciprocal lattice units of and , respectively.
- (62) R. Klingeler, B. Büchner, S-W. Cheong and M. Hücker, Phys. Rev. B 72, 104424 (2005).
- (63) As was discussed in Ref. Klingeler05aN, , it is likely that both spin as well as charge degrees of freedom contribute to the entropy.
- (64) S. A. Kivelson, E. Fradkin and V. J. Emery, Nature 393, 550 (1998).
- (65) S.-H. Lee and S-W. Cheong, Phys. Rev. Lett. 79, 2514 (1997).
- (66) Y. S. Lee, R. J. Birgeneau, M. A. Kastner, Y. Endoh, S. Wakimoto, K. Yamada R. W. Erwin, S.-H. Lee and G. Shirane, Phys. Rev. B 60, 3643 (1999).
- (67) H. Kimura, H. Matsushita, K. Hirota, Y. Endoh, K. Yamada, G. Shirane, Y. S. Lee, M. A. Kastner and R. J. Birgeneau, Phys. Rev. B 61, 14366 (2000).
- (68) H. Kimura, Y. Noda, H. Goka, M. Fujita, K. Yamada, M. Mizumaki, N. Ikeda and H. Ohsumi, Phys. Rev. B 70, 134512 (2004).
- (69) M. Fujita, H. Goka, K. Yamada and M. Matsuda, Phys. Rev. B 66, 184503 (2002).