Nature of Versatile Chemisorption on TiC(111) and TiN(111) Surfaces
Abstract
Density-functional calculations on the polar TiX(111) (X = C, N) surfaces show (i) for clean surfaces, strong Ti-derived surface resonances (SR’s) at the Fermi level and X-derived SR’s deep in the upper valence band and (ii) for adatoms in periods 1–3, pyramidic trends in atomic adsorption energies, peaking at oxygen (9 eV). A concerted-coupling model, where adatom states couple to both kinds of SR’s in a concerted way, describes the adsorption. The chemisorption versatility and the general nature of the model indicate ramifications and predictive abilities in, e.g., growth and catalysis.
pacs:
68.43.-h, 73.43.Cd, 73.20.At, 71.20.BeIn surface processes, like catalysis and film growth, and in materials design [through, e.g., chemical- (CVD) and physical-vapor deposition (PVD), or molecular-beam epitaxy (MBE)], initial adsorption is of key importance. Transition-metal carbides and nitrides (TMX; X = C, N) Oyama are widely used as substrates, coatings, and interlayers in, e.g., cutting tools, electronics, catalysis, and biomaterials, and as components in the “MAX” phases Barsoum . A study of the nature of adsorption on TMX’s is thus highly motivated. Generally, TiC and TiN are considered to be models for these materials.
This Letter reports on an extraordinarily rich adsorptive variation on TiX(111) surfaces, found within a systematic density-functional-theory (DFT) study of CVD Al2O3/TiX coatings on cutting tools kappaAl2O3 . Our trend calculations on adatoms in periods 1–3 of the table of elements show large variety in chemisorption strength and diffusion barriers (Fig. 1). To understand this, a detailed analysis of calculated bulk, surface, and adsorbate electronic structures is performed. The adsorption-energy () trends are correlated with electron-structure trends: adsorbate-induced differences in surface densities of states [DOS()], real-space visualizations of state-resolved DOS’s [DOS()], and valence-charge distributions, yielding a model for the nature of chemisorption on TiX(111). The method relies on DFT calculations performed with the planewave-pseudopotential code dacapo dacapo , with PW91 GGA exchange-correlation functional. Details are given in Ref. Ruberto_Vojvodic_Lundqvist, .
Our analysis explains chemisorption on TiX(111) as arising from the concerted coupling between adatom states and different types of TiX surface resonances (SR’s) (Fig. 2): (i) a Ti-localized Fermi-level () SR (TiSR), which provides strong chemisorption through overlap with adatom frontier orbitals, giving well separated bonding (below the adatom level) and antibonding levels (above the TiSR and thus ) and (ii) X-localized SR’s (XSR’s) in the lower part of the surface upper valence band (UVB), which provide additional chemisorption, with strength depending on the energy separation between XSR’s and TiSR-modified adlevel. This concerted-coupling model (CCM) shows a decisive but earlier neglected role of subsurface X atoms for chemisorption. Its generality should make it relevant for other, similar, substrates.
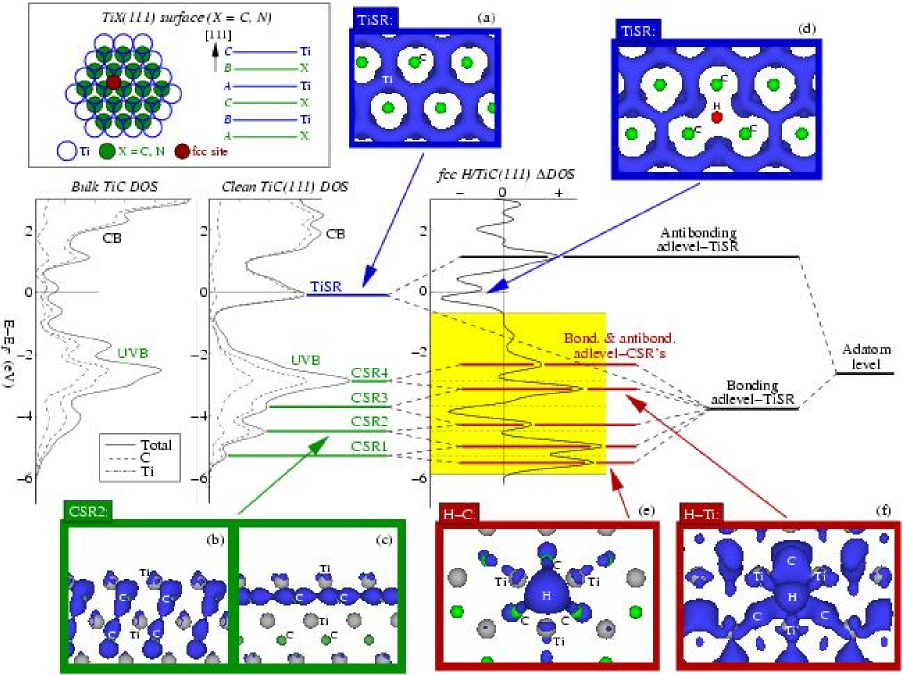
The NaCl-structured TiX’s are covalent, ionic, and metallic Schwarz . The clean, polar, TiC(111) surface, that is, prepared by flash heating under ultra-high vacuum (UHV) conditions, is Ti terminated (Fig. 2, inset) Aono ; Zaima ; Tan and chemically very active, with dissociative adsorption of H2, O2, and methanol and a sticking for oxygen 100 times stronger than on the stable, non-polar, and less reactive TiC(001) Zaima ; Bradshaw ; Edamoto . The TiC(111) polarity is stabilized by a compensating surface charge provided by the partial filling of a strong TiSR at Aono ; Zaima ; Bradshaw ; Tsukada . For TiN(111), experiments are scarce, while theory indicates an environment-dependent termination Ruberto_Vojvodic_Lundqvist ; Gall . To allow comparisons, Ti termination is here used for both (111) surfaces.
For bulk TiX, our results confirm and extend earlier findings Schwarz . Strength, structure, and hardness result from directed iono-covalent Ti–X bonds, with energies in an X-dominated UVB (bulk TiC DOS in Fig. 2). Corresponding antibonding Ti–X states lie in a Ti-dominated conduction band (CB), separated from the UVB by a pseudogap, a region of low but nonzero density of nonbonding Ti states. In TiC, falls in the middle of the pseudogap (Fig. 2). In TiN, the extra electron per formula unit populates the CB, pushing UVB and CB to lower energies Schwarz ; Ruberto_Vojvodic_Lundqvist and lowering the cohesion energy [14.8 (13.8) eV for TiC (TiN)]. Higher electronegativity of N makes TiN more ionic, yielding a higher X-localization of the TiN UVB Schwarz ; Ruberto_Vojvodic_Lundqvist and a higher TiX Bader Bader charge transfer [1.5 (1.6) electrons for TiC (TiN)]. Our DOS()’s show that the bonding Ti–X states lie mainly in the middle-upper UVB region, while the lower UVB region is dominated by bonding X–X states Ruberto_Vojvodic_Lundqvist ; Matar . Nonbonding X states form a separate lower valence band (LVB) at eV.
For TiX(111), our DOS()’s (TiC in Fig. 2, TiN in Ref. Ruberto_Vojvodic_Lundqvist, ) show significant Ti SR’s around , more filled on TiN due to its higher ionicity. DOS()’s [Fig. 2(a)] show that the TiSR’s are strongly localized around the surface Ti atoms and extend toward the fcc sites, i.e., what would be X sites in the bulk, there coupling with other surface Ti atoms. Thus, they are dangling bonds resulting from the cleavage of iono-covalent Ti–X states, which downshifts Ti-localized CB states and quenches X-localized states in the upper UVB region (Fig. 2). Cleavage modifies also the lower half of the UVB. The surface DOS()’s have three peaks below the main UVB peak, as opposed to one in the bulk (Fig. 2). DOS()’s show here a mixture of X–X bonding states, strongly localized to the surface but also extending into the bulk [Figs. 2(b–c) illustrate this, with similar plots also for the other UVB peaks Ruberto_Vojvodic_Lundqvist ]. Thus, the lower UVB region contains XSR’s, causing peak-structure changes in the surface DOS()’s (XSR1–XSR4, see Fig. 2).
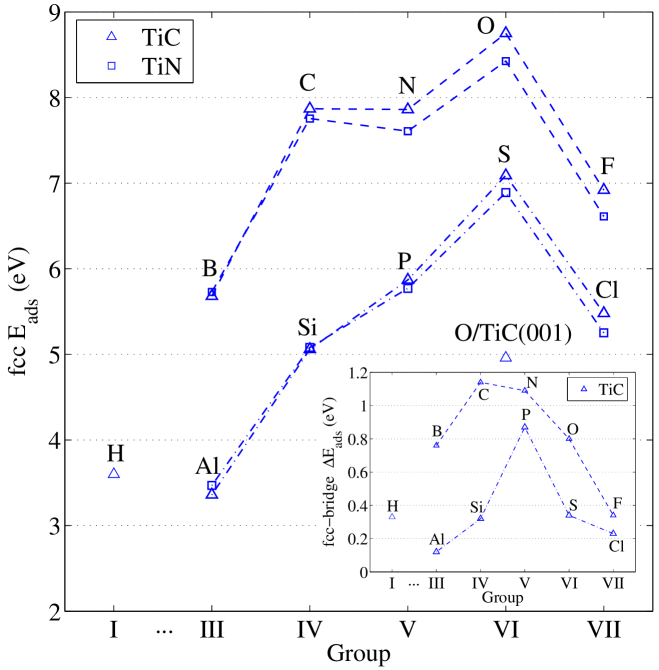
Our adsorption calculations include full relaxation of all considered adatoms in fcc, hcp, and top sites on TiX(111) and of oxygen in top-Ti and top-C sites on TiC(001). The calculated values 111The reference points are given by the energies of the isolated spin-polarized atoms in their multiplet ground state. show the following trends (Fig. 1) Ruberto_Vojvodic_Lundqvist : (i) much weaker O chemisorption on TiC(001) than on TiC(111); (ii) for all adatoms on TiX(111), preference for fcc site, followed by hcp; (iii) along both periods, pyramidic trends, peaking at group-VI elements (O and S); (iv) within each group, stronger bonds in period 2 than in period 3; (v) very close C and N values; (vi) very similar TiC and TiN values; (vii) a striking crossing of the TiC and TiN trends; and (viii) large variations in estimated fcc–hcp diffusion barriers (i.e., differences between fully-relaxed fcc/hcp sites and perpendicularly-relaxed bridge sites 222Free relaxation brings all bridge adatoms to the fcc site.).
A combined analysis of calculated DOS()’s and DOS()’s reveals the nature of chemisorption. Key features are illustrated by the results for fcc H on TiC(111), showing (Fig. 2): (i) a strong negative Ti-derived double peak around , corresponding to a TiSR depletion around the H adatom [Fig. 2(d)]; (ii) a strong positive Ti-derived peak at eV; (iii) a strong negative C-derived peak close to the substrate CSR3 peak ( eV); (iv) a broad H-derived positive region between and eV (peaks at , , and eV), characterized by strong H–C bonding states [Fig. 2(e)] and weaker H–Ti contributions; and (v) a positive region between and eV (peaks at , , and eV), characterized only by H–Ti bonding states [Fig. 2(f)].
This evidences a strong adatom–TiSR coupling that depletes the TiSR at and yields antibonding states above (at eV) and bonding states below (positive DOS regions between and eV). Also, couplings to CSR’s are revealed, since (i) the strong broadening and splitting of the bonding adatom–TiSR states, (ii) the presence of negative peaks in the C-projected DOS at the substrate CSR peak energies, and (iii) the presence of bonding adatom–C states in only the lower UVB region, successively stronger for lower-energy peaks, indicate that the positive DOS peaks in-between the substrate UVB peaks correspond to combinations of bonding and antibonding adatom–CSR states (successively more bonding for lower-energy peaks). Thus, the adatom couples in a concerted way to both TiSR and CSR’s. This CCM is summed up in Fig. 2.
Similar analyses for the other adatoms on TiC and TiN (Fig. 3 and Ref. Ruberto_Vojvodic_Lundqvist, ) corroborate the CCM. However, changes in adatom group number (IIIVII), period number (23), and substrate (TiCTiN) affect the calculated electronic structures for adatoms in periods 2–3:
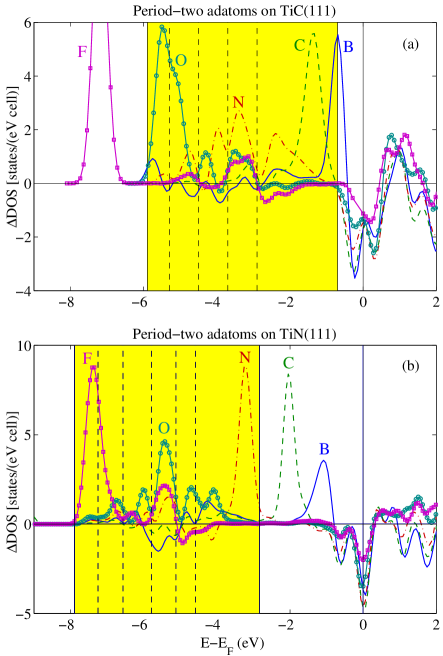
(i) Increasing the adatom group number within each period downshifts the adatom energy level. The adlevel–TiSR energy matching is thus successively reduced. Indeed, the negative DOS peaks at decrease successively as group IVVII (Fig. 3), indicating a weakening adlevel–TiSR coupling. On the other hand, the adlevel–XSR matching increases as group IIIVI. According to our DOS’s and DOS()’s, this strengthens successively the adatom–XSR couplings, as exemplified by period-two adatoms on TiC(111) [Fig. 3(a) and Ref. Ruberto_Vojvodic_Lundqvist, ]: for B, the effective adatom level lies at the upper UVB edge and is very sharp, indicating no coupling with UVB states; for C, the adatom state lies in the upper UVB region, is slightly broadened, and forms a small, weakly bonding, adatom–C subpeak just below CSR4, indicating a weak adatom–UVB coupling; for N, the situation is similar to H, the adlevel lying in the middle of the UVB and strongly broadening and splitting into subpeaks of mixed bonding and antibonding adatom–C character (more bonding at lower energies); for O, the adlevel lies in the CSR-dominated UVB region and forms strong adatom–C bonds. Similar results are obtained for period-2 adatoms on TiN(111) [Fig. 3(b)] and period-3 adatoms on both TiX(111) surfaces Ruberto_Vojvodic_Lundqvist . Thus, the increasing group IIIVI trend follows closely the increasing adlevel–XSR coupling trend, while very poor correlation is found with the adlevel–TiSR trend. The opposing adlevel–XSR and adlevel–TiSR trends can, however, explain the almost constant value as CN.
(ii) Increasing the adatom period number within each group increases the adatom radius and upshifts the adlevel, due to core orthogonalization. The first effect reduces adlevel–SR wavefunction overlaps. Our DOS’s show that this affects the adatom–TiSR coupling strength, decreasing the negative peaks at Ruberto_Vojvodic_Lundqvist . The second effect changes the adlevel–SR energy matchings. Our DOS’s and DOS()’s show that this weakens the adatom–XSR coupling strengths, reducing the broadening and splitting of the TiSR-modified adlevel Ruberto_Vojvodic_Lundqvist . Thus, the decreasing period 23 trend follows closely these reductions in both adatom–TiSR and adatom–XSR coupling strengths.
(iii) Changing the substrate from TiC to TiN(111) causes a downshift of all SR’s and an increase of the clean-substrate TiSR filling. For a given adatom, the first effect reduces the adlevel–XSR matching, thus weakening the adatom–XSR couplings (Fig. 3). The second effect strengthens the adatom–TiSR coupling, as evidenced by the larger depletion of TiSR electrons on TiN (Fig. 3). For low adatom-group numbers, the adlevel–XSR matching is negligible on both surfaces and the adatom–TiSR coupling dominates, thus favoring adsorption on TiN. As the group number increases, the adatom–TiSR coupling weakens in favor of the adatom–XSR couplings, causing successively stronger adsorption on TiC. Hence, the crossing of the TiC and TiN trends is well explained by the opposing trends in adlevel–TiSR and adlevel–XSR matchings as the group number increases.
Thus, the trends are well correlated with electron-structure trends in which both types of SR’s (TiSR and XSR’s) are considered. This is further supported by:
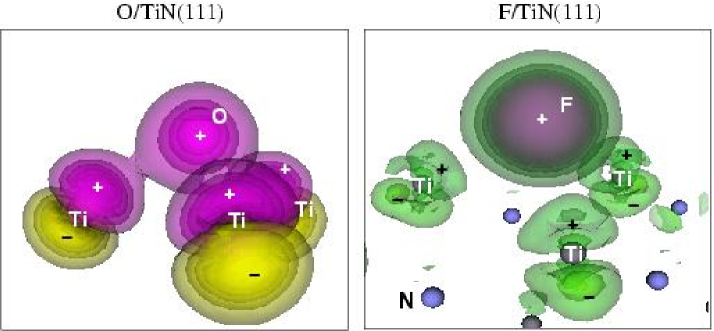
(iv) The weaker chemisorption at the end of each adatom period does not follow the energy-matching trends of (i) above. Yet, sharper DOS peaks for F and Cl, compared to other adatoms with same adlevel–XSR energy matchings (Fig. 3 and Ref. Ruberto_Vojvodic_Lundqvist, ), indicate weaker adatom–XSR couplings for group-VII adatoms. The electronic structure shows a change in adatom–TiSR bond nature from iono-covalent to ionic as group VIVII: smaller TiSR quenchings (Fig. 3), almost spherical adatom valence-electron distributions (Fig. 4), Bader charge transfers to the adatoms of 0.75–0.80 electrons, mostly from the nearest-neighbor Ti atoms, and mainly adatom-centered DOS()’s at the adatom-peak energies for F and Cl. Thus, the weaker adatom–XSR couplings for F and Cl are caused by their almost completely filled valence shells, which are essentially inert to interaction with the UVB. Also, for F/TiC(111) the adlevel lies well below the substrate UVB, yielding further adatom–XSR weakening. These effects weaken the chemisorption as group VIVII.
(v) The much weaker chemisorption on TiC(001) evidences the importance of the adatom–TiSR coupling, as TiC(001) lacks TiSR at Zaima ; Oshima001 ; Ruberto_Vojvodic_Lundqvist .
(vi) The stronger adsorption in fcc than hcp follows from the TiSR spatial extent [Fig. 2(a)], which favors adlevel–TiSR wavefunction overlap and thus adatom–TiSR coupling in fcc. In turn, this causes a larger downshift of the TiSR-modified adlevel compared to hcp, affecting the adlevel–XSR energy matching and thus also the adatom–XSR coupling strengths (as shown for O/TiC in Ref. Ruberto_Vojvodic_Lundqvist, ). The largest such effect should be obtained for adatoms with adlevel close to the XSR’s. Indeed, our calculated fcc–hcp differences show pyramidic trends that are very similar to those for the fcc values (with peaks, for TiC, at N and S Ruberto_Vojvodic_Lundqvist ), showing again a very good correlation between calculated values and adlevel–XSR matching trends. It can be expected that diffusion-barrier variations (Fig. 1) are explainable in a similar way.
Thus, the CCM well describes the key features of the trends on TiX. The large adsorptive variety is caused by the concerted action of adatom couplings to both surface TiSR and subsurface XSR’s. The model should apply also to other systems with similar electronic structures, such as other TMX’s, and thus have broad technological implications.
Financial support from VR and SFS via ATOMICS and the allocation of computer resources at UNICC and SNIC are gratefully acknowledged.
References
- (1)
- (2) S.T. Oyama, The Chemistry of Transition Metal Carbides and Nitrides (Blackie Academic and Professional, London, 1996).
- (3) M.W. Barsoum, Prog. Solid St. Chem. 28, 201 (2000).
- (4) Y. Yourdshahyan et al., J. Am. Ceram. Soc. 82, 1365 (1999); C. Ruberto et al., Phys. Rev. Lett. 88, 226101 (2002); Phys. Rev. B 67, 195412 (2003); C. Ruberto, Ph. D. Thesis, Chalmers Univ. of Technology, Sweden 2001.
- (5) http://www.camp.dtu.dk/campos
- (6) C. Ruberto and B.I. Lundqvist, Phys. Rev. B (submitted); A. Vojvodic et al., Surf. Sci. (to be published); C. Ruberto et al., ibid. (to be published).
- (7) K. Schwarz, CRC Crit. Rev. Sol. St. Mater. Sci. 13, 211 (1987).
- (8) M. Aono et al., Jpn. J. Appl. Phys. 20, L829 (1981).
- (9) S. Zaima et al., Surf. Sci. 157, 380 (1985).
- (10) K.E. Tan et al., Surf. Sci. 348, 49 (1996).
- (11) A.M. Bradshaw et al., Sol. St. Comm. 37, 37 (1980).
- (12) K. Edamoto et al., J. El. Spectr. Rel. Phenom. 88–91, 805 (1998).
- (13) M. Tsukada et al., J. Phys. Soc. Jpn. 51, 2562 (1982).
- (14) D. Gall et al., J. Appl. Phys. 93, 9086 (2003).
- (15) R.F.W. Bader, Chem. Rev. 91, 893 (1991).
- (16) S.F. Matar et al., J. Mater. Chem. 7, 99 (1997).
- (17) C. Oshima et al., Surf. Sci. 102, 312 (1981).