Observation of classical rotational inertia and nonclassical supersolid signals in solid 4He below 250 mK
Abstract
We have confirmed the existence, as first reported by Kim and Chan, of a supersolid state in solid 4He at temperatures below 250 mK. We have employed a torsional oscillator cell with a square cross section to insure a locking of the solid to the oscillating cell. We find that NCRI signal is not a universal property of solid 4He, but can be eliminated through an annealing of the solid helium sample. This result has important implications for our understanding of the supersolid state.
pacs:
67.80.-s, 67.80.MgEunseong Kim and Moses Chan (KC) of Penn State University first reported Kim and Chan (2004a) the observation of supersolid behavior for solid 4He confined within the porous media of porous gold and Vycor glass. KC followed this remarkable discovery with the observation of a supersolid or non-classical rotational inertia (NCRI) signal in bulk solid helium Kim and Chan (2004b). An important goal, which we have achieved in our experiments, has been to provide an independent confirmation of the KC observations for bulk 4He. We have also investigated the influence of annealing and sample preparation on the existence of the supersolid state. We find that the supersolid state is not a universal property of solid 4He, but that it is possible through crystal annealing near the melting curve to create samples that show only classical rotational inertia (CRI).
In these measurements we have employed the torsional oscillator technique developed at Cornell over the past several decades Wong (1988). Oscillators with two different sample geometries were used in the experiments reported in this letter. The first had a cylindrical sample geometry with an internal volume of 2.7 cm3 and operated at a frequency of 253 Hz, while the second had a cubic geometry with a volume of 1.4 cm3 and operated at 185 Hz. The helium used in the experiments was commercial well-grade helium similar to that used by KC in their bulk solid helium work Kim and Chan (2004b). This helium has a stated 3He impurity level of 0.2 - 0.3 ppm.
Our earliest runs were made with the cylindrical cell. Data obtained with this cell at a pressure of 27 bar showed an onset of the supersolid signal at a temperature near 0.2 K, with a maximum signal amplitude at 30 mK of 0.6 % of the total period shift seen upon forming the solid in the cell. The magnitude of this signal is in good agreement with the observations of KC made under similar conditions and provides a confirmation of their results. In an attempt to improve the size of our NCRI signal we increased the sample pressure toward 55 bar. The cell failed before reaching this pressure.
A diagram of our second cell is shown in Fig. 1.
The design is similar to that of our first cell with several significant modifications. First, we have converted the interior of the cell to a nearly cubic geometry by epoxying a Tellurium-Copper insert into the cylindrical volume of the Beryllium-Copper oscillator. The insert was machined to provide a cubic sample region. We incorporated a capacitance strain gauge at the top of the cell which allows us to determine the pressure after solidification. In addition we have mounted a heater and thermometer directly on the cell. The solid samples were grown with the blocked capillary method, where the helium crystal was formed in the fill line first while cooling. The heater on the cell gives us the option to melt the sample while keeping the helium in the fill line and heat sinks frozen. These changes have resulted in an increase of the moment of inertia of the cell and reduction of the resonance frequency from 253 to 185 Hz.
We were motivated to adopt the noncircular sample geometry by the recent suggestion of Dash and Wettlaufer Dash and Wettlaufer (2005) that the reduction in the moment of inertia observed by KC might be caused by slippage of the solid, owing to grain boundary premelting at the surface of contact between the solid helium and the walls of the cylindrical container. The square cross section of our cubic sample cell provides a geometric locking of the solid to the oscillating container, so the mechanism of Dash and Wettlaufer Dash and Wettlaufer (2005) may not be invoked to explain the presence of a NCRI signal. Another possibility is that the NCRI signal results from superflow along the connected grain boundaries of a highly polycrystalline 4He solid. Our observations cannot directly distinguish between this possibility and a more homogeneous flow throughout the solid.
Much of the discussion of the supersolid state is premised on the hypothesis that Bose-Einstein condensation (BEC) underlies the supersolid phenomenon. For a BEC superfluid, the superfluid velocity is determined by the gradient of the phase of the condensate wavefunction; for incompressible superflow, the condensate phase constitutes a velocity potential function satisfying Laplace’s equation. Fetter Fetter (1974) has considered the problem of superfluids within rotating cylinders of various cross-sections. In the case of a circular cross-section, the superfluid can remain at rest while the wall rotates; in the case of a noncircular cross-section, however, this is not possible because part of the fluid is displaced by the walls as the cell rotates. In the case of a square cross-section, Fetter finds a fraction of 0.156 times the solid body moment of inertia of the fluid is entrained by the motion of the walls. The tangential velocity of the superflow relative the walls is nonuniform reaching a maximum value, vmax = 1.35 L/2 kelken (2006b), at the center of the side walls, where is the angular velocity and L is the edge length of the square cell. In estimating the rim velocities we take this factor into account. The corners of the square are stagnation points where the velocity of the fluid relative to the wall is zero and the fluid moves with the container.
In Fig. 2, we show the period (closed circles) and dissipation data, Q-1(stars), plotted against cell temperature for a typical measurement showing supersolid behavior. This sample was formed by entering the solid phase at 27 bar. It then took 70 minutes to cool to 1 K. The data displayed were taken as we cooled at a rate of 100 mK/hour to the lowest temperature. The maximum velocity at the center of the walls below the transition temperature is 9.2 m/s. For comparison, we show the period data for the empty cell (open circles) set to zero at 0.5 K. We expect the period to be temperature independent for a system displaying classical rotational inertia. The period data of our 27 bar sample follow CRI down to a temperature near 0.3 K. As the temperature is reduced the period gradually falls below the CRI value and changes most rapidly below 0.2 K, where a marked peak appears in the dissipation. These features are the NCRI signals as seen in the Penn State measurements and signify the transition to the supersolid state. The sample was cooled through the bcc into the hcp phase, which may explain the large signal seen for this sample. These data bear a resemblance to the torsional oscillator period and dissipation data seen for the Kosterlitz-Thouless transition in 4He films Bishop and Reppy (1978).

The scale for the dissipation is determined by a ring-down measurement of the quality factor. For the data shown in Fig. 2, the dissipation level, Q-1, at temperatures above the transition is on the order of 1.1 x 10⁻⁵, to be compared to an empty cell value of about 1.0 x 10⁻⁶ at the same temperature. For this sample, the solid contributes a substantial excess dissipation in addition to that of the empty oscillator, even at temperatures well above the supersolid transition. As will be shown, this additional contribution to the dissipation of the oscillator is largely absent for samples that do not show the supersolid phenomenon.
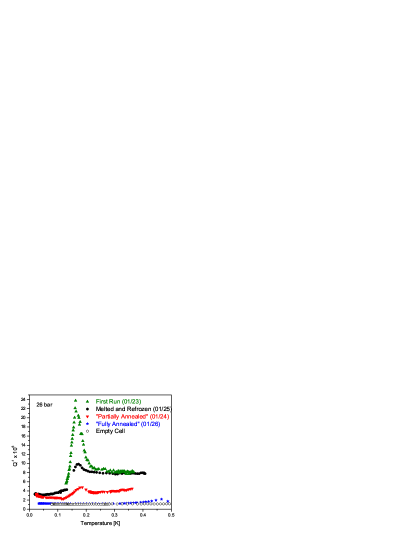
In Fig. 3 and 4, we show the period and dissipation data for a sequence of runs which illustrate the effect of annealing on the supersolid signal. The first run, on 01/23/06, shows the characteristic indication of the supersolid transition in both the period and the dissipation signals. After solidification, the cell was cooled at a rate of 150 mK/hour. Between this run and the next, on 01/24/06, the cell was taken to a temperature between 1.1 and 1.2 K, still below the melting temperature, and held there for about 100 minutes and then allowed to cool at a rate similar to that on 01/23. This “partial” annealing produced a marked reduction in the size of the NCRI period signal, and there was also a reduction in the magnitude of the dissipation peak.
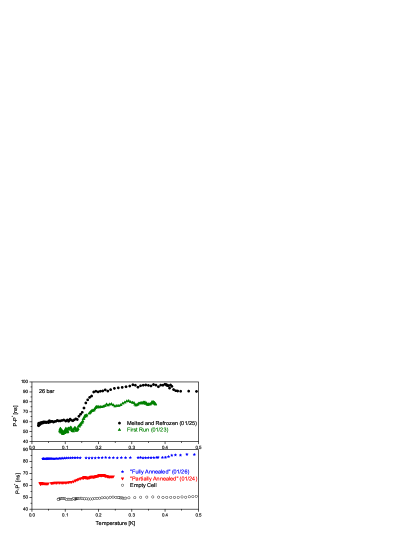
Following this run, we heated the sample and the mixing chamber to a temperature well above the melting temperature and then cooled in 30 minutes from the melting temperature of about 1.5 K back to below 1 K before beginning the run of 01/25. This rapid cool-down produced a sample in which the full supersolid signal as seen in the 01/23 run was recovered.
In preparation for the next run on 01/26, we again annealed the sample. The sample was held between 1.4 and 1.5 K for 13 hours before being allowed to cool to near 0.5 K. Following this “full” annealing process, a low temperature sweep revealed no hint of a supersolid state in either the period or in the dissipation data.
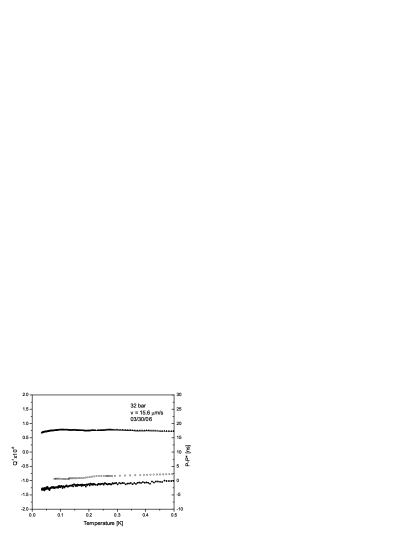
We have also examined a few samples formed at pressures between 31.5 bar and 34.5 bar with the intention of avoiding any complications associated with the bcc phase. The higher pressure samples all show the CRI state. This may be due to annealing while cooling from the higher temperatures required for entering the hcp solid phase at pressures above the bcc phase. In Fig. 5, we show Q-1 (triangles) and P (closed circles) of such a sample in which the solid phase was entered at a pressure of 32 bar. After solidification it took 40 minutes to cool below 1 K. The dissipation of 0.7 x 10⁻⁶ is indistinguishable from the empty cell value for this run. The period drops gradually by 3 ns without a distinct drop. We melted and refroze the sample twice without observing the NCRI state. We also repeated these measurements for maximum wall velocities of 13.6 m/s, 15.6 m/s, 20.8 m/s, and 36.6 m/s with the same result.
| p | Date | v80mK | v300mK | T(Q) | Q-1 x 10⁶(300 mK) | P | |
|---|---|---|---|---|---|---|---|
| [bar] | [m/s] | [m/s] | [mK] | [ns] | |||
| First Run | 26 | 01/23 | 25.4 | 36.6 | 163 | 8.2 | 27 |
| Partial Anneal | 26 | 01/24 | 39.6 | 36.7 | 186 | 3.9 | 6 |
| Melted/Refrozen | 26 | 01/25 | 16.3 | 12.9 | 170 | 7.9 | 35 |
| Full Anneal | 26 | 01/26 | 45.7 | 44.4 | N/A | 1.2 | 0 |
| 27 | 03/30 | 9.2 | 11.3 | 148 | 11.0 | 94 | |
| 32 | 04/10 | 15.6 | 17.2 | N/A | 0.7 | 0 |
In table 1, we show a summary of velocity and period shift data for the runs shown in Figures 2, 3, 4, 5. According to KC Kim and Chan (2004b), the critical velocity at 26 bar in an annulus is 38 m/s and the period drop is reduced by about 35 % at 65 m/s. With maximal velocities of 39.6 m/s, and 45.7 m/s, we would expect a period drop of at least 20 ns, a reduction by 35 %. At 30 bar, KC Kim and Chan (2006b) find a signal reduction of about 30 % for a velocity of 27 m/s, which cannot explain the absence of NCRI in our experiments; v80mK is 13.6 m/s.
An important aspect of the data is the correlation between CRI and low dissipation levels at 300 mK. We believe that the high Q found for our non-supersolid samples indicates a state with fewer defects than in the supersolid samples. Together with the metastability of the NCRI, this observation suggests that crystal imperfections, such as dislocations, vacancies, and grain boundaries, whose presence is indicated by excess dissipation, are essential for the existence of the supersolid state.
These findings are in accord with the recent path-integral-monte-carlo calculations of B.K. Clark and D.M. Ceperley Clark and Ceperley (2004), who find that an ideal hcp 4He crystal will not support BEC or off-diagonal-long-range-order (ODLRO) and consequently is not expected to display supersolid behavior. Further, M. Boninsegni, N. Prokof’ev, and B. Svistunov Boninsegni et al. (2006) find that a degree of disorder is required for the 4He solid to become a supersolid.
In this letter, we report two findings. First, we have observed the supersolid signal for solid 4He samples contained in both cylindrical and cubic geometries. The fractional period shift observed is of the same order of magnitude as that reported by Kim and Chan. This contrasts with the report of Keiya Shirahama (Keio University, Japan) Shirahama (2006), who has observed a supersolid signal an order of magnitude smaller than that seen in the Penn State and Cornell experiments.
Second, we find that the supersolid signal is not a universal property of solid 4He, but can be reduced and even eliminated in annealed samples. These annealed non-NCRI samples display lower dissipation levels than the NCRI samples, indicating, we believe, a lower degree of crystal imperfection. The absence of supersolid behavior in the annealed samples is supported by the recent theoretical findings that an ideal hcp 4He crystal does not support ODLRO or BEC Clark and Ceperley (2004),Boninsegni et al. (2006). We note that the Penn State and Keio University groups Chan and Shirahama (2006) have both undertaken annealing experiments. Changes have been seen in the signal size; however, these experiments have not been successful in eliminating the NCRI signal.
Acknowledgements.
We would like to acknowledge the support of our colleagues at Cornell and elsewhere. In particular, we thank Moses Chan, Erich Mueller, J. Seamus Davis, Jeevak Parpia and David Lee for their encouragement and assistance. We are indebted to Kelken Chang for providing the detailed solution for the potential flow in a square geometry. One of us, JDR, would like to thank the Kavli Institute for Theoretical Physics and the Aspen Center for Physics for their hospitality. The work reported here has been supported by the National Science Foundation under Grant DMR-0203244 and through the Cornell Center for Materials Research under Grant DMR-0520404.References
- Kim and Chan (2004a) E. Kim and M. H. W. Chan, Nature 427, 225 (2004a).
- Kim and Chan (2004b) E. Kim and M. H. W. Chan, Science 305, 1941 (2004b).
- kelken (2006b) K. Chang private communication (2006).
- Wong (1988) G. K. Wong, Torsional Oscillators in Experimental Techniques in Condensed Matter Physics at Low Temperatures, Eds. R. C. Richardson and E. N. Smith, Addison-Wesley, 187 (1988).
- Dash and Wettlaufer (2005) J. G. Dash and J. S. Wettlaufer, Phys. Rev. Lett. 94, 235301 (2005).
- Fetter (1974) A. L. Fetter, J. Low Temp. Phys. 16, 533 (1974).
- Bishop and Reppy (1978) D. Bishop and J. Reppy, Phys. Rev. Lett. 40, 1727 (1978).
- Clark and Ceperley (2004) B. K. Clark and D. M. Ceperley, Phys. Rev. Lett. 93, 155303 (2004).
- Boninsegni et al. (2006) M. Boninsegni, N. Prokof’ev, and B. Svistunov, Phys. Rev. Lett. 96, 105301 (2006).
- Shirahama (2006) K. Shirahama, BAPS, 2006 March Meeting, 302 (2006).
- Chan and Shirahama (2006) M. H. W. Chan and K. Shirahama, private communication (2006).
- Kim and Chan (2006b) E. Kim and M. H. W. Chan, cond-mat/0605680 (2006b).