New Luttinger liquid physics from photoemission on Li0.9Mo6O17
Abstract
Temperature dependent high resolution photoemission spectra of quasi-1 dimensional Li0.9Mo6O17 evince a strong renormalization of its Luttinger liquid density-of-states anomalous exponent. We trace this new effect to interacting charge neutral critical modes that emerge naturally from the two-band nature of the material. Li0.9Mo6O17 is shown thereby to be a paradigm material that is capable of revealing new Luttinger physics.
pacs:
71.10.Pm, 71.10.Hf, 79.60.-iCondensed matter physics owes much to research on paradigm materials, i.e. materials that typify a basic phenomenon and often a whole class of materials. The best paradigm materials not only provide a proof of existence in nature, but also reveal new physics of the phenomenon. E.g., research on silicon has shaped the understanding of covalently bonded semiconductors. This paper reports research on Li0.9Mo6O17 that not only solidifies its status as a paradigm quasi-1 dimensional (Q1D) material showing Luttinger liquid (LL) physics, but goes beyond previous work on this or any other Q1D material to reveal new LL physics as well.
The LL theory Haldane81 provides an understanding of the 1D orthogonality catastrophe, in which single-electron behavior cannot be adiabatically continued from a 1D system of free electrons when electron-electron interactions are included. This striking phenomenon is directly observable in angle integrated photoemission experiments Dardel91 as a nearly complete power law suppression of the single particle density of states (DOS) at the Fermi energy . LL theory also characterizes (1) the low-energy excitation spectrum as consisting entirely of independent, linearly dispersing spin and charge density fluctuations (spinons and holons, respectively) and (2) the various correlation functions as displaying power law behaviors with anomalous exponents, e.g. for the single particle DOS near . For this theory to apply in a real solid material, it is essential to have (i) high anisotropy and (ii) linearity of the dispersion of the underlying bands over a substantial energy range away from . The importance of (ii), e.g. in setting the energy scale for observing LL behavior, tends to be overlooked.
Among all the few Q1D solids otherLL for which LL behaviors are claimed, Li0.9Mo6O17 is unique as a metal with a well understood band structure Whangbo88 that clearly satisfies both criteria. Strong anisotropy has been confirmed by various experiments Greenblatt84 ; Choi04 and linear dispersion over a range eV from is observed in angle resolved photoemission spectroscopy (ARPES) JDD99 ; Gweon01 ; Gweon02 ; Gweon03 ; Allen02 ; Gweon04 , which directly measures the single particle spectral density as a function of momentum and energy .
ARPES spectra JDD99 ; Gweon01 ; Gweon02 ; Gweon03 ; Gweon04 ; Allen02 have shown expected holon and spinon Gweon03 features near , and also a power law DOS when angle integrated. These findings are strongly supported qualitatively by recent tunneling spectroscopy Hager05 that also shows a power law DOS near . However, the values of , and , extracted from tunneling and ARPES, respectively, are quite different. The only hope of reconciling this difference lies in the differing T ranges, 5-55 K, and 250-300 K of the two experiments, respectively. Unfortunately, as we show below, such a large T-renormalization of is inconsistent with Li0.9Mo6O17 transport properties implying T-independent within usual one-band LL theory. In this Letter we report new ARPES directly showing that the large T-renormalization of does indeed occur and we show that its origin lies in interacting charge neutral critical modes that emerge naturally for Li0.9Mo6O17 because two bands cross . The theory also predicts the possibility of observing two distinct kinds of (T) behavior on various sample surfaces, as may actually have been observed. This is both the first observation and the first theory of such a strong anomalous exponent T-dependence.
ARPES experiments over a wide T-range 15-300 K, with photon energies 24 eV and 30 eV, were performed at the U1-NIM undulator beamline of the Synchrotron Radiation Center of the University of Wisconsin. Single crystal samples were grown by the temperature gradient flux method and were cleaved in-situ at pressure torr for measurement. A Scienta SES2002 spectrometer with an acceptance angle of 14∘ was used for all data. Freshly evaporated gold was measured before and after the experiment at temperature K, for a careful calibration of the Fermi enegy as well as the instrumental energy resolution, meV FWHM. We have collected extensive data for samples cleaved at different temperatures and with the measurement temperature both increasing and decreasing.
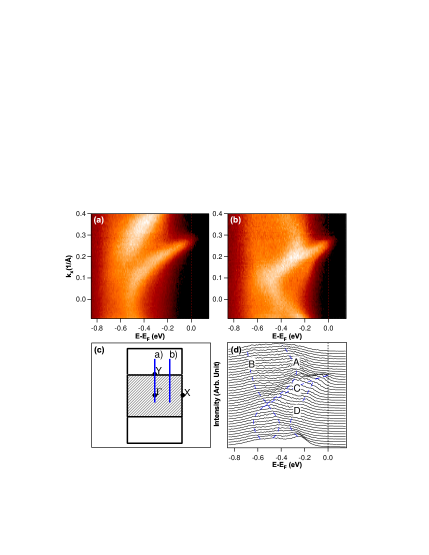
The ARPES spectra in Figs. 1(a) and 1(b) were taken with angular resolution ∘ and the analyzer slit perpendicular to the Q1D Fermi surface (FS) to show the band dispersions. The associated k-space paths are illustrated in Fig. 1(c). Li0.9Mo6O17 has 4 Mo 4d bands near , labeled A - D in Fig. 1(d). Two of them (C and D) become degenerate at binding energy eV, then disperse linearly Gweon03 and cross together to define the Q1D FS. Along path (a), the intensity of band D is very suppressed by the ARPES matrix element. However, both C and D are clearly seen along path (b). The measured band structure is in good agreement with that found previously by ARPES and qualitatively with the band structure calculations. The same spectra were taken at various temperatures down to 15 K and show no apparent change of the bands.
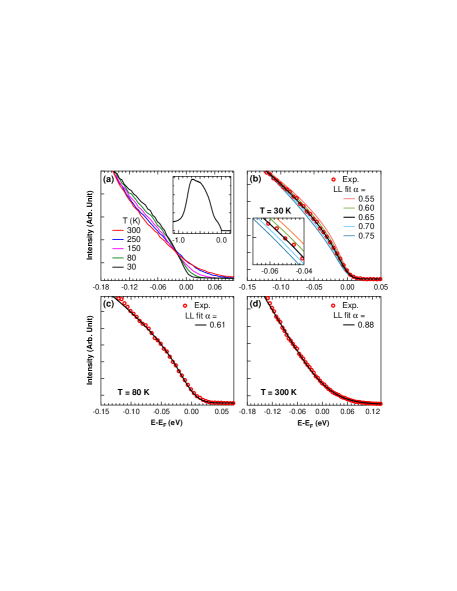
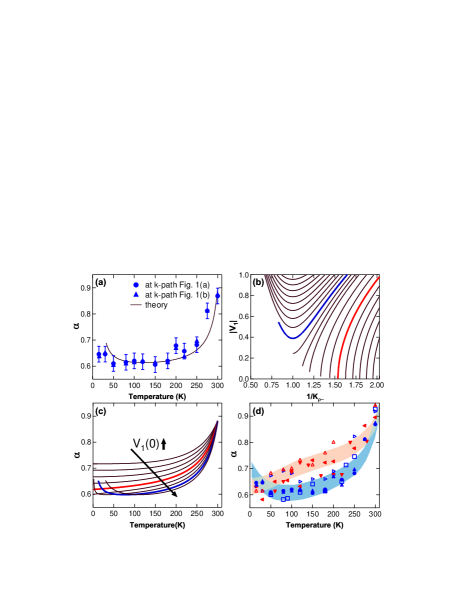
Angle integrated spectra were taken for the same geometries as for Figs. 1(a) and 1(b). Fig. 2(a) shows a set of spectra for selected temperatures, with the inset showing a wide range spectrum for 30 K. All spectra are normalized to the intensity between binding energy 0.2-0.8 eV, which is mainly from bands A and B in Fig. 1. At all T the power law suppression of the near DOS is evident. As T decreases there is much sharpening, a great reduction of the tail above and a strong increase of the curvature. This sharpening is only partly a reduction of thermal broadening. There is also a significant decrease of the power law exponent as we have confirmed and quantified by comparing the experimental spectra with the LL DOS using the finite temperature theory of Ref. Orgad01 . The calculated theory spectra were convolved with a Gaussian with the width set by the instrumental energy resolution , and were scaled as needed because the relative experimental intensities for various T are not well calibrated. As illustrated in Figs. 2(b)-(d) the experimental spectral shape at each T can be very well fit by the theory up to binding energy 0.105 eV, above which the A band weight starts to come in. The value is T-dependent as plotted in Fig. 3(a). Consistent with previous photoemission and tunneling, starts from at room temperature, decreases sharply between K and K, then slows down and saturates at between K. At even lower temperature, there is a slight revival of , as documented in Fig. 2,(b) and (c). Over the whole range, is never less than 0.6. Fig. 3(a) also shows (T) derived from spectra taken with the geometry of Fig. 1(b).
Our interpretation of this (T) behavior, which yields the solid theory curve of Fig. 3(a), flows from the excellent agreement, found here and previously Gweon03 ; Gweon04 , between finite-T LL Orgad01 spectral theory and measured photoemission spectra in the full range of T over which (which itself is very large) renormalizes. Therefore, the most suitable starting point for our calculation is an effective theory based on the LL where T establishes the low-energy cutoff. However, in a single-band spin rotational invariant LL any variation of comes from the renormalization of , the Luttinger parameter in the charged sector through the relation . The driving force of that renormalization may be (i) Umklapp scattering, present only when where is the Fermi vector and is a reciprocal lattice vector or (ii) for an incommensurate system, the interplay of weak disorder and backward scattering, which recouples charge and spin Giamarchi88 . Case (i) is forbidden here because in Li0.9Mo6O17 is incommensurate Whangbo88 . Further, in both cases any temperature change in is necessarily caused by renormalization in the charged sector and so must be correlated with strong transport anomalies in exactly the same range of temperatures. In contrast, we have found that the resistivity for Li0.9Mo6O17 displays a nearly perfect power-law in T for almost one decade footnote . This lack of scaling relation between the spectral and transport exponents suggests that the renormalization process is taking place in a neutral sector. Both our photoemission experiments and band theory calculations Whangbo88 show two bands crossing the Fermi level, which offers a natural origin for such neutral modes as the fluctuations in the difference of density between the two bands . Following the standard bosonization process we can decouple the fixed-point Hamiltonian in the form:
where and are the conjugate bosonic fields, the sound velocities and the Luttinger parameters(/ superposition/difference, / charge/spin density). The and modes can be pictured as the 1D-allowed bosonic excitations into which an interband exciton can decay. Having two extra modes with different velocities, we expect wide ARPES lineshapes as has actually been observed in Li0.9Mo6O17 Gweon03 , and now .
Let us consider now how these critical modes can interact via marginal interactions (those that can renormalize critical exponents). The interactions compatible with the symmetries represent intra and inter-band spin-backscattering and pair-tunneling processes between the two bands. A convenient form in which to write the renormalization group equations is:
| (1) | |||||
| (2) | |||||
| (3) | |||||
| (4) | |||||
| (5) |
represent spin-backscattering process, interband pair-tunneling and .
Since we have restricted ourselves to spin rotational invariant flows, and do not show up explicitly in the equations. The total charge mode () contributes to the total value of but the absence of Umklapp scattering keeps the charged sector independent and free of significant renormalizations, consistent with the T-independence of the resistivity exponent in this range of T, and with the low T saturation value of (T) being greater than 0.6. The lack of commensurability has been confirmed by photoemission and the two band structure calculations available and reinforces the essential role of the neutral mode for (T). The interchain 3D perturbations do not seem to play any important role at these temperatures, the only evidence of the 3D physics being the superconducting transition at 1.8 K Greenblatt84 ; Schlenker85 ; footnote .
We are not interested here in the correlations dominating at T = 0 which have already been studied in detail (see for example Ref. Wu03 and references therein). Rather we focus on the crossover structure at higher temperatures which in Li0.9Mo6O17 has great physical significance due to the large energy range over which the bands crossing have linear dispersion, as pointed out above. Fig. 3(b) shows the result of integrating the RG equations for varying . For and , Eqs. (1) and (2) display literally a Kosterlitz-Thouless KT73 (KT) flow in the charge density difference (), with decoupled gapless excitations for the total spin (). This behavior is not isolated. To be stable in the range of temperature of interest, finite values of and positive values , it is sufficient that . Besides capturing the LL behavior and the instabilities of the two-band system, this KT flow supports simultaneously the correct magnetic (Pauli susceptibility Greenblatt84 ; Choi04 ) and spectral (T dependence of ) phenomenologies. Fig. 3(c) shows the (T) corresponding to the flows of Fig. 3(b). The theory curve of Fig. 3(a) gives a good general description of the data, thus placing Li0.9Mo6O17 in a region of parameters where the RG flow and the (T) can be understood in terms of the KT behavior. i) The downward renormalization of comes from a reduction of the and a simultaneous screening of the V couplings. ii) At small values of and specially, close to the separatrix ending in , the change in is very slow (see Eq. (1)). As a consequence, displays a saturation regime over a large range of intermediate temperatures. iii) The incipient revival of takes place when and at lower temperatures the V’s flow to strong coupling. The revival takes place at the lowest temperatures we could measure so we cannot determine experimentally if it culminates in a gap opening in the sector. If so, that crossover and the eventual gap opening might help to understand the broad anomaly in the specific heat Schlenker85 ; Choi04 that is present in the same range of T.
The proximity of Li0.9Mo6O17 to a separatrix suggests the possibility that both behaviors of (T) seen in Fig. 3(c) might be observed in experiment. As decreases the electronic compressibility increases. Therefore the mode tends to favor phase separation, perhaps nucleated by defects in different parts of the sample. In the first “phase” the reduction of stiffness is large enough to support a revival of . On the other side of the separatrix, the change of is slower and monotonic. In fact, both behaviors may have been observed. Fig. 3(d) plots the (T) measured for 6 different sample surfaces. Each symbol corresponds to one sample except for the data repeated from Fig. 3(a). The solid symbols represent situations where the sample was cleaved at high T and T was then decreased, and the open symbols represents situations where the sample was cleaved at 50 K and T was then increased after quickly visiting the lowest measured T. Despite slight differences from sample to sample, our main finding of a decrease and flattening of with decreasing T is observed robustly in all 6 samples. However, as illustrated by the shadings in the figure, it appears that the samples can be separated into two groups according to the rapidity of the decrease of (T). The (T) of one group decreases faster and flattens at a higher temperature than occurs for the other group. Moreover, the first group tends to show the slight revival of (T) at low temperature while the slower group does not, generally consistent with Fig. 3(c). Any variations seen in individual data sets beyond these general features are deemed to lie within the typical error bars (not shown but like those in Fig. 3(a)). Further work will be needed to fully characterize the two behaviors.
In summary, T-dependent photoemission of Li0.9Mo6O17 shows that the anomalous exponent has a large renormalization with decreasing T, nicely connecting the high and low T values found previously in photoemission and tunneling, respectively. New theory reveals the essential role of neutral charge modes present specifically because there are two bands crossing , the absence of which would make the observed (T) impossible to rationalize with a resistivity T-dependence that shows no exponent renormalization. The possibility of two distinct (T) behaviors, as may have been seen experimentally, is also intrinsic in the theory. This is both the first observation of such a strong T-renormalization of (T) and the first theory of this unexpected behavior. Moreover, the case that Li0.9Mo6O17 is the long sought paradigm of LL behavior in a solid material has thereby been brought to a new level.
Acknowledgements.
This work was supported at UM by the U.S. NSF (DMR-03-02825), at UAM by MEC under a contract RyC, at the ORNL by the U.S. DoE (DE-AC05-00OR22725), at UT by the U.S. NSF (DMR-00-72998), at the SRC by the U.S. NSF (DMR-00-84402).References
- (1) F. D. M. Haldane, J. Phys. C 14, 2585 (1981).
- (2) B. Dardel et al., Phys. Rev. Lett. 67, 3144 (1991).
- (3) E.g., A. Schwartz et al., Phys. Rev. B 58, 1261 (1998); R. Claessen et al., Phys. Rev. Lett. 88, 096402 (2002).
- (4) M.-H. Whangbo and E. Canadell, J. Am. Chem. Soc. 110, 358 (1988).
- (5) M. Greenblatt et al., Solid State Comm. 51, 671 (1984).
- (6) J. Choi et al., Phys. Rev. B 69, 085120 (2004).
- (7) J. D. Denlinger et al., Phys. Rev. Lett. 82, 2540 (1999).
- (8) G.-H. Gweon et al., J. Elec. Spect. Relat. Phenom. 117-118, 481 (2001).
- (9) G.-H. Gweon et al., Physica B 312-313, 584 (2002).
- (10) J. W. Allen, Solid State Comm. 123, 469 (2002).
- (11) Because 0.5 the spinon feature appears as the leading edge in the lineshape. G.-H. Gweon, J.W. Allen, and J.D. Denlinger, Phys. Rev. B 68, 195117 (2003).
- (12) G.-H. Gweon et al., Phys. Rev. B 70, 153103 (2004).
- (13) J. Hager et al., Phys. Rev. Lett. 95, 186402 (2005).
- (14) D. Orgad, Phil. Mag. B 81, 377 (2001).
- (15) T. Giamarchi and H. J. Schulz, Phys. Rev. B 37, 325 (1988).
- (16) Our analysis of resistivity data, e.g. Ref. [6], shows positive and negative power laws above and below 25K, respectively. This behavior will be discussed from the LL viewpoint in a future publication. Early thinking that the resistivity increases below 25K signals a density wave transition has been set aside for lack of any supporting evidence as summarized in Refs. [6, 11, 13].
- (17) C. Schlenker et al., Physica 135B, 511 (1985).
- (18) C. Wu, W. V. Liu, and E. Fradkin, Phys. Rev. B 68, 115104 (2003).
- (19) J. M. Kosterlitz and D. J. Thouless, J. Phys C 6, 1181 (1973).