Valence-Band UPS, 6 Core-Level XPS Photoemission Spectroscopy,
and Low-Energy Electron Diffraction of a Uranium (001) Single Crystal
Abstract
Valence-band ultraviolet photoemission spectroscopy (UPS) at 173K and 6p core-level X-ray photoemission spectroscopy (XPS) at room temperature were performed on a high quality uranium single crystal. Significant agreement is found with first-principles electronic band-structure calculations, using a generalized gradient approximation (GGA). In addition, using Low Energy Electron Diffraction (LEED) for the (001) surface, we find a well-ordered orthorhombic crystallographic structure representative of the bulk material.
pacs:
71.20.Gj, 79.60.-i, 61.14.Hg, 71.27.+aI Introduction
The actinide series of elements and their compounds Schneider22 exhibit unusual but similar properties related to the collective states of their strongly correlated electrons. As one moves across this row of the periodic table, electron-electron correlations increase until, at Am, the 5 electrons localize. Uranium is interesting, since it is believed to be in the normal itinerant (band-structure-like) limit, where correlations may be slightly larger than usual, but do not change the fundamental metallic nature of the material. Nonetheless, there are tantalizing hints (anomalies) that correlations are still playing an important role in this material. For example, the specific heat enhancements are significantly large compared with band-structure calculations (see below), and the phonon spectra is strongly and anomalously softened at high temperatures manley1 . For this reason it is important to explore the experimental electronic structure of U in detail and to compare with band-structure calculations in order to assess exactly how correlated U is with respect to other actinide metals. From a theoretical point of view, the correlations of U, while somewhat strong, may yet be weak enough to be tractable by modern many-body techniques such as dynamical mean-field theory (DMFT) DMFT and may be far easier to understand than more strongly correlated materials like Pu. However, the first step in this process is to establish high-quality photoemission spectra for very good single crystals and compare these results with band-structure calculations in order to provide a reliable baseline for whatever correlations are present. This paper provides preliminary results in this direction.
Uranium, the heaviest natural element, exists in three allotropes and has a complex phonon spectrum manley1 and electronic structure. Unusual properties of uranium also include anisotropic thermal expansion Barrett ; Lloyd ; Lawson , the occurrence of three charge-density wave (CDW) transitions Berlincourt ; Fisher170 ; Nelson1 below 43 K, and strongly temperature-dependent elastic moduli 4 ; McSkimin . Aside from the low-temperature CDW transitions, the ground-state structure for uranium is orthorhombic (-U). Upon heating, -U transforms into a tetragonal structure (Tβ = 935 K) and finally crystallizes to a body-centered cubic phase (Tγ = 1045 K) prior to melting at 1406 K, all at ambient pressure Lawson ; 5 . Many of the unusual properties found in uranium, as with the other light actinides (Th-Pu) 6 , are thought to be related to the delocalization of the partially filled U5f electronic states and their hybridization with the U6d-7s electronic states 7 . The U5f electrons participating in bonding have been shown in uranium intermetallics to exhibit magnetism and superconductivity 8 and show similar bonding behavior to the electrons in lanthanide and transition metals 9 .
Several photoemission experiments have been carried out on uranium Gouder295 ; Gouder341_382Moldtsov ; arko ; Schneider22 . Unfortunately, these experimental studies often suffer from poor spectral resolution caused by either oxygen contamination or the use of samples created by metal deposition upon a substrate. Thin-film deposition studies, although valuable, might not be truly representative of a bulk material. The electronic structure of thin films is influenced by the chemical interaction between the overlayer and the substrate. Using large U single crystals and a thorough sputter-anneal regimen, we have overcome these difficulties.
In this paper we present valence-band photoemission spectra at HeI and HeII energy excitations for a very high-quality single crystal of U at 173K and compare these with the results of first principles calculation of the electronic structure using the generalized gradient approximation approach (GGA) in the full-potential linearized-augmented-plane-wave (FLAPW) method, which includes local 6p orbitals to accommodate the low-lying 6p semicore states Blaha . Using XPS we explore U6p states and note a splitting in the 6p3/2 manifold indicative of a core-valence band separation due to hybridization. The normal-incidence U(001) photoemission spectroscopy and LEED results confirm that our U single-crystal surface shows long-range order and is representative of the bulk.
II Experiment
Single crystals of -U were grown at Argonne National Laboratory by electro-refinement in a molten (LiCl-KCl) eutectic electrolyte containing 3 wt. % UCl3 at 773 K 11 . This procedure grows the crystals directly in the -phase and avoids the formation of high-temperature structures. The crystals (as large as 10101 mm3) collect on a stainless steel cathode as dendrites or thin parallelogram-shaped platelets. To remove any residual salt, the U crystals were cleaned with water and electropolished in H3PO4 prior to the experiment. Chemical analysis reports 40 (atomic) ppm C and 167 (atomic) ppm Si as the only detectable impurities.
Unlike previous U samplesLander43 , these crystals are easily bent, and small cross-section pieces can be deformed by rotating a necked region by hand through several turns without work hardening or weakening. Because these crystals have no grain boundaries and few impurities, we suggest that this unique ductility is the result of a large number of potential twin planes of the orthorhombic structure, and the ability of the twin to move over millimeters Cahn49DanielHuddant . Characterization by X-ray diffraction Laue patterns found no detectable structural imperfections and show that the c–axis is perpendicular to the platelet surface.
In previous resistivity studies Lashley ; Schmiedeshoff single crystals from the same source, the crystals were found to have a residual resistivity ratio of up to 315, eight times higher than previously reported values Berlincourt ; Brodsky . We take the above as evidence that these are the highest quality single -U crystals yet produced, and that they possess extremely low impurity concentration and minimal micro-structural defects.
Ultraviolet photoelectron spectra were recorded with a resolution of 28.5 meV using a Perkin-Elmer/Physical Electronics Model 5600 ESCA system equipped with a monochromated Al K (1486.6 eV), a SPECS UVS 300 ultraviolet lamp (HeI, = 21.21 eV, HeII, = 40.81 eV), and a spherical capacitor analyzer. The vacuum chamber, which had a base pressure of Pa, was equipped with a variable temperature sample stage of the range 150–1273 K. Our crystal surface was aligned perpendicular to the analyzer and set at an acceptance angle of 2 degrees in order to produce greatest sensitivity. Surface preparation for both spectroscopic and LEED measurements consisted of repeated cycles of Ar ion sputtering and annealing at 873 K. After preparation, the oxygen (O1s) and carbon (C1s) signals in the XPS spectra, major contaminant indicators on metallic actinide surfaces, were below the detection limit ( 1 at. %).
III U(001) LEED measurements
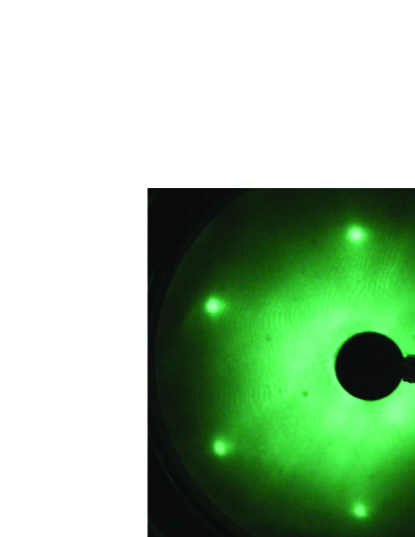
In an effort to determine sample surface quality, we performed Low-Energy Electron Diffraction (LEED) measurements on our samples using an Omicron Spectraleed analyzer with the electron beam at normal incidence. We show in Fig. 1 the first reported LEED of long-range order in a U(001) single crystal surface structure at room temperature with an electron energy of 50 eV. Higher order reciprocal space LEED patterns, up to third order, were clearly visible at greater energies, see inset Fig. 1. We find no evidence of surface reconstruction, and analysis on the bulk termination (1x1) LEED pattern confirms it is consistent (2 % difference) with the diffraction pattern calculated for an orthorhombic U(001) crystallographic structure (a = 2.8537 Å, b = 5.8695 Å, c = 4.9548 Å) at room temperature Barrett .
The quality and character of the sample surface is of critical importance for conducting electron-structure measurements. Due to the strong chemical reactivity of uranium, Ar sputtering was utilized to prepare a clean surface, and confirmed by XPS, prior to each measurement Cardona . We found that the Ar ion sputter damage from cleaning the crystal surface was removed by annealing at 873K for a few minutes and then reducing the temperature to 673 K. After this temperature sequence, the surface re-ordered, and a distinct U(001) diffraction pattern appears.
IV UPS: valence band spectra and DOS calculation
In the past, UPS measurements for most light actinides supplied only a familiar triangle shaped peak close to the Fermi edge Gouder295 ; Gouder341_382Moldtsov ; VealGouder271Laubschat ; McLean . Given our sample quality, alignment, and enhanced resolution we are able to discern more structure in the valence band. An expanded view of our UPS valence band data for -U at T = 173 K is depicted in Fig. 2. The background from inelastic scattering of secondary electrons in the HeI spectra was removed by subtraction of an exponential function from below to the peak of the background. Comparing the HeI and HeII spectra at 173 K, we note that almost all spectral features (peaks) line up in both experimental spectra. The difference in relative intensities between the two spectra has to do with the different cross sections between and states, different escape depths of the excited electrons, and other factors, which we will discuss below.
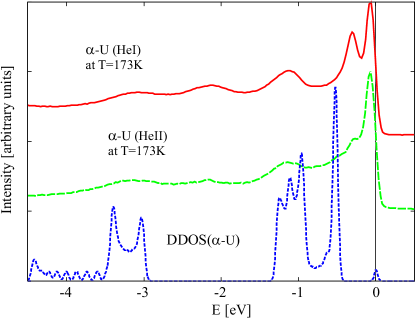
In Fig. 2 we also present results from first-principles GGA WIEN2KBlaha electronic band-structure calculations. The theory is based upon the simple notion that only is conserved, and hence for normal photoemission all electronic states along the direction to Z are present ( is not conserved). Hence, the theoretical curve is a directional density of states (DDOS) as a function of energy , which is calculated from
| (1) |
where is the energy eigenvalue for , band-index , is the Fermi function for electron occupancy, and is the Fermi energy. In this formula we have used a Dirac delta function for the contribution to the DDOS for each band state. Since we have only summed over 21 -points between to Z, it was necessary to broaden the delta function into a finite Gaussian in order to draw a smooth curve. We used a full-width at half max of 28.5 meV for the Gaussian (the instrumental resolution of the experiment). The wiggles between -3.5 to -4.5 eV show the coarseness of our -point grid versus Gaussian width. If we wished to smooth out this part of the DDOS, we could either increase the width of the Gaussian or the number of -points.
Besides spectrometer resolution effects, each eigenvalue -function should actually have a width representative of the lifetime of the hole state (due to radiative and Auger decay). The lifetime, which is of the order of /width, should be increasingly shorter for higher binding energy; a simple free-electron argument would give a Gaussian width for each state of energy E proportional to . Since it is very difficult to calculate hole lifetimes from first principles, we have not included this effect in Fig. 2. The net effect of including lifetimes would be to progressively smear out all the theoretical features as one moved to higher binding energy (below the Fermi energy). This effect is clearly seen in the experimental spectra. Also note that the peaks in the DDOS correspond to flat regions of the energy bands (small dispersion) along to Z (cf. the band states on the right-hand side of Fig. 3).
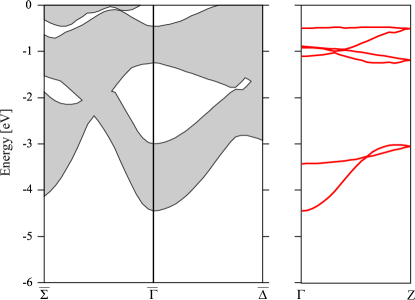
A comparison between the band-structure results and the experimental spectra in Fig. 2 shows favorable agreement for the peaks near -1.2 eV and -3.2 eV. The region between 0 and 1 eV below has mainly -electron character. We expect that these types of states (especially near ) should show the largest effects due to electron-electron correlations that go beyond those included in LDA (or GGA) band-structure calculations. Therefore, we argue that the theoretical peak near -0.6 eV likely corresponds to the experimental peak near -0.3 eV, and that the shift is likely a quasi-particle effect due to these additional electronic correlations. (This effect will be the subject of a forthcoming study in the DMFT framework.) The two remaining peaks (at -0.1 and -2.2 eV) appear at gaps in the conventional band structure (see the left-hand side of Fig. 3), and therefore are likely surface states of mainly and character, respectively.
To understand the relative intensities of the various peaks between the HeI and HeII spectra is somewhat complicated. According to band theory, the peaks in the spectra come from high projected densities of states, which arise from flat regions of the bands (the flatter the bands the sharper the peak). In addition, because of cross section effects (see below), any -electron feature will be enhanced in the HeI spectra and any -electron feature will be enhanced in the HeII spectra. In addition, we estimate that the electronic mean-free path is probably close to its minimum value for the HeII spectra, and hence any surface state will be enhanced relative to bulk states for the HeII spectra. Since both spectra are normalized to the maximum intensity in the Fermi-energy region and not absolute values, only relative peak heights within each spectra have meaning, and we cannot compare absolute values between the two spectra. In addition, as discussed above, peaks at higher binding energy are due to electronic energy states that have much shorter lifetimes (due to radiative decay and Auger mechanisms), which broaden these states and lower the intensity of the peaks.
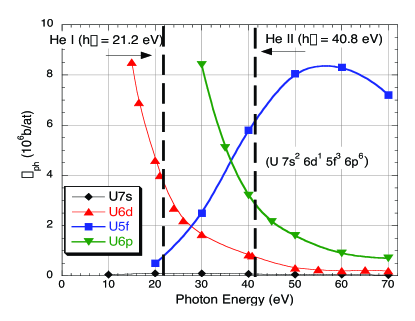
Given the large number of factors in determining the relative height of each peak, only qualitative statements can be made: The peaks below -1.0 eV show up much more prominently in the HeI spectra relative to the HeII spectra, because the electron photoemission is enhanced. This can be seen from the atomic photoionization cross-sections Yeh , which are shown in Fig. 4. Note that the HeI data strongly emphasize the electrons and the HeII data the electrons.
The -0.1 eV peak in the HeII spectra is very enhanced. Because this is likely a -character surface state, there are several possible contributing factors to its strength: First, an -electron surface state will have reduced hybridization and a high one-electron density of states. Surface atoms have a smaller number of near neighbors, which causes a higher local DOS for these atoms. Correlation effects are likely to increase this DOS. Also, the -electron cross sections are very strong for the HeII spectra. Secondly, according to estimates for escape depth as a function of excited electron energy based on the universal curveUniversalCurveRef , we believe that the inelastic mean free path of the excited electrons for the HeII spectra should be near an absolute minimum and should thus be smaller than for the HeI spectra, which should enhance surface state features in the HeII spectrum.
In contrast, the peak at -2.2 eV is likely a surface state with character. Due to the interplay of the photoionization cross-sections, the peak is emphasized in the HeI spectrum and suppressed in the HeII, the latter effect being enhanced by the fact that the spectra are normalized at the maximum intensity.
From our band-structure results for the total DOS at the Fermi energy, we can estimate the effective mass enhancement by comparing to specific-heat measurements. We find to be 0.55, consistent with a previous calculation by Skriver et al. Skriver32 . Our DOS calculation is similar to those previously computed for -U by Wills and Eriksson Wills , and Pénicaud Penicaud . There are two general contributions to the effective-mass enhancement: electron-phonon and electron-electron. A many-body theory that is beyond the scope of this paper would be required to sort out the relative contributions.
V X-ray photoemission spectroscopy and U6p electron bands
Figure 5 shows a comparison of U6p1/2–6p3/2 XPS spectra at room temperature, a theoretical -U DOS (T = 0 K) calculation, and XPS data for Pu6p1/2–6p3/2 previously reported by Tobin et al. Tobin . We note that the spin-orbit splitting ( 9.5 eV) between U 6p1/2–6p3/2 data corresponds well with the DOS calculation. The broadness of the peak at 27 eV is due to a combination of thermal broadening and the considerable quasi-particle lifetime effects for states so far below EF. Much theoretical work Singh ; kunes ; Nordstrom has been done evaluating the 6p states in the light actinides to model accurately spin-orbit coupling. In comparison with data of other actinide metals, a spin-orbit splitting of similar order has been observed in Th by Fuggle et al. Fuggle4 , as well as in the theoretical calculation by Kuneš et al. kunes , and in the Pu data Tobin .
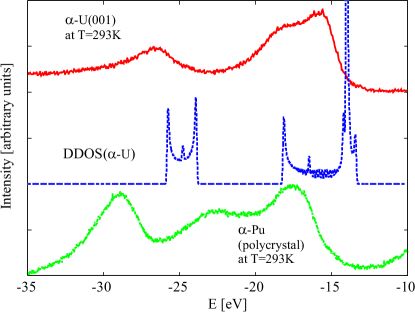
We note that a shoulder emerges on the left side of the U6p3/2 data peak (18.6 eV) in Fig. 5, which show the hybridization features of this band-like shallow core state. This new observation may be directly attributed to the purity of our -U single crystal with minimum strain and low-impurity concentrations. Previous XPS experiments on uranium thin film Fuggle4 and polycrystal McLean samples fail to indicate this shoulder in the U6p3/2 peak intensity at 18.6 eV as shown in our single crystal data. Comparison with the DOS calculation indicates a clear splitting of the U6p3/2 over a similar energy range as seen in the U data. Normally, one expects the U6p electrons more than 15 eV away from the Fermi edge (EF) to exhibit exclusively core-like behaviors. However, the splitting of the U data peak and confirmation via calculation lead us to speculate certain electrons may hybridize. Hybridization between 6p and 6d electrons is allowed via j-j coupling and is supported by applicable symmetry rules.Nunes Studies involving density functional theory (DFT) Ermler ; Hay argue persuasively to include U6p electrons in the valence band, and the clear overlap of radial distribution functions for light actinides may increase the likelihood of such hybridization Batista . Thus our data may constitute the first experimental evidence for such 6p and 6d hybridization in the condensed phase of actinide metals.
Although no experimental evidence of the Th6p3/2 electron splitting is currently available, Kuneš et al. kunes have calculated this using a similar GGA FLAPW approach. This calculation unambiguously shows Th6p3/2 peak splitting over a 2 eV energy interval. Evidence of a similar 6p3/2 splitting is visible in the Pu data Tobin .
In order to exclude the possibility that the observed splitting of the U6p1/2–6p3/2 peaks is the result of surface reconstruction, relaxation, or contamination effect, an oxidized U(001) sample surface was cleaned in stages via Ar sputtering and analyzed with HRES–XPS. As the O1s (531 eV) peak was eliminated, the oxide (UxOy) peaks associated with the valence band (-29 and -24.5 eV) simultaneously dissipated. As sputtering continued the 6p1/2 and 6p3/2 peaks emerge at -26.8 and -17.0 eV. These remain when the sample is annealed up to 873 K in order to reorder the surface atoms, and surface impurity is below detectability. From this result we conclude that the U6p1/2 - 6p3/2 photoemission measurements are representative of the bulk and preclude any anomalous surface reconstruction effect. Subsequent experiments on other high-quality polycrystal U indicate that the shoulder on the U6p3/2 data peak and the U6p1/2–6p3/2 spin-orbit splitting remain at 9.5 eV up to 1100 K.
VI Conclusions
In this paper we present the first U(001) LEED pattern corresponding to long-range order in a uranium single-crystal surface. We report favorable agreement between first-principles GGA band structure calculations and the valence band UPS data. We also identify peaks which likely correspond to surface states present in the gaps of the conventional band structure, at normal incidence on the U(001) plane. We note that at the higher binding energies 13–30 eV using XPS, the GGA band structure correctly predicts the behavior of the U6p1/2–6p3/2 core states, showing both the spin-orbit splitting (9.5 eV) and hybridization effects.
To our knowledge, with the exception of the recent EXAFS studies Nelson1 , single crystals of this quality have not been previously utilized for surface spectroscopy, and because of their purity, the photoemission results show many more features than previous experiments, providing new insight into the electronic-structure of -U. Angle-resolved photoemission spectroscopy (ARPES) experiments are currently underway to map the band structure of these -U single crystals. ARPES measurements are required to study the bands’ dispersion, and will allow for a detailed comparison with first-principle GGA band structure calculations. To minimize the spectrum contamination due to surface-state effects, the ongoing ARPES experiments are being performed at HeI photon energy. Finally, these ARPES measurements will also help study the character of the features which were tentatively identified as surface states in the present study.
Acknowledgements.
This work was supported in part by the LDRD program at Los Alamos National Laboratory. We gratefully acknowledge the contribution of the U(001) samples from: H. F. McFarlane, K. M. Goff, F. S. Felicione, C. C. Dwight, D. B. Barber, C. C. McPheeters, E. C. Gay, E. J. Karell and J. P. Ackerman at Argonne National Laboratory. B.M. acknowledges help from M. D. Jones and I. Schnell in getting acquainted with the WIEN2K package.References
- (1) W. D. Schneider and C. Laubschat, Phys. Rev. B 23, 997 (1981).
- (2) M. E. Manley, B. Fultz, R. J. McQueeney, C. M. Brown, W. L. Hults, J. L. Smith, D. J. Thoma, R. Osborn, and J. L. Robertson, Phys. Rev. Lett. 86, 3076 (2001).
- (3) A. Georges, G. Kotliar, W. Krauth, and M.J. Rozenberg, Rev. Mod. Phys. 68, 13 (1996).
- (4) C. S. Barrett, M. H. Mueller, and R. L. Hitterman, Phys. Rev. 129, 625 (1963).
- (5) L. T. Lloyd and C. S. Barrett, J. Nucl. Mater. 18, 55 (1966).
- (6) A. C. Lawson, C. E. Olsen, J. W. Richardson Jr., M. H. Mueller, G. H. Lander, Acta Crystallogr. B 44, 89 (1988).
- (7) T. G. Berlincourt, Phys. Rev. 114, 969 (1959).
- (8) G. M. Schmiedeshoff, D. Dulguerova, J. Quan, S. Touton, C. H. Mielke, Philos. Mag. 84, 2001 (2004).
- (9) H. J. McSkimin and E. S. Fisher, J. Appl. Phys. 31, 1627 (1960).
- (10) E. S. Fisher and D. Dever, Phys. Rev. 170, 607 (1968); L. Fast, O. Eriksson, B. Johansson, J. M. Wills, G. Straub, H. Roeder and L. Nordström, Phys. Rev. Lett. 81, 2978 (1998).
- (11) E. S. Fisher and H. J. McSkimin, Phys. Rev. 124, 67 (1961); E. S. Fisher, J. Nucl. Mater. 18, 39 (1966); P. Söderlind, Phys. Rev. B 66, 085113 (2002).
- (12) J. Donahue, in The Structure of the Elements (Wiley, New York, 1974); R. W. G. Wyckoff, in Crystal Structures (Wiley, New York, 1963); J. D. Axe, G. Grübel, and G. H. Lander, J. Alloys Compd. 213-214, 262 (1994).
- (13) P. Söderlind, O. Eriksson, B. Johansson, J. M. Wills, A. M. Boring, Nature (London) 374, 524 (1995).
- (14) E. A. Kmetko and H. H. Hill, in Plutonium 70, ed. W. N. Miner, p. 233 (AIME, New York, 1970); B. Johansson and H. L. Skriver, J. Magn. Magn. Mater. 29, 217 (1982).
- (15) Z. Fisk, H.R. Ott, T.M. Rice, and J.L. Smith, Nature (London) 320, 124 (1986); Z. Fisk, D.W. Hess, C. J. Pethick, D. Pines, J.L. Smith, J.D. Thompson and J.O. Willis, Science 239, 33 (1988); A. de Visser and J.J.M. Franse, J. Magn. Magn. Mater. 100, 204 (1991); S. S. Saxena, P. Agarwal, K. Ahilan, F. M. Grosche, R. K. W. Haselwimmer, M. J. Steiner, R. Pugh, I. R. Walker, S. R. Julian, P. Monthoux, G. G. Lonzarich, A. Huxley, I. Sheikin, D. Braithwaite, and J. Flouquet, Nature (London) 406, 587 (2000).
- (16) B. Johansson, Phys. Rev. B 11, 2740 (1975).
- (17) T. Gouder and C. A. Colmenares, Surf. Sci. 295, 241 (1993).
- (18) T. H. Gouder and C. A. Colmenares, Surf. Sci. 341, 51 (1995); T. Gouder, Surf. Sci. 382, 26 (1997); S. L. Molodtsov, S. V. Halilov, M. Richter, A. Zangwill and C. Laubschat, Phys. Rev. Lett. 87, 017601 (2001).
- (19) A. J. Arko, J. J. Joyce, L. Morales, J. Wills, J. Lashley, F. Wastin and J. Rebizant, Phys. Rev. B 62, 1773 (2000).
- (20) H. F. McFarlane, K. M. Goff, F. S. Felicione, C. C. Dwight and D. B. Barber, J. Met. 49, 14 (1997). C. C. McPheeters, E. C. Gay, E. J. Karell and J. P. Ackerman, J. Met. 49, 22 (1997).
- (21) G. H. Lander, E. S. Fisher, and S. D. Bader, Adv. Phys. 43, 1 (1994).
- (22) R. W. Cahn, Acta Metall. 1, 49 (1953); J. S. Daniel, B. Lesage, and P. Lacombe, Acta Metall. 19, 163 (1971); J. Huddart, J. Harding, and P. A. Bleasdale, J. Nucl. Mater. 89, 316 (1980).
- (23) J. C. Lashley, B. E. Lang, J. Boerio-Goates, B. F. Woodfield, G. M. Schmiedeshoff, E. C. Gay, C. C. McPheeters, D. J. Thoma, W. L. Hults, J. C. Cooley, R. J. Hanrahan, Jr. and J. L. Smith, Phys. Rev. B 63, 224510 (2001).
- (24) M. B. Brodsky, N. J. Griffin, and M. D. Odie, J. Appl. Phys. 40, 895 (1969).
- (25) M. Cardona and L. Ley, in Photoemission in Solids, Vol. 26, Topics in Applied Physics, Eds. M. Cardona and L. Ley (Springer-Verlag, Berlin, 1978), p. 57-60.
- (26) A. C. Nunes, Phys. Rev. B 35, 7174 (1987).
- (27) B. W. Veal and D. J. Lam, Phys. Rev. B 10, 4902 (1974); T. Gouder, J. Alloys Compd. 271-273, 841 (1998); C. Laubschat, J. Elect. Spectrosc. Relat. Phenom. 96, 127 (1998).
- (28) W. McLean, C. A. Colmenares, R. L. Smith, G. A. Somorjai Phys. Rev. B 25, 8 (1982).
- (29) J. J. Yeh, in Atomic Calculation of Photoionization Cross-Sections and Asymmetry Parameters, (Gordon and Breach, Langhorne, PA 1993).
- (30) M. P. Seah and W. A. Dench, Surf. Interface Anal., 1, 2 (1979).
- (31) J. M. Wills and O. Eriksson, Phys. Rev. B 45, 13879 (1992).
- (32) M. Pénicaud, J. Phys.: Condens. Matter 12, 5819 (2000).
- (33) P. Blaha, K. Schwarz, G. K. M. Madsen, D. Kvasnicak and J. Luitz, WIEN2k, An Augmented Plane Wave Plus Local Orbitals Program for Calculating Crystal Properties (Karlheinz Schwarz, Technische Universität Wien, Austria, 2001).
- (34) H. L. Skriver and I. Mertig, Phys. Rev. B 32, 4431 (1985).
- (35) J. G. Tobin, B. W. Chung, R. K. Schulze, J. Terry, J. D. Farr, D. K. Shuh, K. Heinzelman, E. Rotenberg, G. D. Waddill and G. van der Laan, Phys. Rev. B 68, 155109 (2003).
- (36) D. J. Singh, Planewaves, Pseudopotentials and the LAPW Method (Kluwer Academic, Dordrecht, 1994); M. D. Jones, J. C. Boettger, R. C. Albers and D. J. Singh, Phys. Rev. B 61, 4644 (2000).
- (37) L. Nordström, J. M. Wills, P. H. Andersson, P. Söderlind, and O. Eriksson Phys. Rev. B 63, 035103 (2000).
- (38) J. Kuneš, P. Novák, R. Schmid, P. Blaha and K. Schwarz, Phys. Rev. B 64, 153102 (2001).
- (39) J. C. Fuggle, A. F. Burr, L. M. Watson, D. J. Fabian and W. Lang, J. Phys. F, 4, 335 (1974).
- (40) W. C. Ermler, R. B. Ross, and P. A. Christiansen, Int. J. Quantum Chem. 40, 829 (1991).
- (41) P. J. Hay and R. L. Martin, J. Chem. Phys. 109, 3875 (1998).
- (42) E. R. Batista, R. L. Martin, P. J. Hay, J. E. Peralta and G. E. Scuseria, J. Chem. Phys. 121, 2144 (2004).
- (43) E. J. Nelson, P. G. Allen, K. J. Blobaum, M. A. Wall, and C. H. Booth Phys. Rev. B 71, 184113 (2005).