Molecular orientational dynamics of the endohedral fullerene Sc3N@C80 as probed by 13C and 45Sc NMR
Abstract
We measure 13C and 45Sc NMR lineshapes and spin-lattice relaxation times (T1) to probe the orientational dynamics of the endohedral metallofullerene Sc3N@C80. The measurements show an activated behavior for molecular reorientations over the full temperature range with a similar behavior for the temperature dependence of the 13C and 45Sc data. Combined with spectral data from Magic Angle Spinning (MAS) NMR, the measurements can be interpreted to mean the motion of the encapsulated Sc3N molecule is independent of that of the C80 cage, although this requires the similar temperature dependence of the 13C and 45Sc spin-lattice relaxation times to be coincidental. For the Sc3N to be fixed to the C80 cage, one must overcome the symmetry breaking effect this has on the Sc3N@C80 system since this would result in more than the observed two 13C lines.
pacs:
76.60.-k 61.48.+cI Introduction
The enclosure of molecules within the carbon cages of fullerenes promises to add yet more richness to the array of possibilities associated with fullerene chemistry. To date, a limiting factor in the investigations of such materials has been the inability to synthesize them in macroscopic quantities. Exceptions to this rule include molecules made using the trimetallic nitride template (TNT) synthesis method,Stevenson et al. (1999) which can produce tens of milligrams of material of the form M3N@C80, where M is a metal atom (including Sc, Y, and many Lanthanides). The C80 molecular cage enclosing the M3N complex has icosahedral symmetry and is stable only because of charge transfer from the nitride cluster within.
Experiments on the prototypical fullerene C60 have revealed orientational dynamics of the molecules in the solid state. For example, x-ray diffraction and calorimetry showed a transition from orientational disorder to order around 250 K.Heiney et al. (1991) NMR measurements confirmed a sharp change in behavior at this temperature but continued to indicate rapid molecular reorientations even at temperatures below this transition.Tycko et al. (1991); Johnson et al. (1992); Pennington and Stenger (1996) NMR investigators concluded that a snapshot of the sub-250 K structure would reveal orientational order, but the molecules would make discrete orientational “jumps” with a characteristic correlation time dependent on temperature. This was named the “ratchet” phase, and the high-temperature phase was called the “rotator” phase. One might expect such phases to exist in M3N@C80 as well because the C80 cage has icosahedral symmetry identical to that of C60.
We report results of 13C and 45Sc NMR as probes of the molecular orientational dynamics of Sc3N@C80 and compare and contrast with C60. Our measurements reveal no sign of the rotator/ratchet transition found in C60 but instead show an activated behavior for molecular reorientations over the full temperature range from 20 K – 330 K. The spin-lattice relaxation times (T1) for both 13C and 45Sc display similar temperature behavior, with a minimum between 100 K and 200 K, suggesting a similar physical cause for their motion. We also report Magic Angle Spinning (MAS) NMR spectra for 13C at lower temperature that show only two carbon lines (proving the icosahedral symmetry of the C80 cage), although the lines broaden somewhat as the temperature decreases which may be indicative of a loss of spherical symmetry. Taking all of these data together along with previous experimental and theoretical results, one may conclude that the endohedral Sc3N is not fixed to the C80 cage on the time scale of the NMR experiments, although this would require the similar temperature dependence for the 13C and 45Sc spin-lattice relaxation times to be a coincidence. To argue that the Sc3N is fixed to the C80 cage, one must overcome the fact that this breaks the spherical symmetry of the cage and therefore should produce more carbon lines than just the two we observe.
II Experimental
The procedure for preparation of Sc3N@C80 by the group at the University of Southern MississippiStevenson et al. (1999) and the MAS NMR apparatus of the Tallinn groupSamoson et al. (2004) have been described elsewhere. The non-MAS NMR measurements at The Ohio State University were carried out at a magnetic field strength of 8.8 T utilizing a home-built spectrometer. Spectra for 13C and 45Sc were obtained via Fourier Transform of spin-echo signals. The spin-lattice relaxation times were measured with the saturation recovery technique utilizing 200 pulses to obliterate the magnetization.
III Results
Spectra for 13C (shown in Fig. 1 for three different temperatures) reveal dynamical behavior of the C80: at high temperature, the cages undergo rapid reorientational motion that causes motional narrowing of the line, and this motion freezes out as the temperature is lowered. In the high-temperature regime (T = 132 K in Fig. 1), the spectrum shows a peak and a distinct shoulder. A fit at this temperature yields two lines at 155 ppm and 147 ppm with intensities in the ratio of 3:1. These data agree with previous solution NMR results,Stevenson et al. (1999) although the line positions reported here are approximately 10 ppm higher than in Ref. Stevenson et al., 1999. Part of this discrepancy results from a slight temperature dependence to the line positions (see MAS data below); as to the remainder, we have no definitive explanation but speculate a C80-solvent interaction in the solution NMR might be responsible. Moving to the low temperature region (T = 30 K in Fig. 1), we find a chemical shift anisotropy (CSA) powder pattern with features indicating principal values of the chemical shift tensor of 220 ppm, 180 ppm, and 30 ppm (measured relative to TMS = tetramethyl silane), values not significantly different from those reported for C60.Tycko et al. (1991); Yannoni et al. (1991) At intermediate temperatures (T = 84 K in Fig. 1), a superposition of the high- and low-temperature spectra occurs.

The 45Sc spectral data (Fig. 2) show the same motional narrowing behavior as do the 13C data. The spectrum for 45Sc (spin 7/2) is richer than that of 13C (spin 1/2) because 45Sc has a nuclear electric quadrupole moment Q = 0.22 x 10⁻²⁴ cm2 which interacts with the local electric field gradient (EFG) at the nuclear site. At low temperature (T = 65 K) we observed a full first order quadrupole powder patternSlichter (1992); Cohen and Reif (1957) characterized by asymmetry parameter 0 and electric field gradient parameter e2qQ/h 67.9 MHz. At higher temperatures the powder pattern is motionally narrowed, and only one peak is observed with linewidth of order tens of kHz. This motional narrowing demonstrates molecular reorientation on a time scale shorter than 0.1 s.

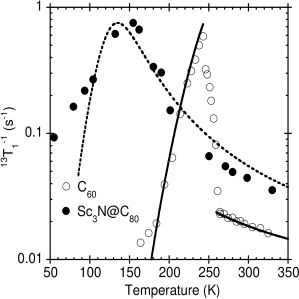
Measurements of spin-lattice relaxation times (T1) for 13C and 45Sc also reveal information about molecular dynamics. Fig. 3 plots the 13C spin-lattice relaxation rate 1/T1 versus temperature for Sc3N@C80, and for comparison we also show the same data for C60 as reported by Tycko et al.Tycko et al. (1991) The lines through the data in Fig. 3 are fits that we shall describe below. There is a notable qualitative difference between the T1 behaviors of C60 and Sc3N@C80: the C60 data show an abrupt change in behavior near 250 K, corresponding to the reported phase transition temperature,Heiney et al. (1991) while the Sc3N@C80 behavior is relatively smooth throughout the measured temperature range. Fig. 4 shows the 45Sc spin-lattice relaxation rate for Sc3N@C80 along with that for 13C; fits to these data (see below) are also included. Note that the units for the 45Sc data are s-1, while those for 13C are s-1: the 45Sc relaxation rate is almost six orders of magnitude faster than the 13C rate. The reason for this enormous difference is that the 45Sc relaxation is dominated by EFG fluctuations which are far more effective than the CSA mechanism.

To further elucidate the orientational dynamics of the molecules, we measured 13C spectra using Magic Angle Spinning (MAS) NMR in order to remove the line broadening due to the chemical shift anisotropy at low temperature. These data are shown in Fig. 5. Several clarifications are in order here. First, the MAS linewidths are much smaller than for the motionally-narrowed lines in Fig. 1. The broader lines of Fig. 1 simply reflect the field inhomogeneity of the magnet used to obtain those data. Second, one may note that more than two lines are present in the MAS data. This occurs because as-produced Sc3N@C80 is a mixture of two isomers: the primary isomer has Ih symmetry, yielding two carbon lines, and the second, minor isomer (roughly 10%) has D5h symmetry, leading to six carbon lines.Duchamp et al. (2003) The lines associated with each isomer are labeled in Fig. 5(a). The data of Fig. 1 do not show the presence of the minor isomer due to the line broadening mentioned previously for those data. From this point, we shall only focus on the primary isomer with Ih symmetry. Finally, the line positions have a modest temperature dependence of unknown origin. This temperature dependence partially explains the discrepancy between our NMR data and the previous solution NMR result.

IV Analysis
To analyze our data quantitatively, we follow the approach Tycko et al. used to analyze their 13C data in C60.Tycko et al. (1991) They used a model in which the spin-lattice relaxation results from fluctuating effective magnetic fields, transverse to the applied field, produced from the anisotropic chemical shift mechanism and modulated in time by molecular reorientations. They further assumed an exponential autocorrelation function to describe the time dependence of these fluctuations, with a correlation time . Such a model gives the following expression for T1:Tycko et al. (1991)
| (1) |
where is the Larmor frequency, and characterizes the mean square strength of the field fluctuations (which we address below). This expression leads to the well known T1 minimum when = 1.Slichter (1992); Bloembergen et al. (1948) In terms of these parameters, 1/T = . Finally, Tycko et al. assumed an activated temperature dependence for . These assumptions lead to the following expression for the spin-lattice relaxation rate:Tycko et al. (1991)
| (2) |
where Ea is the activation energy, kB is the Boltzmann constant, and T is the temperature. Tycko et al. found that this model could not describe their C60 data over the full temperature range. Instead they required separate sets of parameters T, Tmin, and Ea for the regions above and below 250 K. The parameters for their fits are listed in Table 1. Note that in fitting the high-temperature data, they constrained the value of T on physical grounds to be equal to the low-temperature value. The resulting fits are shown in Fig. 3.
| T | Tmin | Ea/kB | |
|---|---|---|---|
| C60 (T 250 K) | 0.806 s | 268 K | 2900 K |
| C60 (T 250 K) | 0.806 s | 74.6 K | 487 K |
| 13C in Sc3N@C80 | 1.33 s | 135 K | 811 K |
| 45Sc in Sc3N@C80 | 4.0 s | 135 K | 811 K |
In contrast to C60, our T1 results for Sc3N@C80 follow reasonably well a single pattern of activated behavior over the full temperature range. Also shown in Fig. 3 is a fit to our 13C data using Eq. 2, with the parameters given in Table 1. The activation energy 811 K is not too far from the high temperature phase activation energy (487 K) found for C60, suggesting behavior more nearly like the high temperature “rotator” phase. At lower temperatures the 13C spin-lattice relaxation rate systematically exceeds the fit, perhaps suggesting the emergence of some other relaxation mechanism. At our resonance frequency = 94 MHz and using the values of T = 1.33 s and Tmin = 135 K from the fit, we are able to estimate a correlation time of 1.7 ns at that temperature and 62 ps at T = 300 K, some 5 times longer than the corresponding estimate for C60.Tycko et al. (1991)
We can utilize our chemical shift data to provide a consistency check for the model by estimating T from the expression 1/T = . Johnson et al.Johnson et al. (1992) showed that for the assumed CSA relaxation mechanism, the phenomenological parameter , with , , and . The are the chemical shift tensor components with . Our shift values give x , and from this we estimate T 0.85 s. This value is comparable to the experimentally measured number, although it is unclear why this estimate is shorter than the measured value.
We have also applied the model of Tycko et al. to our 45Sc data, although in this case the relaxation is due to fluctuations of the electric field gradient brought about by molecular reorientations. Like 13C, the scandium relaxation rate reaches a T at temperatures between 100 K and 200 K, although for 45Sc, T is too small to be measured. Overall there is impressive similarity between the 13C and 45Sc data. Two fits are also given in Fig. 4. For the 13C data we apply a fit identical to that shown in Fig. 3, based on Eq. 2 and employing the parameters in Table 1. In order to emphasize the similarity of the 45Sc and 13C data, we also fit the 45Sc data to the form of Eq. 2, using the values for Ea/kB and Tmin taken from the 13C fit and allowing only T as an adjustable parameter. Note that the resonance frequencies of 45Sc and 13C are only different. The resulting fit tracks the 45Sc data remarkably well with T = 4.0 s.
As a check on our approach to the 45Sc data, we consider the magnitude of the relaxation rate. For a spin-I nucleus experiencing EFG fluctuations in the fast correlation time limit appropriate for the room temperature data well above Tmin, the relaxation for isotropic reorientational motion with correlation time (with asymmetry parameter ) is given by:Abragam (1961)
| (3) |
From the room temperature correlation time estimated above as 62 ps and the measured e2qQ/h = 67.9 MHz, the calculated rate is 0.12 s-1, some seven times the measured rate of 0.018 s-1. This discrepancy may indicate the motion of the Sc3N is restricted rather than isotropic.
V Is the Sc3N bound to the C80 cage?
The remaining issue is the bonding relation between the C80 cage and the Sc3N inside. In principle, our data should be able to address this since we have one probe (13C) of the C80 cage and another probe (45Sc) of the Sc3N. However, no definitive and satisfying answer is forthcoming.
The previous experimental and theoretical results can be summarized as follows. Raman/IR experiments show additional phonons that point to a reduced symmetry for the Sc3N@C80 molecule at both 80 K and 300 K, suggesting the Sc3N is fixed to the C80 cage.Krause et al. (2001) The solution NMR observationStevenson et al. (1999) of two carbon lines with a 3:1 intensity ratio requires a C80 cage with Ih symmetry: that result precisely matches what one expects for C80 with Ih symmetry, since that cage has 60 corannulene carbons (at the junction of a five-membered ring and two six-membered rings) and 20 pyrene carbons (at the junction of three six-membered rings). The other isomers of C80, being of lower symmetry, have more than two distinct carbon sites, which would yield carbon spectra with more than two lines and intensity ratios of no more than 2:1 for any set of lines.Sun and Kertesz (2000) Theoretical calculations for the energy barrier for motion of the Sc3N inside the C80 cage found a value of 0.144 eV, yielding a characteristic time scale for the motion of 1.53 ps at 575 K.Vietze and Seifert (2002) Based on their calculations and on these two experimental results, Vietze and Seifert ascribed the discrepancy between the solution NMR and Raman/IR results to the time scales for the two experiments. According to this explanation, since the typical Raman/IR time scale ps is faster than the Sc3N motion, that experiment saw the instantaneous position of the Sc3N and thus a lack of spherical symmetry. Because the solution NMR time scale ns is much slower than the Sc3N motion, that experiment only found an average position for the Sc3N, thus creating the appearance of Ih symmetry.
We consider the data reported here in the context of this picture. The 13C spectra (both MAS and non-MAS) consisting of two lines in a 3:1 ratio can only derive from a C80 cage with Ih symmetry, meaning the Sc3N cannot be fixed to the C80 cage on the NMR time scale. This is consistent with the above ideas. We would then interpret the line broadening observed at low temperature by MAS as the loss of spherical symmetry of the Sc3N@C80 system due to the cessation of motion of the Sc3N. The 13C and 45Sc relaxation rates both have similar temperature behavior, each displaying T1 minima between 100 K and 200 K, and in fact we can fit both sets of data with identical activation energies. This would most simply be explained by a single physical mechanism as the cause of the motion of both the C80 cage and the Sc3N, which would seem to require they be bound together. If, however, we require the C80 cage and the Sc3N not be bound together, we must then conclude that the similar T1 behavior is sheer coincidence. While we cannot rule this out, it would seem to require a remarkable set of circumstances to conspire to bring this about. To argue the opposite position, that the C80 cage and the Sc3N are fixed together, one must overcome the symmetry breaking effect of the bonding of the Sc3N to the C80 cage: the loss of spherical symmetry would lead to more than two carbon lines, contrary to our observation. The line broadening observed in the MAS data may be indicating such a loss of symmetry, but that remains speculative.
Acknowledgements.
J. A. Martindale thanks P. C. Hammel, P. Wigen, and M. Boss for beneficial discussions. S. Stevenson acknowledges funding from the NSF EPSCOR and NSF CAREER Grant CHE 0547988. I. Heinmaa and R. Stern acknowledge support from the Estonian Science Foundation.References
- Stevenson et al. (1999) S. Stevenson, G. Rice, T. Glass, K. Harich, F. Cromer, M. R. Jordan, J. Craft, E. Hadju, R. Bible, M. M. Olmstead, et al., Nature 401, 55 (1999).
- Heiney et al. (1991) P. A. Heiney, J. E. Fischer, A. R. McGhie, W. J. Romanow, A. M. Denenstein, J. P. McCauley, Jr., and A. B. Smith III, Phys. Rev. Lett. 66, 2911 (1991).
- Tycko et al. (1991) R. Tycko, G. Dabbagh, R. M. Fleming, R. C. Haddon, A. V. Makhija, and S. M. Zahurak, Phys. Rev. Lett. 67, 1886 (1991).
- Johnson et al. (1992) R. D. Johnson, C. S. Yannoni, H. C. Dorn, J. R. Salem, and D. S. Bethune, Science 255, 1235 (1992).
- Pennington and Stenger (1996) C. H. Pennington and V. A. Stenger, Rev. Mod. Phys. 68, 855 (1996).
- Samoson et al. (2004) A. Samoson, T. Tuherm, J. Past, A. Reinhold, T. Anupold, and I. Heinmaa, Top. Curr. Chem. 246, 15 (2004).
- Yannoni et al. (1991) C. S. Yannoni, R. D. Johnson, G. Meijer, D. S. Bethune, and J. R. Salem, J. Phys. Chem. 95, 9 (1991).
- Slichter (1992) C. P. Slichter, Principles of Magnetic Resonance (Springer-Verlag, New York, 1992).
- Cohen and Reif (1957) M. H. Cohen and F. Reif, in Solid State Physics, edited by F. Seitz and D. Turnbull (Academic Press, New York, 1957), p. 321.
- Duchamp et al. (2003) J. C. Duchamp, A. Demortier, K. R. Fletcher, D. Dorn, E. B. Iezzi, T. Glass, and H. C. Dorn, Chem. Phys. Lett. 375, 655 (2003).
- Bloembergen et al. (1948) N. Bloembergen, E. M. Purcell, and R. V. Pound, Phys. Rev. 73, 679 (1948).
- Abragam (1961) A. Abragam, Principles of Nuclear Magnetism (Oxford University Press, New York, 1961), p. 314.
- Krause et al. (2001) M. Krause, H. Kuzmany, P. Georgi, L. Dunsch, K. Vietze, and G. Seifert, J. Chem. Phys. 115, 6596 (2001).
- Sun and Kertesz (2000) G. Sun and M. Kertesz, Chem. Phys. Lett. 328, 387 (2000).
- Vietze and Seifert (2002) K. Vietze and G. Seifert, in Structural and Electronic Properties of Molecular Nanostructures, edited by H. Kuzmany, G. Fink, and M. Mehring (Springer, Secaucus, NJ, 2002), p. 39.