Also at: ]Theoretical Physics Department, Kostroma State University, 156961 Kostroma, Russia.
Experimental time-resolved photoemission and ab initio study
of lifetimes of excited electrons in Mo and Rh
Abstract
We have studied the relaxation dynamics of optically excited electrons in molybdenum and rhodium by means of time resolved two-photon photoemission spectroscopy (TR-2PPE) and ab initio electron self-energy calculations performed within the and approximations. Both theoretical approaches reproduce qualitatively the experimentally observed trends and differences in the lifetimes of excited electrons in molybdenum and rhodium. For excitation energies exceeding the Fermi energy by more than 1 eV, the theory yields lifetimes in quantitative agreement with the experimental results. As one of the relevant mechanisms causing different excited state lifetime in Mo and Rh we identify the occupation of the 4 bands. An increasing occupation of the 4 bands results in an efficient decrease of the lifetime even for rather small excitation energies of a few 100 meV.
pacs:
71.15.-m, 78.47.+p, 79.60.-iI Introduction
The dynamics of excited electrons play an important role for many physical and chemical phenomena. Detailed knowledge of relaxation times of excited electrons is substantial for the interpretation of photoemission spectra, surface chemistry data and low-energy electron diffraction data. For instance, the relaxation time determines the inelastic electron mean free path, and hence the escape depth length of the applied surface analytical technique.Penn Particular in the optical excitation regime () experimental data are very rare due to the limited experimental access to this energy regime. Therefore, the knowledge of hot-electron lifetimes is still far from being complete. Among experimental methods developed for such studies one of the most suitable is the technique of time-resolved two-photon photoemission spectroscopy (TR-2PPE), which enables lifetime measurements directly in time domain at a temporal resolution of a few femtosecondsAesc96 . In the last decade several TR-2PPE experiments have been performed for simple metals Bauer and noble metals, Schm94 ; Hert96 ; Ogaw97 ; Knoes98 ; Caoo98 ferromagnetic 3 metals (Fe, Co, and Ni), Aesc97 ; Knorr00 and high- superconductors Ness98 . Of the paramagnetic transition metals, the electron lifetimes have been measured only for the 5-metal tantalum.Aesch04 . However, so far, no systematic experimental studies within the 4 and 5-transition metal series have been undertaken.
Theoretical calculations of excited electron lifetimes have been performed in the past within the approximation (GWA) for electron self-energy for bulk noble Ech00 ; Zhuk01 ; Chu06 and 4 transition metals Chu06 ; Lads03 ; Lads04 ; Zhuk02a ; Bace02 as well as for 5 transition metal Ta.Aesch04 In contrast to noble metals, which show qualitatively similar band structure and density of states (DOS),Papaconst electronic structure of 4 metals varies strongly on moving from the beginning of the 4-series to the end. Papaconst The calculations by Zhukov et al. Zhuk02a and Bacelar et al. Bace02 showed that the evaluated lifetimes also strongly vary along the 4-series following trends in electronic structure. The extension, , of the approximation by inclusion of multiple electron-hole scattering within a T-matrix approximation Spri98 ; Karl00 ; Zh05 ; NeChul05prb ; NeChul05condmat results in the decrease of the lifetime value that brings theory and experiment to better agreement. Aesch04 ; Zh05 ; NeChul05condmat
In this paper we perform TR-2PPE measurements of excited electron lifetimes in Mo and Rh and compare these results with the and calculated lifetimes. The choice of these metals is motivated by their very distinct electronic structure. The Fermi level () of Mo, a typical transition metal with bcc crystalline structure, is located in a deep minimum of a wide and half-filled -band (see Fig. 4).Papaconst Rhodium in contrast, a 4 metal with fcc crystalline structure, exhibits a very narrow and almost-filled -band Papaconst , where the Fermi level is situated in the vicinity of a sharp peak of density of states near the edge of the -band (see Fig. 7). Hence, in comparison with molybdenum, states of Rh are spatially more localized and, consequently, multiple scattering contributions to the electron lifetime should be enhanced. Such considerable differences in the band structure between Mo and Rh are expected to cause strong distinctions in the excited state lifetimes.
II Experiment
With the TR-2PPE technique the decay dynamics of an electron excitation (intermediate state) located between the Fermi edge and the vacuum level can be studied. The intermediate state is populated by a first (pump) laser pulse. Due to electron-electron scattering processes the excited electrons will then decay to lower unoccupied states. The rate of inelastic scattering of the electron defines the inelastic lifetime of the intermediate state.
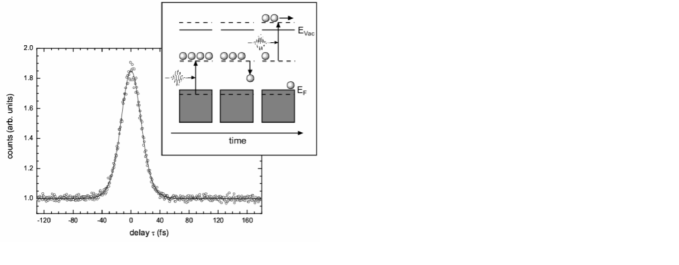
After a controlled delay a second (probe) laser pulse transfers the remaining population to the detected state above the vacuum level. The raw data (see Fig. 1) of a TR-2PPE measurement exhibits a 2-pulse correlation trace at a fixed kinetic energy, where the shape of the trace contains information about the pulse width of the pump and the probe laser pulse as well as the population decay time (and hence inelastic lifetime) of the probed intermediate state. In order to extract the intermediate state lifetime from the crosscorrelation trace, a rate equation model of a three level system is solved within a matlab-based fitting routine which uses a least-square-fit algorithm. Such a rate-equation model corresponds to solutions of the Liouville-von Neumann equations within the density matrix in the limit of rapid dephasing. It has been shown before to be a equivalent (and efficient) approach for the description of electronic band excitations as investigated in the present studies Petek .
The laser pulses for the TR-2PPE experiments were delivered by a mode-locked Ti:sapphire laser, pumped by about 7 W from a cw Nd:YVO3 diode laser. The available energy range for 2PPE emission has been increased by doubling the frequency of the linearly polarized pulses in a mm thick beta barium borate (BBO) crystal.
To minimize coherent effects in the 2PPE signal the polarization of pump and probe pulse were set to and polarized (cross polarized), respectively. The collinearly recombined beams were focused at incidence with respect to the surface normal of the sample. With these UV pulses ( = 3 eV) of up to nJ, at an repetition rate of about 80MHz less than one electron per pulse was emitted from the sample surface. In this means we avoid space-charge effects which can significantly distort the 2PPE signal. Furthermore it guarantees that the excitation density of the intermediate excited state is kept at a low level so that the experiment probes the relaxation of individual excited electronic states rather than the collective behavior (thermalization dynamics) of a transiently heated nonequilibrium distribution. A cylindrical sector energy analyzer (CSA)—positioned in the direction of the surface normal ()—was used to detect the electrons with an energy resolution of meV.
For the non-time-resolved 2PPE measurements, we used a cw argon-ion-laser pumped mode-locked Ti:sapphire laser delivering transform-limited pulses of about 120 fs, nJ/pulse at a repetition rate of 80 MHz. The advantage of this narrow bandwidth laser system is its tunability in the laser wavelength within the amplification bandwidth of about 100 nm which is required to distinguish between spectral features in the 2PPE spectra, arising from the occupied and unoccupied density of states of the electronic structure (see below).Fauster The wavelength of the laser pulses can be varied from 740 to 840 nm which corresponds to a tuning range of to eV in the photon energy of the frequency-doubled laser pulses.
Metallic Mo and Rh sheets of approximately -mm thickness were used for our experiments. We chose polycrystalline samples to guarantee an averaging over all possible directions in the space of the Brillouin zone and to avoid any influence of surface resonances on the measured lifetime which can exceed the bulk lifetime values by a factor of 10 and more.Fauster The purity of the sample was specified to be higher than %. The metallic sheets were cleaned by several sputter and heating cycles. After the cleaning we found no indication of significant impurities, such as C or O at the surface. Next to the sheet samples further TR-2PPE experiments were performed at ultrathin polycrystalline films of molybdenum of varying thickness between 20 nm and 100 nm. The films were prepared in-situ by means of electron-beam evaporation on a dielectric MICA substrate from a molybdenum rod (purity, 99.9+%) at a pressure of mbar. The film thickness was controlled using a calibrated flux monitor.
The cleaned metal surface was dosed with a small amount of Cs ( ML) to lower the surface work function. This procedure enables to increase the accessible energy range in the 2PPE experiment by about eV so that excitation levels also very close to the Fermi energy can be probed. Cs is evaporated from a thoroughly outgassed commercial getter source. The effect on the lifetime measurements by dosing a metal surface with a small amount of Cs has been thoroughly examined in the past Baue99 . Using cross-polarized pulses no differences in the lifetime of volume states could be observed between a clean and a cesiated metal surface by means of TR-2PPE.
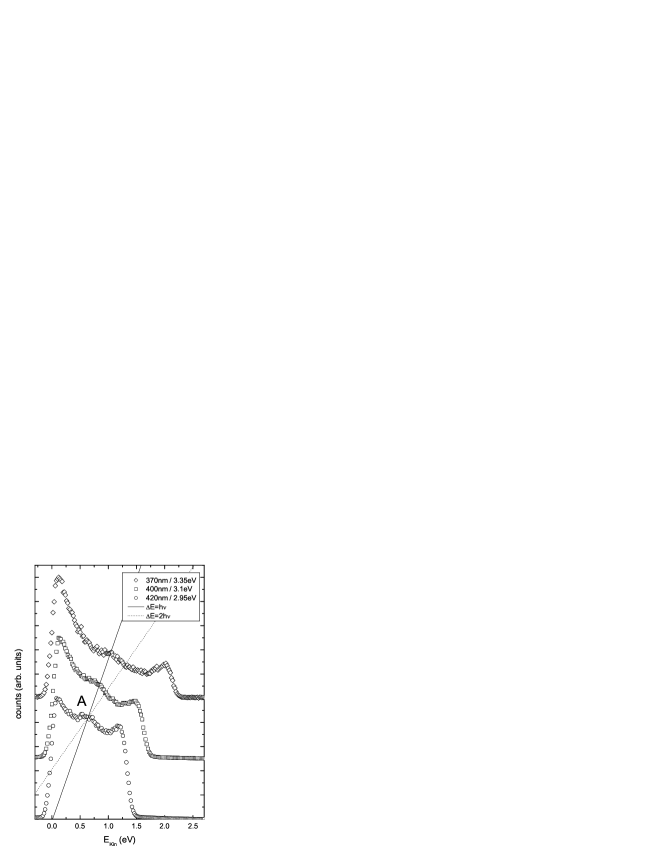
Static 2PPE spectra of an uncesiated molybdenum surface recorded at different photon energies are displayed in Fig. 2. In accordance with conventional photoemission experiments, the position of the low-energy cutoff of the spectra is governed by the work function of the surface. The sharp high-energy cutoff on the other hand maps the Fermi edge of the metallic sample. 2PPE spectra from polycrystalline samples are typically characterized by a rather structureless spectrum due to the restricted spectral width accessible with the used excitation wavelength in the optical regime and due to a blurring of spectral features by the involvement of an intermediate state in the photoemission process. The appearance of a distinct peak (indicated by A) at eV (corresponding to an intermediate state energy of eV) in the present example is insofar somewhat unusual. Rhodium, for instance, exhibits a completely structureless 2PPE spectrum. According to the excitation process, the shift in the peak position by as the excitation wavelength is tuned, indicates that the peak is due to an feature in the unoccupied DOS of Mo. In contrast, an occupied state feature would be characterized by an energy shift proportional to (see dotted line in Fig. 2 and the shift of the Fermi edge). Our measurements are performed on a polycrystalline sample and, furthermore, we do not observe any dependence in the appearance of the peak as a function of the excitation light polarization. We, therefore assign, this peak to an increase in the volume density of states in the corresponding intermediate energy region rather than to a surface state. Our band structure calculations presented in Sec. IV.1, show indeed a drastic increase in the DOS at about eV above the Fermi level (see Fig. 4).
III Theory
Within the framework of many-body perturbation theory,Inkson ; FettWal the inverse lifetime (decay rate) of an excited electron (hole) in a single-particle Bloch state with eigenvalue is given byZhuk02a
| (1) |
where is the many-body self-energy corrections to . In the Dyson scheme, these corrections can be approximated asZhuk01 ; Zhuk02a
| (2) |
where is the renormalization factor related to the partial derivative of with respect to energy at . Here is the matrix elements of the difference between the self-energy and the exchange and correlation potential obtained in the local-density approximation (LDA). Thus, the main problem in the lifetime evaluation is the calculation of the matrix elements of the self-energy .
A widely used approximation to calculate the self-energy is the GWA.GW_review This approximation is formally the first-order term in the Hedin expansionHedin of the self-energy in power of the screened Coulomb interaction. In the simplest version of the GWA we consider here, the self-energy is defined by the product of the noninteracting Green function and the screened interaction obtained within the random phase approximation (RPA).Inkson ; FettWal ; FerdiAnis Drawing attention only on momentum and energy dependence with the use of a shorthand notation in order to simplify the presentation, we can write the self-energy asHedin
| (3) |
Both and are built on the set. Physically Eq. (3) means that an electron, , propagating in a system with the momentum , creates a disturbance carrying momentum [see Fig. 3(a)]. This fact is reflected in the formula by the interaction . Further, as depicted by in Eq. (3), the electron propagates with the momentum right up to absorbtion of the disturbance.

Using the spectral function representation of and in Eq. (3), we can explicitly write down the imaginary part of the self-energy for, e.g., excited electrons () as
| (4) | |||||
Here is the Fermi energy, is the step function, is a set of appropriate Bloch basis functions, and are matrix elements of the RPA screened interaction in this basis. In the present work, one-electron wave functions , energies , and are calculated by using the linear muffin-tin orbital (LMTO) method.Andersen Having obtained the imaginary part of the self-energy, its energy-dependent real part can be found from the Hilbert transform. For details, we refer the reader to Refs. FerdiAnis, and Zhuk01, .
By making use of the matrix that describes multiple scattering between an electron and a hole, we can go beyond the GWA in the calculation of the self-energy. In this case, we additionally take into account third- and higher-order terms in the Hedin expansion of the self-energy which constitute an infinite class of electron-hole ladder diagrams.Inkson ; NeChul05prb This allows us to consider the following scattering processes [see Fig. 3(b)]. The electron creates a disturbance which in its turn results in the creation of an electron()-hole() pair. After that, the propagating electron repeatedly interacts (one or more times) with the hole during the --pair transport until this pair annihilation. The latter causes the disturbance which further is adsorbed by at the end of the considered process.
Without going into details which one can find in Refs. NeChul05prb, and NeChul05condmat, , we write the -matrix contribution as an additional term to the self-energy of Eq. (3):
| (5) |
where the matrix is given by
| (6) |
The local electron-hole interaction is simply related with the first-order exchange correction to accounting for a single electron-hole scattering event. Note that Eq. (6) should be considered as a relation between the matrices , , and . It is important that the -matrix contribution of Eq. (5) has a -like formula. This means that in order to obtain the imaginary part of , we can use Eq. (4) with instead of .
The resulting self-energy in such a approach is given by the sum . In calculations presented below, following Refs. Karl00, ; Zhukov, , and Aesch04, , we model the interaction as the Fourier transform of the RPA screened interaction at zero energy but with the prefactor obtained in Ref. NeChul05condmat, , i.e., . Having obtained the self-energy, one can evaluate the lifetime with the help of Eqs. (1) and (2). In order to compare theoretical results with the experimental data (polycrystalline sample), we average the calculated lifetime over momentum for a given excitation energy.
IV Results and discussion
IV.1 Molybdenum


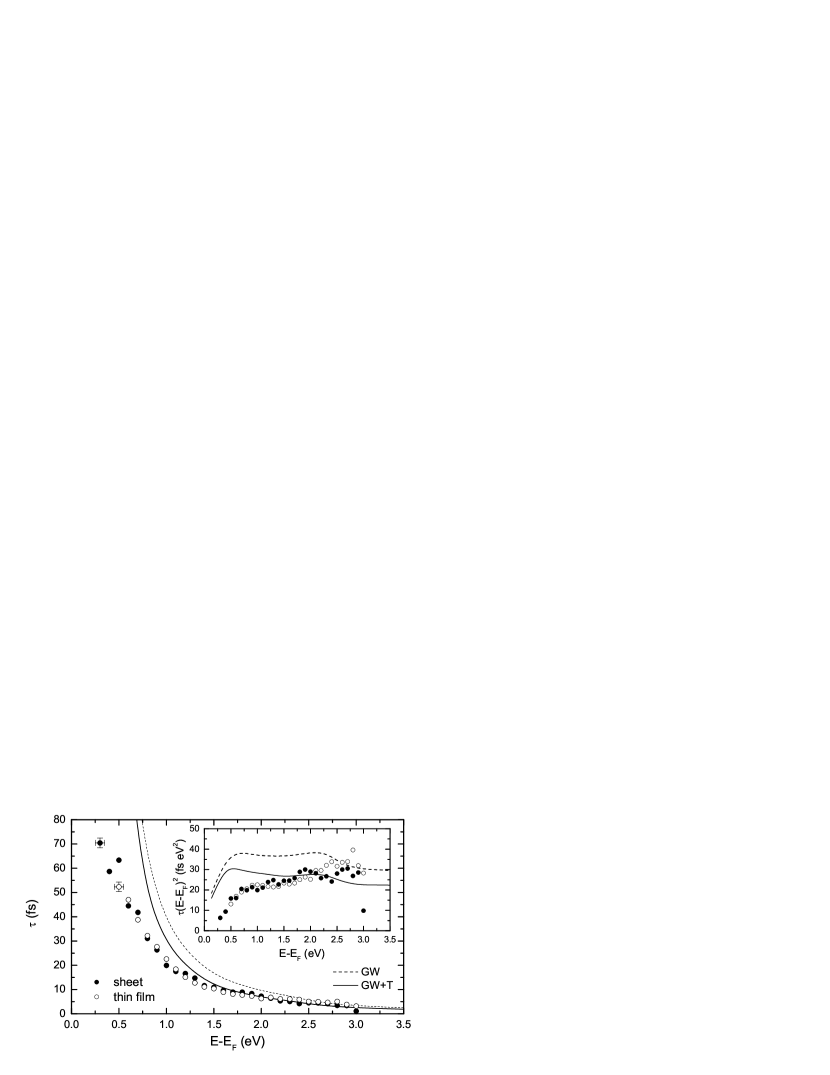
Figure 4 shows the band structure of Mo and corresponding total and partial DOS. As mentioned before, the DOS has a wide ( eV) -band with a deep minimum at . Until eV above the total DOS is almost completely determined by the unoccupied -states and has a sharp peak at 2.25 eV. This peak can be identified with the experimentally observed unoccupied peak A discussed in Sec. II. Below the Fermi level, the states also dominate in the formation of the total DOS. At the same time, as it is evident from Fig. 4, the contribution of states is essentially larger for these energies than for energies above . The total DOS shows two pronounced peaks (at -1.96 eV and at -3.4 eV) separated by a minimum at -2.52 eV.
Figure 5 shows the calculated momentum-averaged lifetimes of electrons and holes. As follows from the figure, the electron lifetime is shorter than the hole one. It is caused by both the considerable contribution below the Fermi level and the total DOS shape which differs from that above (the available phase space for hole inelastic scattering is smaller). Nevertheless, as can be seen from the inset in Fig. 5, due to the fact that the total DOS has a relatively symmetric form with respect to the electron and hole lifetimes demonstrate a quite similar behavior. Also, both lifetimes have a small knoll in the vicinity of the excitation energy of 2 eV arising from the key features of the electron structure of Mo. As evident from the figure, the inclusion of the matrix leads to a shortening of the lifetimes. An analysis of the ratio has shown that in the vicinity of ( eV) the -matrix contribution is essentially less than the term. However, increases rather fast with increasing excitation energy and amounts on average to with respect to at eV.
Addressing the role of states in the formation of the energy dependence of the lifetime, it is worth emphasizing that taking into account only states in the evaluation of the propagator and the Green function in the GWA, one obtains similar results for both the electron and hole lifetimes.Unpublished_calcs This means that the -band plays a dominant role and only 4 states can be treated to quickly assess the imaginary part of the self-energy and the lifetime.
In Fig. 6, the calculated momentum-averaged electron lifetimes are presented in comparison with the experimentally determined relaxation times of photoexcited electrons extracted from the cross-correlation traces. The highest excited state probed in the experiments was restricted by the photon energy to eV. The transport of excited electrons out of the surface region into the bulk can act as an additional decay channel which reduces the measured lifetime of the excited states.Aesc00 In order to study the influence of transport effects on the experimental results, we performed further experiments on the carefully prepared Mo films suported by a dielectric MICA substrate. Different film thickness between 20 nm and 100 nm were studied. As evident from Fig. 6, both, sheet data (solid circles) and thin film data (open circle), give identical results within the scatter of the data. The lack of any systematic deviation shows that the contribution of transport to the lifetime measured in the TR-2PPE experiment is negligible.Aesc00 ; Aesch04
Regarding the comparison between experimental and theoretical data, inspecting Fig. 6 one can see that the -matrix inclusion leads to better agreement between the theoretical and experimental results (especially for eV). This becomes particularly evident in the inset of Fig. 6 which shows the deviation of experimental and calculated lifetime data from the Fermi-liquid model by Quinn and FerrellQF . Here, the center of gravity of the experimental scaled lifetime ( fs eV2) is close to the + curve for energies higher than eV. Below this value, towards , the experimental lifetime goes down faster than the one. However, the experimentally observed less rapid increase in the lifetime towards in comparison to the Fermi-Liquid model in this energy region is qualitatively well reproduced by the theoretical results, which follow the slope of the data reasonably well. Some discrepancy for energies smaller than eV can be caused by both the approximations made for the self-energy (e.g., electron-phonon coupling can be important here) and secondary processes which effect the experimental observed relaxation times.Aesc00 Note that this discrepancy can be eliminated by adding to a weak energy dependent term of meV.
IV.2 Rhodium


The calculated band structure and DOS of Rh are shown in Fig. 7. Compared to Mo, the Rh -band is more narrow ( eV). Almost all the states are occupied except for a small fraction which constitutes the sharp peak at eV and pronounced edge of the -band at eV above . At higher energies unoccupied bands show comparable contributions of and states. Below , the -states contribution to the bands is negligible in comparison with the states. Another peak comparable with the previous one is situated at eV.
In Fig. 8, the calculated momentum-averaged lifetime of electrons and holes in Rh is shown. On first glance, it may seem that the lifetimes of electrons and holes demonstrate a similar behavior and differ to only a small extent. However, inspecting the scaled averaged lifetimes (see inset in Fig. 8), one can see that starting from an energy corresponding to the -band edge, the energy dependence of for electrons can be fitted by a straight line with the slope of fs eV against fs eV for the hole scaled lifetime. Such a distinction is caused by the total DOS shape, the main part of which lies below . Note that at energies below the -band edge both the considered curves exhibit the scaled lifetime energy dependence similar to that in the case of Mo, but with essentially smaller values of due to the higher DOS.Zarate
As in Mo, the inclusion of the matrix leads to a shortening of the lifetime. However, in this case, in the vicinity of ( eV) the matrix yields the largest contribution which amounts on average to in relation to . As the excitation energy increases, the contribution falls down. At eV, the ratio has knolls running up to for electrons and for holes. Calculations performed with taking into account only states have corroboratedUnpublished_calcs the dominant role of the -band in formation of the excited electrons dynamics in transition metals.
In Fig. 9, we show the experimental relaxation time in comparison with the calculated momentum-averaged electron lifetimes. Again, as it has been done for Mo, the highest excited state probed in the experiments was restricted by the photon energy to eV. The lifetime measurements for polycrystalline thin films were not carried out in this case. Taking into consideration that the relaxation times of excited electrons in Rh are rather short over a large energy region, we have supposed that transport effects are negligible. Actually, the considered quantity remains below fs down to an exciting energy eV (see experimental points in Fig. 9). Towards the Fermi energy a steep increase in the relaxation time is obtained. This is the lowest onset energy in a lifetime increase ever reported in TR-2PPE measurements of bulk states.
Comparing the experimental and theoretical data shown in Fig. 9, one can distinguish the following main aspects. The inclusion of the matrix ensures better agreement between the theoretical and experimental results for eV (see the inset), whereas for higher energies the experimental values are even above the curve. As in Mo, some discrepancy in the low energy region can be eliminated by adding to a weak energy dependent term, but the latter is equal to meV in the case of Rh.
IV.3 Comparison of lifetimes in Mo and Rh
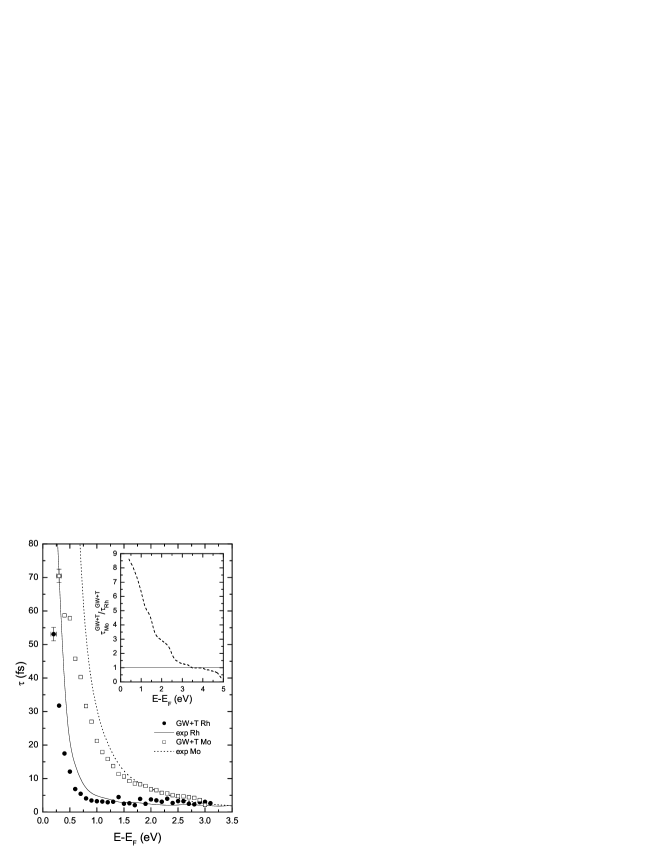
In Fig. 10 we compare the time-resolved 2PPE data as well as the theoretical results for the transition metals rhodium and molybdenum. With a glance at the figure, practically over all the considered energy region the electron lifetimes in Rh are shorter than those in Mo, especially below 2.0 eV. Presented as the ratio (see inset in Fig. 10), the calculated lifetimes, which are consistent with the experimental data, clearly reflect this fact. Moreover, one can see that at energies above 1.0 eV, where agreement between the experimental and theoretical results is rather good, this ratio falls down from 6 to unity (at eV). Further, the ratio becomes smaller than 1. By this comparison we demonstrate that upon moving across the series from Mo to Rh the changes in filling, width, and shape of the -band have a strong effect on the electron lifetime.
In principle, such a shortening of the lifetime is an expected trend which can be qualitatively understood in a scattering theory approach (STA).Zarate ; Ech00 ; Zhuk02a Within this approach, the lifetime is considered in terms of energy-dependent matrix element and the total DOS convolution. The former contains effects of screening, and the latter reflects peculiarities of one-electron energy dispersion. As was shown in Ref. Zhuk02a, , for Mo and Rh a good accordance between the STA and GWA calculations can be achieved with the energy-independent matrix element . Furthermore, for excited electrons the matrix elements for Mo and Rh are similar. Therefore, an analysis of differences between the lifetimes in these transition metals can be reduced to an examination of features of the DOS. In addition, due to the dominant role of states, only the partial -DOS is of interest. For example, taking into account the density of states averaged over the -band width, as we move from Mo to Rh, one can obtain the electron lifetime decreasing by a factor of 3. Further, considering molybdenum as a representative of bcc metals from the center of the -transition series and rhodium as a representative of fcc metals from the end of these series, one can expect approximately the same shortening of the electron lifetime upon moving, e.g., from Nb to Pd (the series) and from Ta or W to Pt (the series).Unpublished_calcs
V Conclusions
In conclusion, we have analyzed the strong influence of the transition metal 4-band structure on the relaxation dynamics of optically excited electrons. Comparing the obtained theoretical results on Mo and Rh with the experimental data, we have shown that the -matrix contribution to the electron self-energy improves the GWA values. Thus, we have found that taking into account multiple scattering between an excited electron and a hole is important to achieve reasonable agreement with the TR-2PPE spectroscopy measurements. Next to the good agreement between experimental and theoretical lifetime data we were also able to assign a feature in the static molybdenum 2PPE spectrum to an enhanced electronic density of the excited state distribution in the calculated bulk band structure. Overall we believe that the present study is a good example of how the combination of sophisticated state-of-the-art experimental and theoretical approaches enable a microscopic understanding of the ultrafast femtosecond dynamics of electronic excitation in complex condensed matter systems.
Acknowledgments
This work was partially supported by Gobierno Vasco, UPV/EHU, MCyT (Grant No. FIS 2004-06490-C03-01), by the European Community 6th framework Network of Excellence NANOQUANTA (Grant No. NMP4-CT-2004-500198) and by the priority program 1133 of the German Science Foundation (DFG).
References
- (1) D. R. Penn, Phys. Rev. B 13, 5248 (1976).
- (2) M. Aeschlimann, M. Bauer, and S. Pawlik, Chem. Phys. 205, 127 (1996).
- (3) M. Bauer, S. Pawlik, and M. Aeschlimann, Proc. SPIE 3272, 201 (1998).
- (4) C.A. Schmuttenmaer, M. Aeschlimann, H.E. Elsayed-Ali, R.J.D. Miller, D.A. Mantell, J. Cao, and Y. Gao, Phys. Rev. B 50, 8957 (1994).
- (5) T. Hertel, E. Knoesel, M. Wolf, and G. Ertl, Phys. Rev. Lett. 76, 535 (1996).
- (6) S. Ogawa, H. Nagano, and H. Petek, Phys. Rev. B 55, 10869 (1997).
- (7) E. Knoesel, A. Hotzel, and M. Wolf, Phys. Rev. B 57, 12812 (1998).
- (8) J. Cao, Y. Gao, H.E. Elsayed-Ali, R.J.D. Miller, and D.A. Mantell, Phys. Rev. B 58, 10948 (1998).
- (9) M. Aeschlimann, M. Bauer, S. Pawlik, W. Weber, R. Burgermeister, D. Oberli, and H.C. Siegmann, Phys. Rev. Lett. 79, 5158 (1997).
- (10) R. Knorren, K.H. Bennemann, R. Burgermeister, and M. Aeschlimann, Phys. Rev. B 61, 9427 (2000).
- (11) W. Nessler, S. Ogawa, H. Nagano, H. Petek, J. Shimoyama, Y. Nakayama, and K. Kishio, Phys. Rev. Lett. 81, 4480 (1998).
- (12) V. P. Zhukov, O. Andreyev, D. Hoffman, M. Bauer, M. Aeschlimann, E. V. Chulkov, and P. M. Echenique, Phys. Rev. B 70, 233106 (2004).
- (13) P. M. Echenique, J. M. Pitarke, E. V. Chulkov, and A. Rubio, Chem. Phys. 251, 1 (2000).
- (14) V. P. Zhukov, F. Aryasetiawan, E. V. Chulkov, I. G. de Gurtubay and P. M. Echenique, Phys. Rev. B 64, 195122 (2001).
- (15) E. V. Chulkov, A. G. Borisov, J.-P. Gauyacq, D. Sánchez-Portal, V. M. Silkin, V. P. Zhukov, and P. M. Echenique, Chem. Rev. (Washington, D.C.) (to be published).
- (16) F. Ladstädter, P.F. de Pablos, U. Hohenester, P. Pusching, C. Ambrosch-Draxl, P. L. de Andres, F.J. García-Vidal, and F. Flores, Phys. Rev. B 68, 085107 (2003).
- (17) F. Ladstädter, U. Hohenester, P. Puschnig, and C. Ambrosch-Draxl, Phys. Rev. B 70, 235125 (2004).
- (18) V.P. Zhukov, F. Aryasetiawan, E. V. Chulkov, and P.M. Echenique, Phys. Rev. B 65, 115116 (2002).
- (19) M. R. Bacelar, W.-D.Shcöne, R. Keyling, and W. Ekardt, Phys. Rev. B 66, 153101 (2002).
- (20) D.A. Papaconstantopoulos, Handbook of the band structure of elemental solids (Plenum, New York, 1986).
- (21) M. Springer, F. Aryasetiawan, and K. Karlsson, Phys. Rev. Lett. 80, 2389 (1998).
- (22) K. Karlsson and F. Aryasetiawan, Phys. Rev. B 62, 3006 (2000)
- (23) I.A. Nechaev and E.V. Chulkov, Phys. Rev. B 71, 115104 (2005).
- (24) I.A. Nechaev and E.V. Chulkov, Phys. Rev. B, 73, 165112 (2006).
- (25) V.P. Zhukov, E.V. Chulkov, and P.M. Echenique, Phys. Rev. B, 72, 155109 (2005).
- (26) M. J. Weida, S. Ogawa, H. Nagano, and H. Petek, J. Opt. Soc. Am. B 17, 1443 (2000).
- (27) Th. Fauster and W. Steinmann, “Photonic Probes of Surfaces,” in Electromagnetic Waves: Recent Developments in Research, edited by P. Halevi (North-Holland, Amsterdam, 1995), Vol. 2, pp. 347-411.
- (28) M. Bauer, S. Pawlik, and M. Aeschlimann, Phys. Rev. B 60 , 5016 (1999).
- (29) J.C. Inkson, Many-Body Theory of Solids (Plenum, New York, 1984).
- (30) A.L. Fetter and J.D. Walecka, Quantum Theory of Many-particle Systems (McGraw-Hill, New York,1971).
- (31) For a recent review, see W.G. Aulbur, L. Jönsson, and J. Wilkins, in Solid State Physics, edited by H. Ehrenreich and F. Saepen (Academic, New York, 2000), Vol. 54, p. 1.
- (32) L. Hedin, Phys. Rev. 139, A796 (1965).
- (33) F. Aryasetiawan in Strong Coulomb Correlations in Electronic Structure Calculations, edited by V.I. Anisimov (Gordon and Beach, Singapore, 2001).
- (34) O.K. Andersen, O. Jepsen, and M. Sob, Lect. Notes Phys. 283, 1 (1987)
- (35) V.P. Zhukov, E.V. Chulkov, and P.M. Echenique, Phys. Rev. Lett. 93, 096401 (2004).
- (36) I.A. Nechaev, P.M. Echenique, and E.V. Chulkov (to be published).
- (37) M. Aeschlimann, M. Bauer, S. Pawlik, R. Knorren, G. Bouzerar, and K.H. Bennemann, Appl. Phys. A: Mater. Sci. Process. A71, 485 (2000).
- (38) J.J. Quinn and R.A. Ferrell, Phys. Rev. 112, 812 (1958)
- (39) E. Zarate, P. Apell, and P.M. Echenique, Phys. Rev. B 60, 2326 (1999).