Permanent address: ]IPCMS-GEMME, 23 rue du Loess, BP 43, 67034 Strasbourg cedex 2, France.
Permanent address: ]Institute of Materials Science, University of Tsukuba, Tsukuba, Ibaraki 305-8573, Japan.
Permanent address: ]Dpto. Física de Materiales, Universidad Autónoma de Madrid, 28049 Madrid, Spain
Magneto-optical spectroscopy of (Ga,Mn)N epilayers
Abstract
We report on the magneto-optical spectroscopy and cathodoluminescence of a set of wurtzite (Ga,Mn)N epilayers with a low Mn content, grown by molecular beam epitaxy. The sharpness of the absorption lines associated to the Mn3+ internal transitions allows a precise study of its Zeeman effect in both Faraday and Voigt configurations. We obtain a good agreement if we assume a dynamical Jahn-Teller effect in the 3d4 configuration of Mn, and we determine the parameters of the effective Hamiltonians describing the and levels, and those of the spin Hamiltonian in the ground spin multiplet, from which the magnetization of the isolated ion can be calculated. On layers grown on transparent substrates, transmission close to the band gap, and the associated magnetic circular dichroism, reveal the presence of the giant Zeeman effect resulting from exchange interactions between the Mn3+ ions and the carriers. The spin-hole interaction is found to be ferromagnetic.
pacs:
75.50.Pp, 75.30.Hx, 78.20.LsI Introduction
Extrapolating the Zener model of carrier-induced ferromagnetism to wide bandgap diluted magnetic semiconductors (DMS) predicts that high critical temperatures should be achieved, provided several demanding assumptions are satisfied. In particular, -type (Ga,Mn)N would be ferromagnetic with a critical temperature exceeding room temperature. This implies however the incorporation of 5% of Mn into GaN, substituting Ga in the form of ions, and a strong -type doping.Dietl00
Early experimental works following this prediction did not give any clearcut conclusion about the magnetic properties of (Ga,Mn)N: ferromagnetic properties at high temperature,Hori02 ; Chitta04 as well as paramagnetic properties down to low temperature,Giraud04a ; Wolos04a have been reported. However, there is now a general agreement that (Ga,Mn)N does not offer the configuration which exists in (Ga,Mn)As, with the transfer of an electron from the valence band to the -levels, resulting in both the configuration (with a spin 5/2) which is observed and the acceptor character of the Mn impurity.
Ab initio calculations of the band structureKronik02 ; Kulatov02 ; Sanyal03 ; Popovic04 ; Wierzbowska04 ; Titov04 do not exclude the possibility of a ferromagnetic interaction, but they all conclude that the bands of Mn are located rather high in the bandgap of GaN, although its exact position cannot be given.
From an experimental point of view, diverging conclusions have been drawn about the valence state of Mn in (Ga,Mn)N. In bulk (Ga,Mn)N with a very low Mn content, the state was detected by electron paramagnetic resonance;Wolos04a in similar samples, the valence state was deduced from magneto-optical measurements upon co-doping with Mg.Wolos04a The Mn content in these samples was chosen to be very low, a few at most, so that these two results can be understood from the strong -type character of the first samples and the usual acceptor character of Mg in GaN. The same state was observed by x-ray absorption spectroscopy at the -edge of Mn near the surface of layers grown by plasma-assisted molecular beam epitaxy on n-type, Sn-doped GaN templates,Hwang05 while we have observed the state by x-ray absorption spectroscopy at the -edge of Mn in layers grown also by plasma-assisted molecular beam epitaxy but on undoped GaN templates.Titov04 ; Sarigianidou06 Various types of valence states, from to , were invoked to explain optical spectra of epilayers with a larger Mn content.Wolos04b ; Han04 These results were mainly obtained on (Ga,Mn)N with the wurtzite structure : the case of cubic (Ga,Mn)N layers appears to be peculiar, since -type doping due to the incorporation of Manganese was reported,Novikov04 ; Edmonds05 .
Optical absorption spectraKorotkov02 ; Graf02 ; Graf03 ; Wolos04b show (i) a structured absorption band in the near infra-red, with a sharp zero-phonon line, which was attributed to the transitions of the Mn3+ ion (the configuration), (ii) a broad absorption band attributed to the transitions between the Mn levels and the bands of the semiconductor, (iii) absorption at the bandgap of the semiconductor.
The present work is devoted to a magneto-spectroscopic study of (Ga,Mn)N samples with a low Mn content, so that quite sharp features are observed, and to the evolution of the magnetic and magneto-spectroscopic properties upon increasing the Mn content. Main results are a determination of the parameters which enter the effective Hamiltonian of the ground level of Mn in (Ga,Mn)N, which results from a dynamical Jahn-Teller effect in the configuration of Mn, and the observation of spin-carrier coupling through the giant Zeeman effect at the bandgap of (Ga,Mn)N.
II Samples and experimental set-up
Epilayers of wurzite (Ga,Mn)N were grown by nitrogen-plasma-assisted molecular beam epitaxy (MBE), on a GaN template, previously grown by metal-organic chemical vapor deposition (MOCVD) on the surface of a sapphire substrate. A few additional samples were grown on AlN templates, so that the substrate is transparent in the vicinity of the bandgap of (Ga,Mn)N. Unfortunately, the growth had to be initiated with a GaN layer, which was kept as thin as possible. The growth temperature was kept at , which is our usual growth temperature for GaN. A special attention was paid to the different growth regimes related to the Ga/N flux ratio and to the manganese flux.Giraud04b Samples were characterized using reflection high-energy electron diffraction (RHEED). Post-growth characterization comprised secondary ion mass spectroscopy (SIMS) and x-ray diffraction (XRD).
Optical absorption in the near infrared was measured using a Fourier Transform Infrared spectrometer (FTIR) with a spectral resolution of 0.5 meV, using a tungsten lamp as the light source and a silicon photodetector. Magneto-optical spectroscopy in the near infrared and in the vicinity of the band gap energy was measured using a CCD camera attached to a grating spectrometer. The magnetic circular dichroism was then calculated from the transmission spectra of right- and left-circular polarized light. In some cases, it was also measured directly using a 50 kHz photoelastic modulator and a photomultiplier tube.
Cathodoluminescence was observed in a scanning electron microscope, with the sample placed on a cold finger at 5 K, using an accelerating voltage of 4 kV and a typical current of the order of 30 nA. The luminescence intensity was recorded on a GaAs photomultiplier tube attached to a 460 mm spectrometer for imaging, and a charge coupled device (CCD) camera for spectroscopy. Attempts to measure the photoluminescence excited by a He-Cd laser (20 mW on a 50 m spot size) were unsuccessful.
All the transmission spectra exhibited interference fringes due to internal reflexions between the surface and the sapphire/GaN interface. These interferences were removed using a lineshape fit of the transmittance which includes a function, where is the thickness of the GaN + (Ga,Mn)N layer, the wavelength, and the optical index of GaN at room temperature.Yu97 This process is quite efficient in the case of sharp lines, such as the near infrared zero-phonon line, for which the fit can be optimized over a narrow range across the line. The process is less accurate for broad absorption bands (broader than 25 meV typically), particularly in the vicinity of the bandgap, since we should use the optical index of (Ga,Mn)N at low temperature.
Magnetization measurements were performed using a superconducting quantum interference device (SQUID) magnetometer at magnetic fields up to 5 T applied in the plane of the sample ( axis) or perpendicular to the plane ( axis), at temperatures down to 2 K. The large diamagnetic contribution from the substrate was evaluated on a piece of the same substrate.
III Magneto-optical spectroscopy of transitions
In this section, we present the spectroscopic study in the near infrared, including magneto-transmission and cathodoluminescence. Previous transmission spectra have been attributedWolos04b to the transition of the configuration of Mn, involving a large cubic crystal field splitting, about 1.4 eV. The better resolution achieved on the present samples with a low Mn content, and the comparison between transmission and cathodoluminescence spectra, lead us to reconsider the effective Hamiltonian which takes into account the Jahn-Teller effect and the trigonal crystal field.
III.1 Experimental results
Fig. 1 displays a transmission spectrum and a cathodoluminescence spectrum of a (Ga,Mn)N layer with 0.06% Mn. A series of cathodoluminescence spectra were measured locally from different points of the sample. The one displayed in Fig. 1 is typical of what was obtained from most points ; occasionally, broadened spectra were observed. The origin of the horizontal scale in Fig. 1 is the common position of the zero-phonon line at 1413 meV, and the scale is inverted for the two spectra.
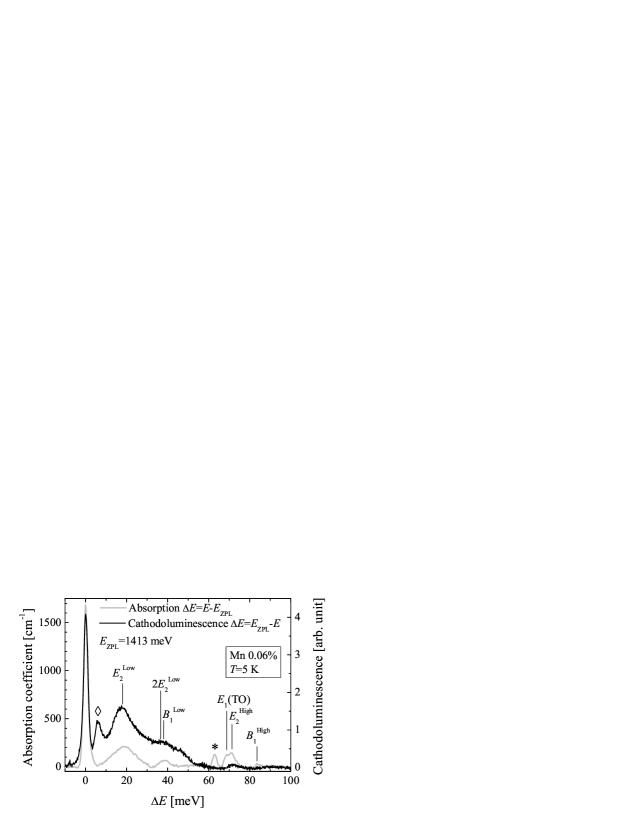
Most features are present on both spectra : they are clearly phonon replica. They may involve local modes of the Mn impurity and its cluster of nearest neighbors, which are expected around 20 meV and 70 meV.Korotkov02 These frequencies are close to high symmetry phonons of GaN,Gebicki00 ; Harima04 ; Hasuike04 as expected since the difference of mass between Mn and Ga is small. The presence of resonances with the phonons of GaN makes the spectrum quite complex, but the coupling to the mode at 20 meV dominates, so that a simple model of coupling to a single local mode can be a reasonable approximation.
The coupling to this principal mode is rather weak: the intensity of the zero-phonon line and that of the phonon replica are of the same order of magnitude. In the case of a single local mode, the intensity of the replica to the zero-phonon line is expected to be , where is the so-called Huang-Rhys factor: from the first replica, we obtain 0.7 from the transmission spectrum, 1.9 from the cathodoluminescence spectrum. This is in good agreement with previous determinations (0.6 in Ref. Wolos04b, , 1.1 in Ref. Korotkov02, ). The main contribution to the line at E=40 meV arises from the second phonon line due to the same mode.
This coupling is much weaker than in the case of Cr in II-VI semiconductors,Vallin70 which has the same configuration. Then the zero-phonon line is weak (meV/Cr in ZnSe,Vallin70 to be compared to meV/Mn in GaN). The intensity is transferred to a broad vibronic band, three orders of magnitude more intense than the zero-phonon line (so that the total integrated intensity is about the same in both cases). The Huang-Rhys factor, as deduced from the position of the maximum of the vibronic band, at from the zero-phonon line, is as high as 13 for Cr2+ in ZnTe and 18 in CdS.
Two lines in Fig. 1 cannot be ascribed to phonon replica. The line marked with a diamond in Fig. 1 is present only in the cathodoluminescence spectrum. It must correspond to a transition to an excited state of the ground multiplet. Another line, marked with a star in Fig. 1, is observed in transmission but not in cathodoluminescence. Its intensity is much lower than that of the zero-phonon line at 1413 meV, and we tentatively ascribe it to a spin-forbidden transition to one of the or levels, which are indeed quite close for such a value of the cubic crystal field.Tanabe
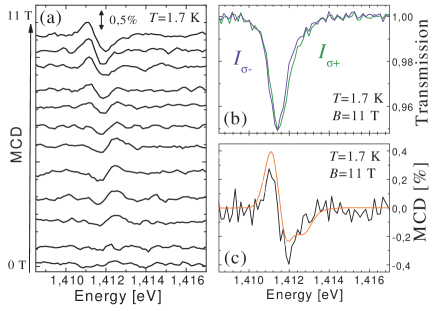
Fig. 2 shows a series of transmission spectra in the range of the zero-phonon line, for another sample with a low Mn content (0.03%), for different values of field and temperature, in both the Faraday and Voigt configurations. The general features reported by Wołos et al.Wolos04b are observed, with however a higher resolution. Spectra up to 22 T have been also recorded from the same sample, with a slightly lower resolution (not shown).
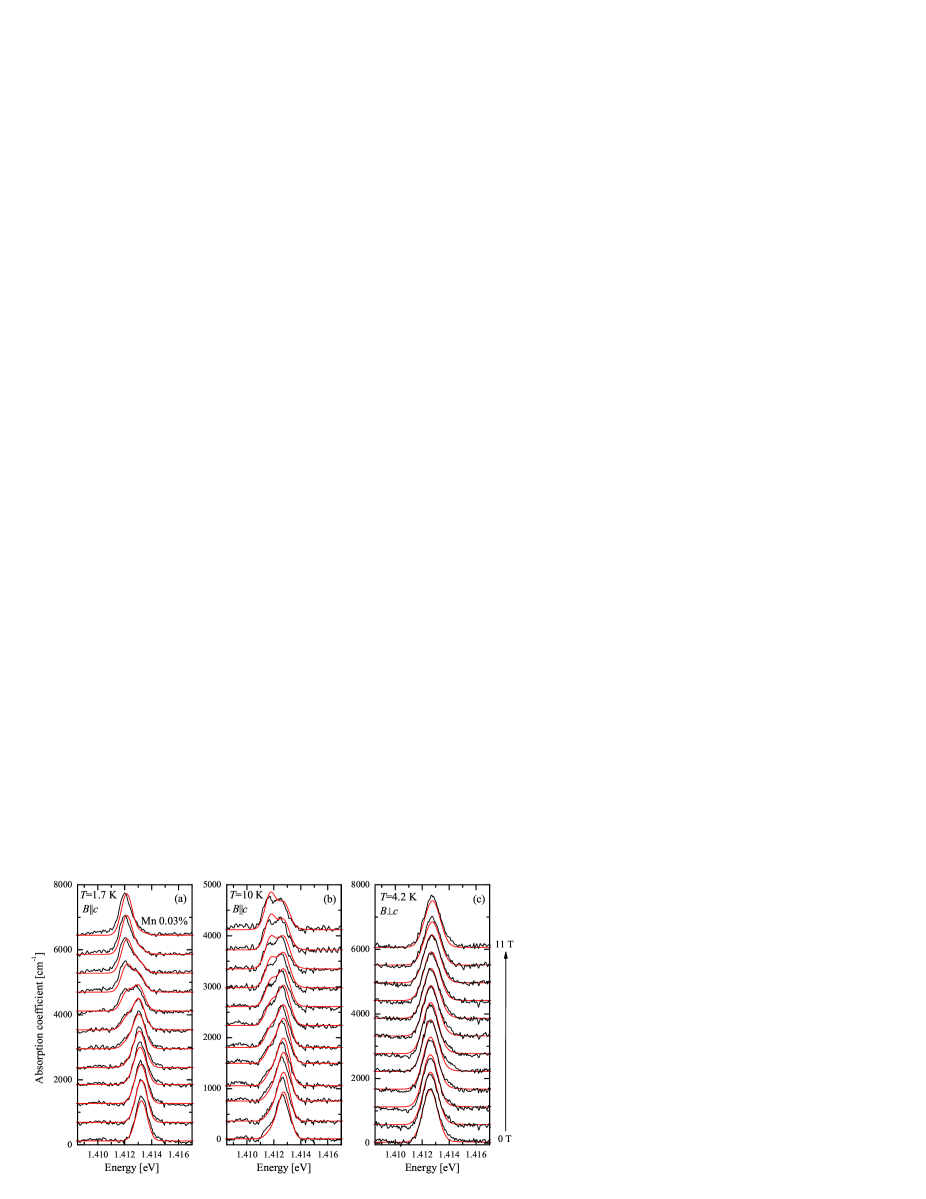
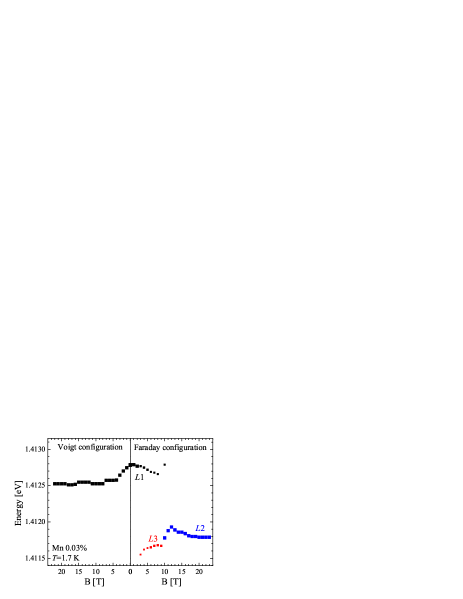
Two points should be stressed. First, the zero-field spectrum contains essentially one line : any structure, if present, should be comprised within the observed linewidth of 1.1 meV. Second, the ”shift” at 7 T reported in Ref. Wolos04b, is actually an intensity transfer between two lines labeled L1 and L2. From a plot of the positions and intensities deduced from a Gaussian fit (Fig. 3), a third peak appears at intermediate magnetic field, which exhibits a small but systematic shift with respect to .
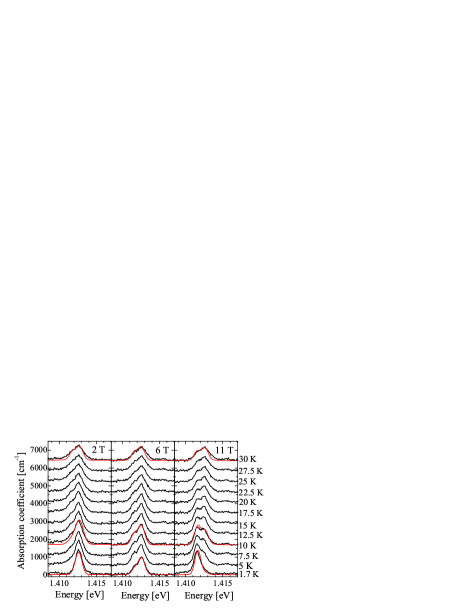
The appearance of at 3 T, on one hand, and the intensity transfer to observed between 10 and 13 T, on the other hand, indicate two values of the applied field where a crossing takes place in the manifold of ground states. The relative position of the ground states which serve as initial states for the absorption lines can be deduced from spectra recorded as a function of the temperature for selected values of the magnetic field (Fig. 4). For instance, it is clear from the spectra that two lines, at 1411.8 meV and at 1412.8 meV, co-exist even at low temperature at 6 T. At lower fields only one line is seen at 1.7 K and a second line rises on its low energy side at higher temperature ; the opposite is observed at higher fields. A plot of the intensities (not shown) is well reproduced by an activation energy with Landé factors of the order of 2. As the positions of , and remain almost unchanged (at most 0.2 meV over a 10 T scan), almost identical Zeeman shifts occur in both the ground and excited multiplets - which may be accidental, but rather suggests that the spin-orbit coupling is weak.
This is supported by the fact that we measure a weak (although non zero) magnetic circular dichroism (MCD), . Fig. 5b displays spectra recorded for the two circular polarizations, and , at 11 T and 1.7 K, together with the resulting MCD (Fig. 5c). Measuring such a small dichroism on a thin layer is difficult. MCD spectra with a much higher signal-to-noise ratio, obtained on bulk material, are given in Ref. Wolos04b, . The same lineshape is observed at high field, but the MCD persists at lower field in Ref. Wolos04b, while we observe a faster decrease and even a trend to a change of sign (Fig. 5a).
We shall show now, by constructing an effective Hamiltonian, that these spectra are well explained by a d4 configuration, in a crystal field of trigonal symmetry, with a dynamical Jahn-Teller effect which reduces the spin-orbit coupling.
III.2 Effective Hamiltonian
The Hamiltonian of a ion contains the crystal field terms (cubic and trigonal components), the spin-orbit coupling, the Zeeman effect, the coupling to local strain, and the Jahn-Teller effect.
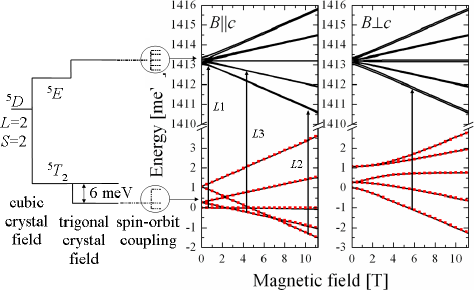
The cubic component of the crystal field splits the multiplet into a ground orbital triplet and a orbital doublet (noted in table I). A basis of orbital states of the triplet adapted to the cubic symmetry is given by the three states , , which transform like , , where , , label the cubic axes; for the doublet, a basis is given by , .
In the case of a wurtzite crystal, there is also a trigonal crystal field. It has off-diagonal matrix elements in the cubic basis of the orbital triplet and no matrix elements within the doublet. In the case of epitaxial layers grown along the axis, it may contain a contribution from the biaxial strain due to the partially compensated lattice mismatch.
For the free Mn3+ ion, the spin-orbit coupling within the 5D multiplet is written with , and 11 meV .Abragam In a crystal, this value can be reduced slightly by hybridization, and significantly by the Jahn-Teller effect (see below).
The coupling to local strain (”strain fluctuations”) involves trigonal and tetragonal components. The coupling to trigonal strain, i.e., strain components of symmetry, has off-diagonal matrix elements in the cubic basis of the orbital triplet and no matrix elements within the doublet. The coupling to tetragonal strain, i.e., strain components of symmetry, has matrix elements within the triplet (where they are diagonal) and the doublet.
Finally, there is a Jahn-Teller coupling of the orbital triplet to and modes, and of the orbital doublet to the modes.
The most simple case of Jahn-Teller coupling is that of an orbital triplet coupled to a single mode. A very intuitive treatment, based on first and second order perturbations, was given by HamHam65 . Basically, the orbital triplet is replaced by a vibronic triplet : each orbital state is associated to a potential well with its minimum corresponding to a distortion of the environment along a cubic direction. The vibronic states are the product of the orbital state by the eigenstates of the displaced harmonic oscillator. The Hamiltonian acting within the orbital triplet, as defined above, is replaced by an effective Hamiltonian acting within the vibronic triplet: the main result is that the first-order contribution of off-diagonal operators is reduced by the overlap of eigenstates of the different harmonic oscillators. First-order contributions of diagonal operators are not reduced. Second-order contributions have to be considered : they are not reduced as the first-order ones so that their role can be enhanced.
In the case of a crystal of cubic symmetry, a strong Jahn-Teller effect results in a strong reduction of all contributions but that of tetragonal strain fluctuations. One can use the approximation of the ”static Jahn-Teller coupling”: the local tetragonal strain slightly lowers the energy of a well corresponding to a distortion along one of the three cubic directions, and for this ion all calculations are performed with this particular distortion. This approximation was used in the first study of Cr2+ in II-VI semiconductors,Vallin70 with the additional assumption that there is no Jahn-Teller coupling in the excited state. The same assumption was used laterHerbich98 in the case of Cr2+ in CdS, which has the wurtzite structure. More recently Wolos04b a reasonable agreement with the available data was obtained in the case of Mn3+ in GaN.
In the present study, two points however cannot be explained by this model: (i) the presence of a second zero-phonon line in the cathodoluminescence spectrum, and (ii) the observation of a main zero-phonon line at zero field, both in cathodoluminescence and in transmission, with a linewidth of only 1 meV. Spectra calculated within the static limit of the Jahn-Teller effect (see Fig. 8 of Ref. Wolos04b, ) show a doublet which could fit the available spectra with a broad linewidth, but is ruled out by the spectra of the present study (Fig. 1). We could not obtain a better fit with the same model and different parameters. This leads us to re-examine the treatment of the Jahn-Teller effect in the case of (Ga,Mn)N.
We may note that an improvement of the available spectra for Cr2+ in ZnS and ZnSe recently lead Bevilacqua et al.Bevilacqua04 to propose a rather weak Jahn-Teller coupling to the modes (and not the mode) for the orbital triplet, and a stronger coupling to the mode for the orbital doublet (instead of no coupling). Both cases are more difficult to handle, and necessitate a more complete treatment of the vibronic statesBevilacqua04 which is beyond the scope of the present study.
Actually, we obtained a reasonable, although not perfect, agreement in the frame of a dynamic Jahn-Teller effect for both the triplet and the doublet, and not a static one for Cr in II-VI’s. This is not unexpected for two reasons: (i) the smaller value of the Huang-Rhys factor suggests that the Ham reduction factorHam65 should be smaller (this is but a hint, since the Huang-Rhys factor measured on spectra involves a vibrational overlap between a distorted harmonic oscillator of the triplet and a distorted harmonic oscillator of the doublet, while the reduction factors involve an overlap between two different harmonic oscillators of two states of the same multiplet); (ii) the trigonal crystal field due to the wurtzite structure tends to mix the three cubic states and, even if it is reduced by the Jahn-Teller effect, it may remain larger than the tetragonal component of strain fluctuations (which tends to stabilize one cubic distortion).
The effective hamiltonian which must be diagonalized within the vibronic multiplet thus reads:
where measures the trigonal component of the crystal field, is the projection of the pseudo-kinetic moment operator on the axis, is the Ham reduction factor which applies on all first-order contributions which are off-diagonal in the cubic basis, and the two last terms arise from second-order contributions of spin-orbit coupling. We assume that strain fluctuations have a negligible effect.
The case of the Jahn-Teller effect in the doublet is more complicated. The full treatment for Cr2+ in ZnS and ZnSeBevilacqua04 concludes that there is a significant Jahn-Teller effect, and that the excited levels which contribute to the absorption lines are comprised within a narrow energy range (less than 0.3 meV). We keep a simple description and assume a vibronic doublet, with an effective Hamiltonian parameterized by which contains a second-order contribution of spin-orbit coupling (arising from the spin-orbit coupling between the ground triplet and the orbital doublet), and the Zeeman effect. Using the operators and defined by HamHam69 within the orbital doublet, we have
| (2) |
The intensity of the transitions is proportional to the square of the matrix element of the electric dipole, which in a tetrahedral configuration is itself proportional to the matrix element of the appropriate projection of L. Spectra were calculated by adding all contributions:
| (3) |
For absorption, spans all calculated states of the multiplet, taking into account the thermal occupancy n(Ei)=e, and all calculated states of the 5E multiplet. The full width at half maximum of the Gaussian lineshape (equal to 0.8 meV) and its intensity were adjusted at 1.7 K and zero-field, and kept constant for all temperature and field values.
Absorption and emission spectra were calculated using the parameters listed in table 1. Fig. 6 shows the energy levels. The position of the second zero phonon line observed in cathodoluminescence 6 meV above the main line corresponds to the splitting of the orbital triplet by the trigonal crystal field. Calculated transmission spectra are shown by red lines in Fig. 2, 4 and 5. All lines contain several components: the main contributions are shown by arrows in Fig. 6. The observed ”jumps” are due to the crossing between the spin states of the ground orbital singlet. The -factors in the ground and excited multiplets are close to 2 so that the Zeeman shifts are parallel. The position in field of the crossings is directly related to the zero-field splitting, due to the combined effect of the trigonal crystal field and the spin orbit coupling. From Fig. 2 and 4, the model of Mn in the d4 configuration well describes the field and temperature dependence of the absorption spectra. The MCD at high magnetic field is also well described (Fig. 5).
The calculated spectra deviate from our experimental findings on two points. First, the intensity of the second zero-phonon line in emission (labeled by a diamond on Fig. 1) is about twice larger that experimentally observed in cathodoluminescence. Second, the calculated MCD is not dramatically reduced when the field is decreased : this is in good agreement if compared to the observation of Wołos et al. Wolos04b , but our observations (although with a low signal-to-noise ratio) tend to indicate a decrease and a change in shape of the MCD at small field. Note that the MCD is small indeed, and as such, may be sensitive to fluctuations of the trigonal crystal field, which can be different in a bulk crystal and an epitaxial layer.
| Cubic cristal field | 10Dq | 1407 meV |
|---|---|---|
| Trigonal cristal field | Vtri | 6.4 meV |
| Spin-orbit | 1.1 meV | |
| coupling | 0.6 meV | |
| of state | 0.02 meV | |
| of state | 0.015 meV | |
| Ham reduction factor | 0.1 |
In the perturbation treatment of the dynamic Jahn-Teller effect, the ratio / is equal to the Ham reduction factor: hence . As =e, the Huang-Rhys factor is S=1.5, in reasonable agreement with the values describing the intensity of the one-phonon replica in absorption and cathodoluminescence (0.7 and 1.9 respectively).
The other parameters, and , govern two components of the effective Hamiltonian which are built through symmetry arguments. They can be estimated as second-order terms in the perturbation scheme. For instance, we expect a second-order contribution of the spin-orbit coupling through the excited vibrational states of the ground triplet,Ham65 , another contribution through the doublet (the term of Ref. Herbich98, ), which is opposite in sign, and a third contribution from spin-orbit coupling through excited triplet states and spin-spin coupling.Vall74 Note however that this approach (perturbation treatment with coupling to a single mode) is oversimplified and a full calculation, possibly involving also a coupling to T2 mode Bevilacqua04 , would be necessary. This calculation, performed for (Zn,Cr)S and (Zn,Cr)Se, has even shown a stronger coupling to T2 mode than E mode.
Nevertheless, the description of the magneto-optical data has been improved by introducing a simple description of the dynamic Jahn-Teller effect.
It may be also useful to define a spin Hamiltonian acting within the
ground orbital singlet, which is separated by 6 meV from the doublet
by the trigonal field. Its form for a spin 2 can be found in
Ref. Graf03, ; Vall74, ; Krei96, . In a wurtzite
semiconductor, it remains :
| (4) |
As above, labels the axis of the wurtzite structures, and the cubic axes associated with the tetrahedron of nearest neighbors.
The energy levels of the ground state calculated with the effective Hamiltonian (1) can be well reproduced using the spin Hamiltonian (4), as shown by the red dotted lines in Fig. 6 calculated for the parameters given in table II.
| Mn3+ (3) S=2 | Mn2+ (3) S=5/2 | |
|---|---|---|
| 1.91 | 1.9994 | |
| 1.98 | 1.9994 | |
| 0.27 meV | -2.5 eV | |
| 0.03 meV | 0.07 eV |
We obtain -factors slightly smaller than 2 for both crystallographic directions (the orbital contribution is reduced by the Jahn-Teller effect), and a large axial anisotropy parameterized by , which dominates the fine structure. As for Mn2+, Graf03 the cubic anisotropy terms and are much smaller than the axial term . From the energy levels calculated in zero field with (1), a rough estimation of 0.03 meV can be obtained. The fine structure parameters have the same order of magnitude than the ones measured for Cr2+(3) ions in II-VI’s. Vall74 It should be noted that these parameters are much larger than the corresponding ones determined by EPR for Mn2+ ions in GaN (3 configuration).Graf03
We can also calculate the magnetization of isolated Mn ions. The result is not much different from the average magnetization calculated under the assumption of a static Jahn-Teller effect. Gosk As expected, it is strongly anisotropic, the c-axis being a hard axis.
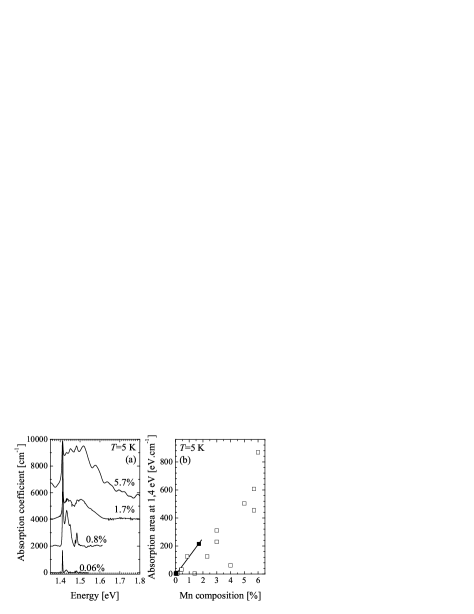
The very sharp spectra described above have been obtained on samples with a very low Mn content, typically less than 0.1%. Very similar spectra, although broadened, have been observed up to 1% Mn (see an example in Fig. 7a). The intensity of the whole structure is proportional to the Mn content determined by SIMS (straight line in Fig. 7b). We could follow the absorption band in the near infrared up to 6% Mn, using FTIR in zero field. The strong broadening considerably smooths the structure, and finally it becomes difficult to eliminate the effect of the interferences and to determine the lineshape with a reasonable accuracy (top of Fig. 7a). Nevertheless, the integrated area of the absorption band keeps increasing with the Mn content (Fig. 7b), showing that in most samples the majority of the Mn ions is in the d4 configuration.
IV Magneto-optical spectroscopy at the bandgap
Magnetic circular dichroism at the band gap edge has been studied with the magnetic field applied parallel to the c-axis. For these studies, 0.5 m thick (Ga,Mn)N epilayers have been grown on AlN MOCVD buffer layers deposited on sapphire. A 100 nm thick GaN buffer layer had to be grown first in order to adjust the growth conditions. Here we describe the results obtained on a sample with 1.7% Mn.
Fig. 8 shows the transmission for and polarized light, measured at 1.7 K and 11 T using a linear polarizer and a Babinet compensator set as a quarter retarding plate.
A broad absorption which rises with the Mn content is observed above 2.1 eV. Ferrand . It was attributed to a band-level transition.Wolos04a ; Graf02 At higher energy, the band edge rises in two steps: a weakly polarized one at low energy, which we shall ascribe to the (albeit thin) GaN buffer layer; a second one, with a clear circular polarization,Ferrand which we shall show to be due to the ”giant Zeeman effect” in (Ga,Mn)N. Note the unusual polarization which is observed, with the edge shifted to lower energy, in agreement with Ref. Ando, .
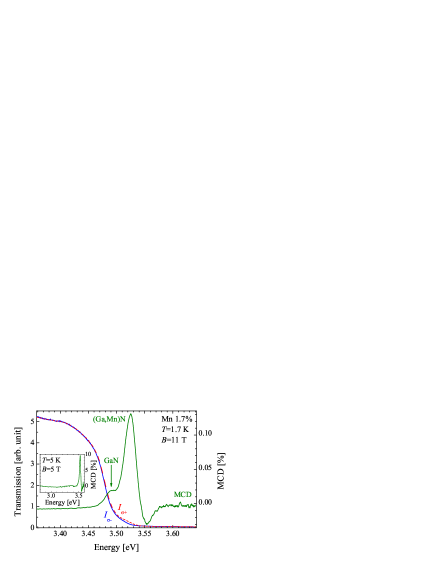
Fig. 8 shows also the MCD, . The broad absorption band observedFerrand between 2.1 and 3.5 eV shows no measurable polarization (inset of Fig. 8): MCD is only observed in resonance with the bandgap edge.

If we assume that the absorption edge rigidly shifts in opposite directions in and polarizations, the MCD can be expressed as: Ando
| (5) |
with the zero-field transmission measured with non-polarized light at energy , and the Zeeman splitting. In the absence of any identified excitonic structure, we shall use this expression to extract an effective Zeeman splitting . A minimal requirement is that the ratio MCD should not depend on the applied field. This is checked in Fig. 9 for the high-energy part of the MCD (3.50 to 3.55 eV) observed at different values of the applied field, which indeed exhibits a constant shape, so that we can extract a value of . This value is plotted in Fig. 10, together with the value measured on a similar layer of pure GaN. In GaN, is linear in field and does not depend on the temperature. In (Ga,Mn)N, it increases non-linearly with the applied field, and decreases if the temperature increases. Above 100 K, it assumes the same value as in pure GaN. Note also in Fig. 9 that the low energy part of the MCD spectrum, at 3.49 eV, keeps increasing at high field: this part is actually characterized by a different effective Zeeman splitting (not shown), equal to that of GaN. Hence we attribute this signal to the thin GaN buffer layer.
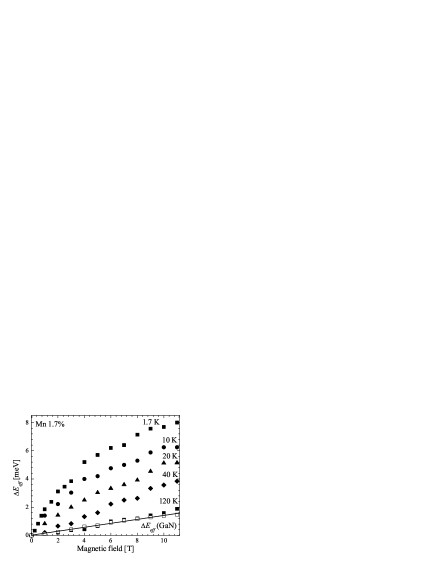
If the effective Zeeman splitting we observe contains a contribution due to the giant Zeeman effect, i.e., to the interaction between the bands of the semiconductor and the localized spins of Mn, it is expected to be related to the magnetization of the Mn system, and to exhibit a specific dependence on the Mn content and on the field and temperature. This we check now.
Fig. 11a shows MCD spectra at 1.7 K and 11 T for (Ga,Mn)N layers with different values of the Mn content, from 0 to 5%. The MCD peak shifts to the blue upon increasing the Mn content. It shows a strong resonance which markedly increases up to 2%, then one observes a broadening of the band edge and of the MCD signal, and a decrease of the MCD peak intensity. However, the effective Zeeman splitting keeps increasing, as shown in Fig. 11b, which displays the change of due to the incorporation of Mn, measured at 1.7 K and 11 T. The dependence on is sublinear, and actually quite close to the variation of the density of free spins, , which would be expected if nearest-neighbor Mn-Mn pairs are blocked by a strong antiferromagnetic interaction. We shall come back to this point later.
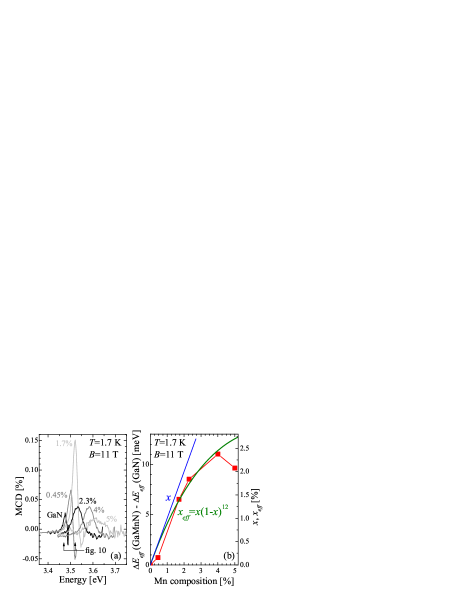
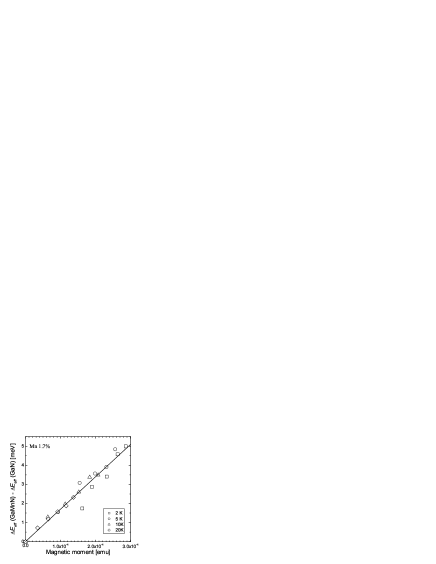
Fig. 10 suggests a paramagnetic-like behavior of the Mn-induced change of for the 1.7% Mn layer. For this sample, the giant Zeeman splitting can be determined by subtracting the Zeeman splitting of the reference GaN layer. Fig. 12 shows the giant Zeeman splitting, plotted versus the magnetic moment, measured by SQUID with the field applied along the -axis. In the whole temperature (2K-20K) and field range (0-5T), the giant Zeeman splitting is found to be proportional to the magnetization. This, and the dependence on the Mn content, clearly evidence a coupling between the s,p-electrons of the host semiconductor and the d-electrons localized on the Mn3+ ions.
Of course, a determination of the strength of the spin-carrier coupling would be highly valuable. This is a rather simple question in the case of Mn-based II-VI DMS’s, involving spins of high symmetry (Mn2+) in a zinc-blende semiconductor with moderate excitonic effects. In the case of a magnetic impurity, the coupling involves not only the usual spin-spin term, but also an orbital coupling which has been particularly studied for Cr2+ in ZnSe.Bhattacharjee ; Bhattacharjee1 We may expect this term to be quenched by the Jahn-Teller factor. The influence of the excitonic structure however cannot be neglected, as shown by the analysis of the giant Zeeman effect measured in (Zn,Co)O,Pacuski another wide-gap DMS with the wurtzite structure and a small spin-orbit coupling, or by the analysis of stress effects in GaN epilayers.Gil In both cases, the electron-hole exchange interaction leads to anticrossings of the various excitons (, and ) of the wurtzite structure, so that the shift of the exciton can be quite different from the shift of the involved carriers.
Because of the broadening of the excitons, and of the overlap with the contributions from the GaN buffer layer, excitonic transitions are not observed in the present layers, neither in reflectivity nor in transmission. Hence a quantitative analysis is out of reach. Nevertheless, the MCD observed in transmission can be tentatively attributed to the exciton of lowest energy, which in GaN is the so-called A exciton of the wurtzite structure.Gil The giant Zeeman splitting of the corresponding electron-hole pair, in the Faraday configuration with the field along the -axis, isPacuski
| (6) |
where and are the s- and p-d coupling constants, respectively, is the spin density, and is the spin component of Mn along the -axis (=-2 at saturation). From the spectra shown in Fig. 8, a negative sign of is inferred. This is opposite to what was found in most DMS’s studied so far, but in Cr-doped II-VI semiconductors, Mac ; Herbich98 another realization of the configuration. As is usually positive, and small with respect to , that means a ferromagnetic interaction between the holes in the valence band and the localized spins, as it has been predicted for DMS’s with a less than half filled d-shell.Bhattacharjee1
Finally, it should be stressed that, in the absence of a complete identification of the various excitons, a quantitative analysis of the giant Zeeman splitting would be adventurous. In particular, we expect the excitonic shifts to show a complex dependence on the magnetization, with anticrossings as soon as the exchange splitting of the bands becomes of the order of the zero-field excitonic splitting.Gil ; Pacuski That will cause the MCD to saturate, which could contribute to the saturation observed in Fig.11b as a function of the Mn content, or in Fig.10 as a function of the applied field (while the magnetization calculated for a single Mn ion is still far from saturation).Gosk
V Conclusion
A detailed study, by magneto-optical spectroscopy in the near infrared, of wurtzite (Ga,Mn)N layers grown by plasma-assisted molecular beam epitaxy, confirms the substitution of Ga by Mn with the configuration (Mn3+). Very sharp spectra obtained on samples with a low Mn content, and cathodoluminescence spectra, are reasonably well understood using a crystal field model with a dynamic (not static) Jahn-Teller effect.
Samples with a slightly larger Mn content show a MCD signal in transmission, resonant with the bandgap edge. The effect increases with the Mn content and behaves as the measured magnetization. This evidences a coupling between the Mn3+ d-electrons and the carriers of the host semiconductor (”giant Zeeman effect”) ; the sign of the MCD agrees with a ferromagnetic p-d interaction.
Acknowledgements.
This work was supported by the E. U. contract FENIKS (G5RD 2001 00535). We thank Edith Bellet-Amalric for the structural characterization of the samples.References
- (1) T. Dietl, H. Ohno, F. Matsukura, J. Cibert, and D. Ferrand, Science 287, 1019 (2000).
- (2) H. Hori, S. Sonoda, T. Sasaki, Y. Yamamoto, S. Shimizu, K. Suga, and K. Kindo, Physica B 324, 142 (2002).
- (3) V. A. Chitta, J. A. H. Coaquira, J. R. L. Fernandez, C. A. Duarte, J. R. Leite, D. Schikora, D. J. As, K. Lischka, and E. Abramof, Appl. Phys. Lett. 85, 3777 (2004).
- (4) R. Giraud, S. Kuroda, S. Marcet, E. Bellet-Amalric, X. Biquard, B. Barbara, D. Fruchart, D. Ferrand, J. Cibert, and H. Mariette, J. Magn. Magn. Mater. 272-276, 1557 (2004).
- (5) A. Wołos, M. Palczewska, M. Zajac, J. Gosk, M. Kaminska, A. Twardowski, M. Bockowski, I. Grzegory, and S. Porowski, Phys. Rev. B 69, 115210 (2004).
- (6) L. Kronik, M. Jain, and J. R. Chelikowsky, Phys. Rev. B 66, 041203(R) (2002).
- (7) E. Kulatov, H. Nakayama, H. Mariette, H. Ohta, and Yu. A. Uspenskii, Phys. Rev. B 66, 045203 (2002).
- (8) B. Sanyal, O. Bengone, and S. Mirbt, Phys. Rev. B 68, 205210 (2003).
- (9) Z. S. Popovic, S. Satpathy, and W. C. Mitchel, Phys. Rev. B 70, 161308(R) (2004).
- (10) M. Wierzbowska, D. Sánchez-Portal, and S. Sanvito, Phys. Rev. B 70, 235209 (2004).
- (11) A. Titov, X. Biquard, D. Halley, S. Kuroda, E. Bellet-Amalric, H. Mariette, J. Cibert, A. E. Merad, G. Merad, M. B. Kanoun, E. Kulatov, and Yu. A. Uspenskii, Phys. Rev. B 72, 115209 (2005).
- (12) J. I. Hwang, Y. Ishida, M. Kobayashi, H. Hirata, K. Takubo, T. Mizokawa, A. Fujimori, J. Okamoto, K. Mamiya, Y. Saito, Y. Muramatsu, H. Ott, A. Tanaka, T. Kondo, and H. Munekata Phys. Rev. B 72, 085216 (2005).
- (13) E. Sarigianidou et al., unpublished.
- (14) A. Wołos, A. Wysmolek, M. Kaminska, A. Twardowski, M. Bockowski, I. Grzegory, S. Porowski, and M. Potemski, Phys. Rev. B 70, 245202 (2004).
- (15) B. Han, R. Y. Korotkov, and B. W. Wesselsa, and M. P. Ulmer, Appl. Phys. Lett. 84, 5320 (2004).
- (16) S. V. Novikov, K. W. Edmonds, A. D. Giddings, K. Y. Wang, C. R. Staddon, R. P. Campion, B. L. Gallagher, and C. T. Foxon, Semicond. Sci. Technol. 19, L13 (2004).
- (17) K. W. Edmonds, S. V. Novikov, M. Sawicki, R. P. Campion, C. R. Staddon, A. D. Giddings, L. X. Zhao, K. Y. Wang, T. Dietl, C. T. Foxon and B. L. Gallagher, Appl. Phys. Lett. 86, 152114 (2005).
- (18) R. Y. Korotkov, J. M. Gregie, and B. W. Wesselsa, Appl. Phys. Lett. 80, 1731 (2002).
- (19) T. Graf, M. Gjukic, M. S. Brandt, and M. Stutzmann, Appl. Phys. Lett. 81, 5159 (2002).
- (20) T. Graf, M. Gjukic, M. Hermann, M. S. Brandt, M. Stutzmann, L. Görgens, J. B. Philipp, and O. Ambacher, J. Appl. Phys. 93, 9697 (2003).
- (21) R. Giraud, S. Kuroda, S. Marcet, E. Bellet-Amalric, X. Biquard, B. Barbara, D. Fruchart, D. Ferrand, J. Cibert, and H. Mariette, Europhys. Lett. 65, 553 (2004).
- (22) G. Yu, G. Wang, H. Ishikawa, M. Umeno, T. Soga, T. Egawa, J. Watanabe, and T. Jimbo, Appl. Phys. Lett 70, 3209 (1997).
- (23) W. Gebicki, J. Strzeszewski, G. Kamler, T. Szyszko, and S. Podsiadlo, Appl. Phys. Lett. 76, 3870 (2000).
- (24) H. Harima, J. Phys.: Condensed Matter 16, S5653 (2004).
- (25) N. Hasuike, H. Fukumura, H. Harima, K. Kisoda, M. Hashimoto, Y. K. Zhou and H. Asahi, J. Phys.: Conden. Matter 16, S5811 (2004).
- (26) J. T. Vallin, G. A. Slack, S. Roberts, and A. E. Hughes, Phys. Rev. B 2, 4313 (1970).
- (27) Y. Tanabe and S. Sugano, J. Phys. Soc. Jpn 9, 753 (1954).
- (28) A. Abragam and B. Bleaney, Electron Paramagnetic Resonance of Transition Ions (Clarendon, Oxford, 1970).
- (29) F. S. Ham, Phys. Rev. 138, A1727 (1965).
- (30) M. Herbich, W. Mac, A. Twardowski, K. Ando, Y. Shapira, and M. Demianiuk, Phys. Rev. B, 58 1912 (1998).
- (31) G. Bevilacqua, L. Martinelli, E. E. Vogel, and O. Mualin, Phys. Rev. B 70, 075206 (2004).
- (32) J. T Vallin and G. D. Watkins, Phys. Rev. B 9, 2051 (1974).
- (33) F. S. Ham, Phys. Rev. 166, 307 (1968).
- (34) J. Kreissl,W. Ulrici, M. El-Metoui, A. M. Vasson, A. Vasson, and A. Gavaix, Phys. Rev. B 54, 10508 (1996).
- (35) J. Gosk, M. Zajac, A. Wołos, M. Kaminska, A. Twardowski, I. Grzegory, B. Bockowski, and S. Porowski, Phys. Rev. B 71, 094432 (2005).
- (36) D. Ferrand, S. Marcet, W. Pacuski, E. Gheeraert, P. Kossacki, J. A. Gaj, J. Cibert, C. Deparis, H. Mariette, and C. Morhain, J. Superconductivity 18, 15 (2005). Please note that the sign of the MCD in this report has to be corrected.
- (37) K. Ando, Appl. Phys. Lett. 82, 100 (2003).
- (38) A. K. Bhattacharjee, Phys. Rev. B 46, 5266 (1992).
- (39) A. K. Bhattacharjee, Phys. Rev. B 4, 13987 (1994).
- (40) W. Pacuski, D. Ferrand, J. Cibert, C. Deparis, J. A. Gaj, P. Kossacki, and C. Morhain, Phys. Rev. B 73, 035214 (2006).
- (41) B. Gil and O.Briot, Phys. Rev. B 64, 201310 (2001).
- (42) W. Mac, A. Twardowski and M. Demianiuk, Phys. Rev. B 54, 5528 (1996).