Optical characteristics of single wavelength-tunable InAs/InGaAsP/InP(100) quantum dots emitting at 1.55 m
Abstract
We have studied the emission properties of individual InAs quantum dots (QDs) grown in an InGaAsP matrix on InP(100) by metal-organic vapor-phase epitaxy. Low-temperature microphotoluminescence spectroscopy shows emission from single QDs around 1550 nm with characteristic exciton-biexciton behavior, and a biexciton antibinding energy of more than 2 meV. Temperature-dependent measurements reveal negligible optical-phonon induced broadening of the exciton line up to 50 K, and emission from the exciton state clearly persists above 70 K. Furthermore, we find no measurable polarized fine structure splitting of the exciton state within the experimental precision. These results are encouraging for the development of a controllable photon source for fiber-based quantum information and cryptography systems.
pacs:
81.07.Ta, 78.67.Hc, 81.15.Gh, 78.55.CrThere is currently considerable interest in the development of self-assembled quantum dot (QD) structures for novel telecommunication applications, such as low-threshold laserssugawara05 and non-classical light sources for quantum cryptography.michler00 In the latter case, an optical fiber-based system requires the development of an efficient single-photon source operating in the fiber transmission bands above 1260 nm. QD structures grown by metalorganic vapor-phase epitaxy (MOVPE) are very attractive commercially due to the high growth rates achievable and the potential for monolithic integration into existing devices. Recently we have reported on the photoluminescence (PL) characteristics of MOVPE grown InAs/InGaAs single QDs emitting at 1.3 m.cade05 For longer wavelength applications InAs/InP QDs are normally used; however, due to the small lattice mismatch careful control of the growth conditions is required to realize emission around 1.55 m.paranthoen01 ; kawaguchi04 ; pyun04 To date, there have been only a few investigations into single QDs emitting in the important C-band region between 1.53–1.57 m; these have used selective area chemical-beam epitaxy,chithrani04 and very recently MOVPE techniques.takemoto04 ; saint06 However, in the latter cases the QDs were not optimized for low temperature device applications, and suffered from a broad luminescence spectrum and low emission intensity at 1.55 m relative to that at shorter wavelengths.
Here, we report on the emission properties of InAs QDs embedded in an InGaAsP matrix by MOVPE. Wavelength optimization has been achieved via the insertion of ultra-thin GaAs interlayers. We present low-temperature PL spectra from a single QD with an emission wavelength around 1550 nm. Power-dependent measurements clearly reveal the formation of an exciton-biexciton system; the biexciton is found to be antibinding with an emission energy of more than 2 meV relative to the exciton. The exciton linewidth shows negligible optical phonon induced broadening up to 50 K. In addition, emission from discrete electronic states is seen clearly above 70 K, which suggests that these QDs may be used as a single photon source operating at liquid-nitrogen temperatures.
The QD sample was grown at 500 ∘C by low-pressure MOVPE on an InP (100) substrate misoriented 2∘ toward (110). A 100 nm InP buffer layer and 100 nm lattice-matched InGaAsP layer ( m) were deposited, followed by 2 monolayers (MLs) of GaAs (growth rate 0.16 ML/s). The QDs were formed from 3 MLs of InAs, with a 5 second growth interruption and an upper 100 nm InGaAsP layer. On top of this second InGaAsP layer, growth of the GaAs interlayer and InAs QDs was repeated at the same conditions for atomic force microscopy (AFM) measurements; from these we obtain a QD sheet density of cm-2. The GaAs interlayer suppresses As/P exchange during QD growth, thus reducing the QD height and blue-shifting the emission wavelength by a controllable amount. A detailed description of the sample growth procedure and the macroscopic optical characteristics are published elsewhere.anant05
To obtain single dot spectroscopy, mesa structures were fabricated by electron-beam lithography and dry etching with lateral sizes between 200 nm and 2 m. Micro-PL measurements were taken using a continuous-wave (CW) Ar+ laser (488 nm) focused to a 3 m spot; the luminescence was dispersed in a 0.5 m spectrometer and detected with a nitrogen cooled InGaAs photodiode array (instrument resolution eV). The sample temperature was controlled using a continuous-flow He cryostat.
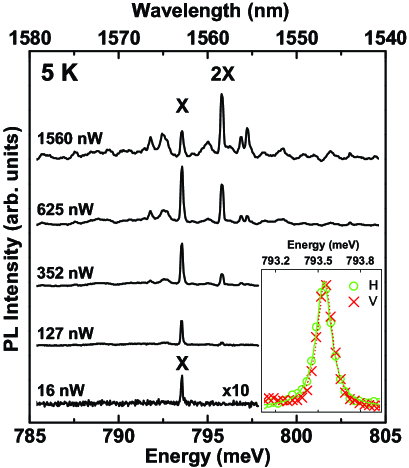
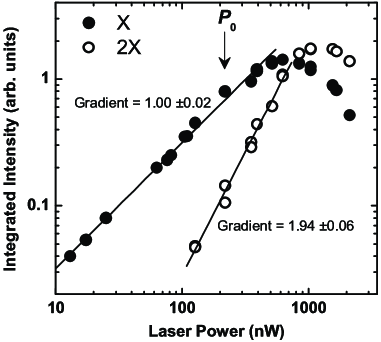
PL spectra from a 500 nm mesa at 5 K are shown in Fig. 1 for various excitation powers. At the lowest power there is a single sharp emission line X in the spectral window between 1525–1580 nm. With increasing power additional lines appear in the spectrum; in particular the line 2X develops superlinearly 2.3 meV above the emission energy of X. The lines X and 2X are attributed to recombination from the neutral exciton and biexciton states, respectively, of a single QD. This assignment has been confirmed by plotting the integrated intensities of these lines as a function of laser power, as shown in Fig. 2: fits to the data give almost ideal linear and quadratic behavior for the X and 2X lines respectively, which suggests a low scattering rate by impurities and defects for this particular dot.nakayama95 The other spectral lines observed at higher powers most likely originate from charged- and multi-exciton states.cade06 From a study of other QDs on the sample, we find similar exciton-biexciton behavior with 2X recombination energies in the range 2-5 meV above the X line. This ‘antibinding’ of the biexciton state has been observed previously in InAs/GaAs dots and results from a reduction in exchange and correlation effects between the two localized excitons relative to the repulsive direct Coulomb interaction.rodt03 This effect is consistent with the small dot aspect ratio (height/base diameter) of 0.09 expected from the growth conditions.anant05
The inset in Fig. 1 shows the X line resolved into horizontally and vertically polarized components. Lorentzian fits to the data suggest a fine-structure splitting of 10 eV, which is smaller than the instrument precision and fitting error. This indistinguishability is an important issue in the production of polarization entangled photon pairs for quantum information applications.benson00 Furthermore, these dots show a very similar emission intensity under pulsed (80 MHz) excitation from a Ti:sapphire laser which is necessary for controlled generation of single photons.
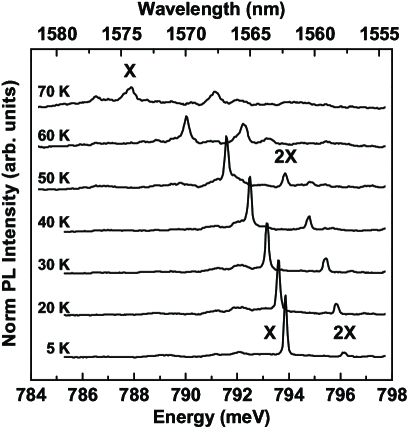
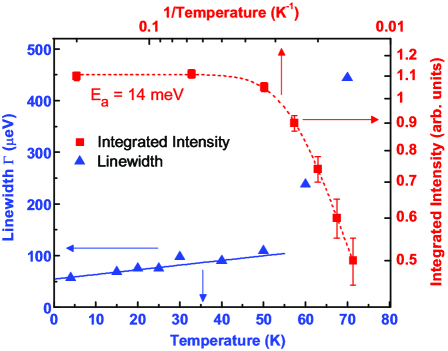
Figure 3 shows temperature-dependent PL spectra from the same QD studied in Fig. 1, normalized to the integrated intensity of the X line. The exciton emission intensity and linewidthnote1 determined from these spectra are plotted in Fig. 4; the exciton line appears thermally stable over the measured temperature range, with the intensity at 70 K only dropping to approximately half of the maximum value. A fit to the data gives a thermal activation energy of 14 meV. We have observed similar behavior in other QDs on the sample, with well resolved emission from the exciton state at 77 K.
At low temperatures the exciton-optical phonon interaction is negligible and the X linewidth has a linear temperature dependence due to acoustic phonon scattering: , where is the linewidth at 0 K. A linear fit of the data in Fig. 4 gives 0.2 eV/K, and eV. The value of is similar to those previously reported for other QD systems,besombes01 ; kammerer02 and significantly smaller than that of a quantum well system due to the absence of final states for scattering. Above 50 K there is a sharp increase in linewidth due to optical phonon scattering, and the line shape strongly deviates from a Lorentzian profile.besombes01 From different QDs we find similar values for , but large variations in ; this latter effect is most likely due to the influence of charge fluctuations on the mesa sidewalls when using nonresonant laser excitation.bayer02a
In conclusion, we have studied the emission properties of individual InAs/InGaAsP QDs grown on InP(100) by MOVPE; the insertion of a thin GaAs interlayer has enabled tuning of the QD emission wavelength to 1.55 m for telecom applications. We observe almost ideal exciton-biexciton behavior at low temperatures, with a biexciton antibinding energy of more than 2 meV. The exciton line shows negligible broadening from optical phonon scattering up to 50 K and appears thermally stable at higher temperatures, with clearly resolvable emission above 70 K. Furthermore, there is no measurable fine structure splitting within the experimental precision. These results suggest that QDs fabricated with this growth technique may be suitable as an on-demand single photon source at liquid nitrogen temperatures, for fiber-based quantum information and cryptography systems.
The authors are grateful to T. Segawa at NTT Photonics Laboratories for etching the mesa structures. This work was partly supported by the National Institute of Information and Communications Technology (NICT).
References
- (1) M. Sugawara, N. Hatori, M. Ishida, H. Ebe, Y. Arakawa, T. Akiyama, K. Otsubo, T. Yamamoto, and Y. Nakata, J. Phys. D: Appl. Phys. 38, 2126 (2005).
- (2) P. Michler, A. Kiraz, C. Becher, W. V. Schoenfeld, P. M. Petroff, L. Zhang, E. Hu, and A. Imamolu, Science 290, 2282 (2000).
- (3) N. I. Cade, H. Gotoh, H. Kamada, T. Tawara, T. Sogawa, H. Nakano, and H. Okamoto, Appl. Phys. Lett. 87, 172101 (2005).
- (4) C. Paranthoen, N. Bertru, O. Dehaese, A. Le Corre, S. Loualiche, B. Lambert, and G. Patriarche, Appl. Phys. Lett. 78, 1751 (2001).
- (5) K. Kawaguchi, M. Ekawa, A. Kuramata, T. Akiyama, H. Ebe, M. Sugawara, and Y. Arakawa, Appl. Phys. Lett. 85, 4331 (2004).
- (6) S. H. Pyun, S. H. Lee, I. C. Lee, H. D. Kim, Weon G. Jeong, J. W. Jang, N. J. Kim, M. S. Hwang, D. Lee, J. H. Lee, and D. K. Oh, J. Appl. Phys. 96, 5766 (2004).
- (7) D. Chithrani, R. L. Williams, J. Lefebvre, P. J. Poole, and G. C. Aers, Appl. Phys. Lett. 84, 978 (2004).
- (8) K. Takemoto, Y. Sakuma, S. Hirose, T. Usuki, and N. Yokoyama, Jpn. J. Appl. Phys., Part 2 43, L349 (2004).
- (9) G. Saint-Girons, N. Chauvin, A. Michon, G. Patriarche, G. Beaudoin, G. Bremond, C. Bru-Chevallier, and I. Sagnes, Appl. Phys. Lett. 88, 133101 (2006).
- (10) S. Anantathanasarn, R. Nötzel, P. J. van Veldhoven, T. J. Eijkemans, and J. H. Wolter, J. Appl. Phys. 98, 013503 (2005).
- (11) M. Nakayama, K. Suyama, and H. Nishimura, Phys. Rev. B 51, 7870 (1995).
- (12) N. I. Cade, H. Gotoh, H. Kamada, H. Nakano, and H. Okamoto, Phys. Rev. B 73, 115322 (2006).
- (13) S. Rodt, R. Heitz, A. Schliwa, R. L. Sellin, F. Guffarth, and D. Bimberg, Phys. Rev. B 68, 035331 (2003).
- (14) O. Benson, C. Santori, M. Pelton, and Y. Yamamoto, Phys. Rev. Lett. 84, 2513 (2000).
- (15) We plot the corrected linewidth , where is the measured linewidth and the instrument resolution.
- (16) L. Besombes, K. Kheng, L. Marsal, and H. Mariette, Phys. Rev. B 63, 155307 (2001).
- (17) C. Kammerer, C. Voisin, G. Cassabois, C. Delalande, Ph. Roussignol, F. Klopf, J. P. Reithmaier, A. Forchel, and J. M. Gérard, Phys. Rev. B 66, 041306(R) (2002).
- (18) M. Bayer and A. Forchel, Phys. Rev. B 65, 041308 (2002).