Pressure dependence of the Shubnikov-de Haas oscillation spectrum of ”-(BEDT-TTF)4(NH4)[Cr(C2O4)3]DMF
Abstract
The Shubnikov-de Haas (SdH) oscillation spectra of the ”-(BEDT-TTF)4(NH4)[Cr(C2O4)3]DMF organic metal have been studied in pulsed magnetic fields of up to either 36 T at ambient pressure or 50 T under hydrostatic pressures of up to 1 GPa. The ambient pressure SdH oscillation spectra can be accounted for by up to six fundamental frequencies which points to a rather complex Fermi surface (FS). A noticeable pressure-induced modification of the FS topology is evidenced since the number of frequencies observed in the spectra progressively decreases as the pressure increases. Above 0.8 GPa, only three compensated orbits are observed, as it is the case for several other isostructural salts of the same family at ambient pressure. Contrary to other organic metals, of which the FS can be regarded as a network of orbits, no frequency combinations are observed for the studied salt, likely due to high magnetic breakdown gap values or (and) high disorder level evidenced by Dingle temperatures as large as 7 K.
pacs:
71.18.+yFermi surface: calculations and measurements; effective mass, g factor and 71.20.Rv Polymers and organic compounds and 72.20.MyGalvanomagnetic and other magnetotransport effects1 Introduction
The family of isostructural monoclinic charge-transfer salts ”-(BEDT-TTF)4(A)[M(C2O4)3]Solv have been widely studied in the past decade Cor04 (1). In the above formula, BEDT-TTF stands for bis(ethylenedithio)tetrathiafulvalene, A is a monovalent cation (A = H3O+, K+, NH4+, etc.), M is a trivalent cation (M = Cr3+, Fe3+, Ga3+, etc.) and Solv is a solvent molecule such as benzonitrile (C6H5CN), dimethylformamide (C3H7NO), nitrobenzene (C6H5NO2) and pyridine (C5H5N), labelled hereafter BN, DMF, NB and P, respectively. In the following, the compounds belonging to this family are referred to as A-MSolv. The interest in this family of compounds has been motivated by the observation of superconductivity at ambient pressure in the H3O-FeBN salt (Tc = 8.5 K) Gr95 (2). Later on, other superconducting salts with magnetic ions were reported for this family Ma97 (3, 4). Besides, a metallic and ferromagnetic ground state was achieved in the (BEDT-TTF)3[MnCr(C2O4)3] compound Co00 (5). Contrary to the orthorhombic compounds with the same generic formula and ” packing, which are semiconductors Ku95 (6, 7), all the monoclinic salts of this family exhibit metallic conductivity around room temperature. Nevertheless, a large variety of temperature-dependent behaviours and various ground states are observed which might be connected to details of their electronic structure.
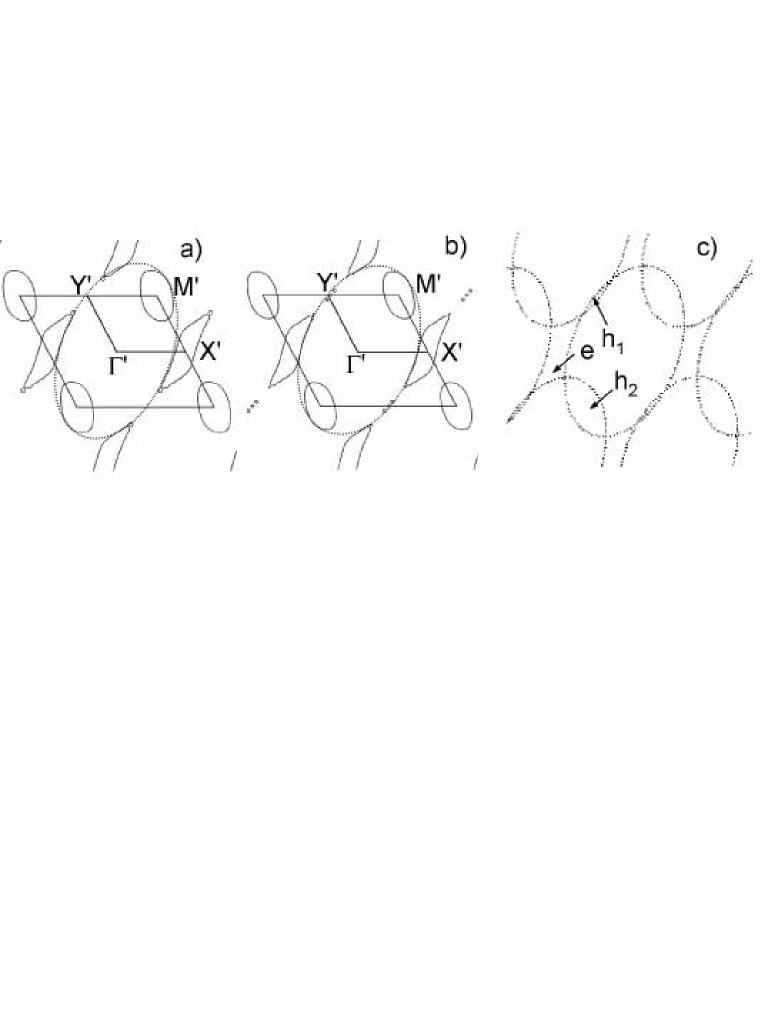
According to band structure calculations Pr03 (8), the Fermi surface (FS) of NH4-FeDMF and (NH4)0.75K0.25-CrDMF salts originates from quasi two-dimensional (2D) hole elliptic orbits, labelled in the following, whose cross section is equal to the first Brillouin zone (FBZ) area (see Fig. 1). In the case of NH4-FeDMF, these orbits intersect along the direction 111In Ref. Pr03 (8), the FS is considered on the basis of a unit cell with vectors a’ = a, b’ = (a + b)/2 and c’ = c. This unit cell contains four BEDT-TTF molecules., leading to one electron and one hole compensated orbit with a cross section area of 8.8 percent of the FBZ one. Analogous FS topology has also been reported for the superconducting H3O-FeBN salt Ku95 (6). These calculations are in agreement with the Shubnikov-de Haas (SdH) oscillation spectrum of the H3O-GaNB salt for which only one frequency was reported Ba04 (9). Nevertheless, as pointed out in Ref. Pr03 (8), the orbits may also intersect in the direction leading to one or more additional orbits around the Y’ point of the FBZ [see Figs. 1(b) and (c)]. This picture holds for the NH4-FeDMF salt, for which the SdH oscillation spectra can be interpreted on the basis of three compensated orbits with cross section areas of 1.2, 4.8 and 6 percent of the FBZ area that are therefore connected by a linear combination Au04 (10). However, the FS of other compounds of this family may be more complicated since four frequencies corresponding to orbit’s area in the range 1.1 to 8.5 percent of the FBZ area were reported for the H3O-MP (M = Cr, Ga, Fe) salts Co04 (11). In this latter case, a density wave ground state, responsible for the observed strongly non-monotonous temperature dependence of the resistance, has been invoked in order to account for this discrepancy. However, only two frequencies were observed for the H3O-MNB (M = Cr, Ga) salts Ba05 (12). Additional combination frequencies, typical of coupled 2D orbits networks, linked to the field-induced chemical potential oscillation mu (13) and (or) field-dependent Landau level broadening LLB (14) were also reported Au04 (10, 11).
An important feature of the oscillatory spectra of most of these compounds is the strong field-damping factor. Indeed, Dingle temperature values (TD) in the range 2 K to 4 K were reported for e.g. H3O-MP Co04 (11) which is the signature of a significant disorder. This feature is in line with structural data Ak02 (15, 16) which indicate that terminal ethylene groups of some of the BEDT-TTF molecules exhibit a large solvent-dependent positional disordering. As for the compounds with the DMF solvent, the DMF molecules themselves are also disordered Pr03 (8). As a matter of fact, even larger Dingle temperatures (TD 4 K to 6 K) were reported for the NH4-FeDMF salt Au04 (10).
In order to get some insight in possible connection between the FS topology and the ground state, we report on the pressure dependence of the SdH spectrum of the NH4-CrDMF salt which, contrary to the above mentioned NH4-FeDMF salt exhibits a metallic conductivity down to about 10 K. Even though the overall behaviour of the resistivity as the temperature varies is unaffected by applied pressures up to 1 GPa, which suggests that the ground state remains unchanged in this pressure range, it is shown that the FS topology is very sensitive to applied pressure.
2 Experimental
The crystals studied, labelled 1 to 3 in the following, were elongated hexagonal platelets with approximate dimensions (0.6 0.4 0.25) mm3 for crystal 2 and (0.4 0.2 0.1) mm3 for crystals 1 and 3, the largest faces being parallel to the conducting ab-plane. Magnetoresistance experiments were performed in pulsed magnetic field of up to 36 T for crystals 1 and 2 and 50 T for crystal 3, with pulse decay duration of 0.78 s and 0.32 s, respectively, in the temperature range from 2 K to 4.2 K. For crystals 1 and 3, the magnetic field was applied normal to the conducting plane whereas a sample holder rotating about an axis perpendicular to the magnetic field allowed a change of the direction of the magnetic field with respect to the conducting plane for crystal 2. Crystal 3 was studied under hydrostatic pressure in an anvil cell designed for isothermal measurements in pulsed magnetic fields Na01 (17). The pressure applied at room temperature was estimated from the primary pressure value calibrated beforehand with a manganin piezoresistive sensor. The maximum pressure reached in the experiments was 1 GPa at low temperature, taking into account a pressure decrease of 0.1 GPa on cooling. Electrical contacts to the crystal were made using annealed platinum wires of 20 m in diameter glued with graphite paste. Alternating current (1 to 17 A, 20 kHz) was injected parallel to the c* direction (interlayer configuration). A lock-in amplifier with a time constant of 100 s was used to detect the signal across the potential contacts.
Analysis of the oscillatory magnetoresistance is based on discrete Fourier transforms and direct fittings of the magnetoresistance data. Discrete Fourier transforms are calculated with a Blackman window in a given field range from to . The absolute value of the amplitude () of the Fourier component with frequency is determined, for a mean field value , from the amplitude of the discrete Fourier transform () as . The direct fitting method was the following: a low order polynomial (typically 2th order) together with one Fourier component with initial frequency close to one of the frequencies detected in experimental data is introduced. In the case where residuals still exhibit oscillatory features, a subsequent oscillation is introduced with a frequency close to one of the main frequencies detected in the residuals. The procedure is repeated until either not any oscillatory component can be detected in the residuals or the oscillatory component corresponds to high order harmonics of already detected frequencies. Finally, the order of the polynomial, which account for the background, is increased up to at most the 4th order. It has been checked that neither the detected frequencies depend appreciably on the order in which the various components are introduced in the fittings nor the magnitude of the background significantly depends on the order of the polynomial.
3 Results and discussion
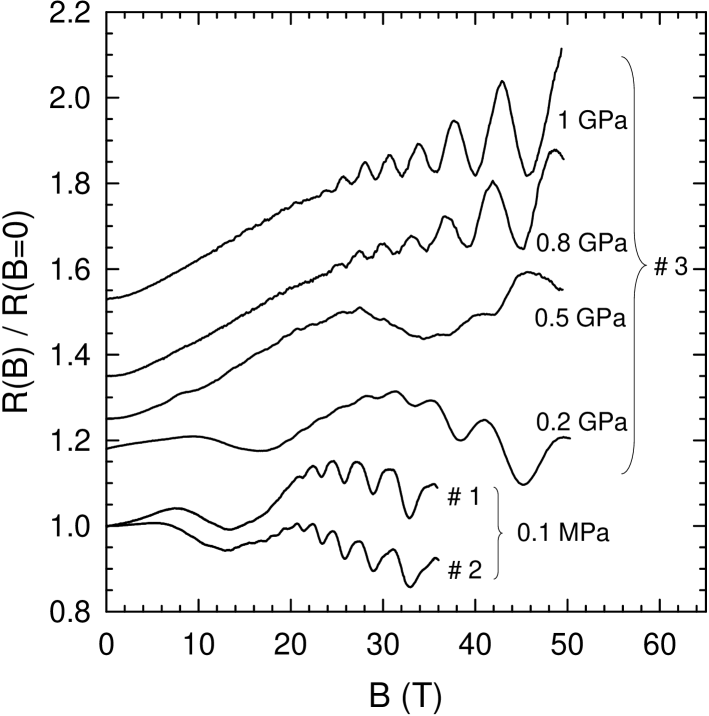
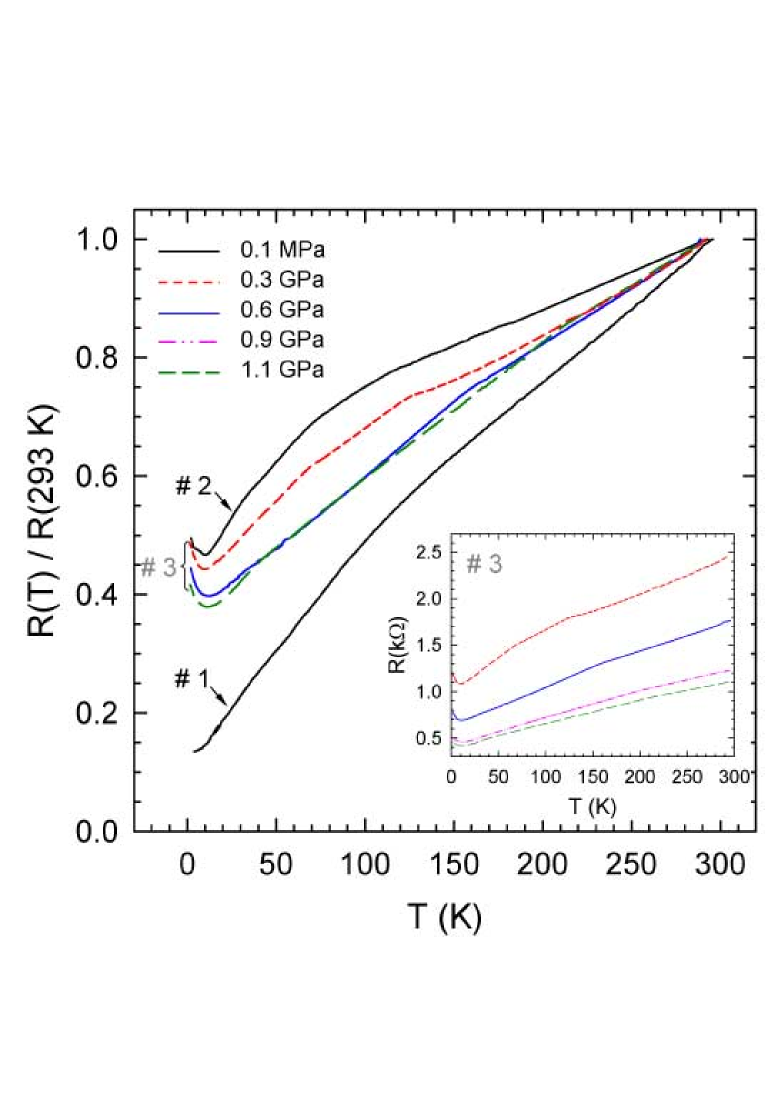
The zero-field temperature dependence of the resistance of the studied crystals is displayed in Figure 2. A metallic behaviour is observed down to about 10 K in the pressure range explored. The crystal-dependent resistance ratio R(10 K)/R(293 K) is in the range 0.15 0.5. This behaviour, which is in agreement with the data of Pr03 (8), is at variance with the strongly non-monotonic temperature dependence reported for other salts such as H3O-MSolv (M = Ga, Cr; Solv = NB, P) Ba04 (9, 15), NH4-FeDMF Au04 (10) or H3O-MP (M = Ga, Fe) Co04 (11). In the latter case, a metal-density wave transition has been suggested to occur around 150 K in order to account for the observed behaviour. Below 10 K, a small resistance rise is observed that might be linked to disorder. Although a significant pressure dependence of the resistance is observed (see the inset of Figure 2) in the whole temperature range explored [e.g. dln(R)/dP 1 GPa-1 at room temperature], the applied pressure has only a minor effect on the resistance ratio. Magnetoresistance data at 2 K are presented in Figure 3 for various pressures. In addition to magnetoresistance oscillations, a non-monotonous behaviour which appears as a slow undulation is observed up to 0.6 GPa.
In the following, we concentrate first on the ambient pressure SdH oscillation spectra (see Section 3.1). The pressure dependence of the magnetoresistance oscillation spectra is considered in Section 3.2.
3.1 Ambient pressure oscillatory spectrum
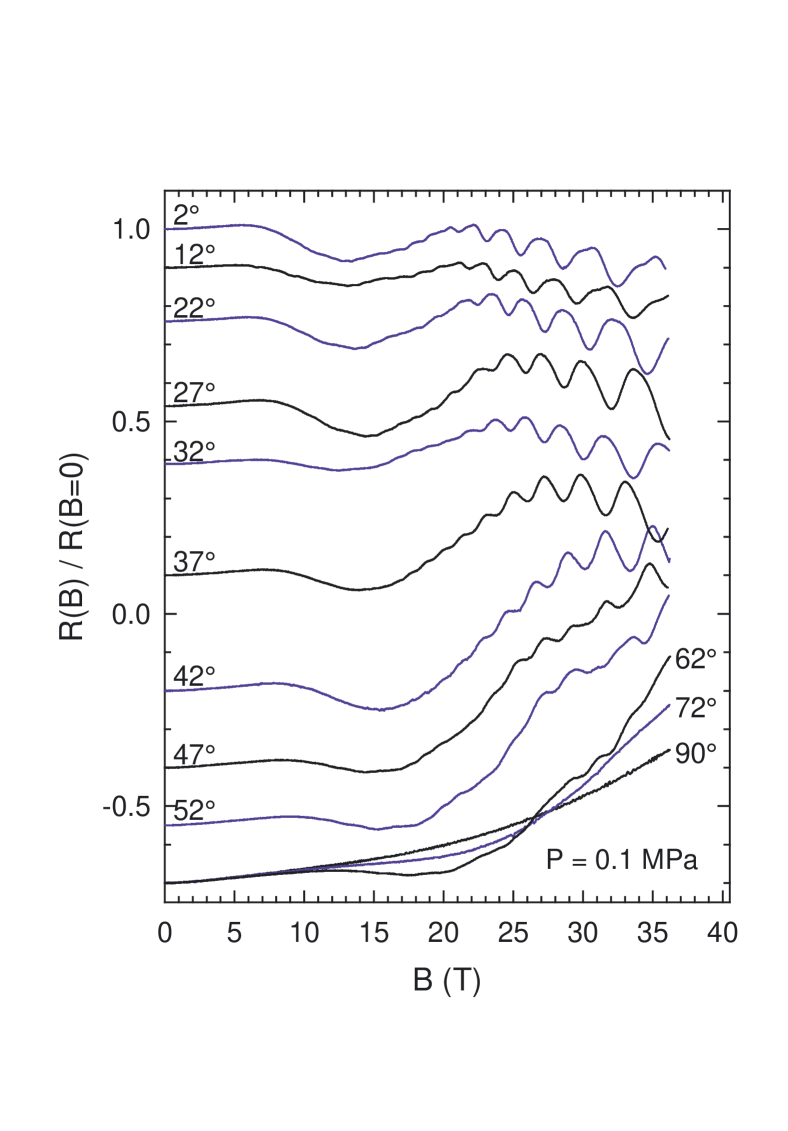
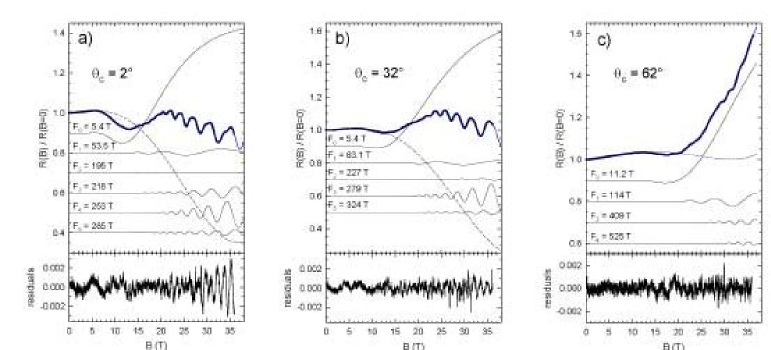
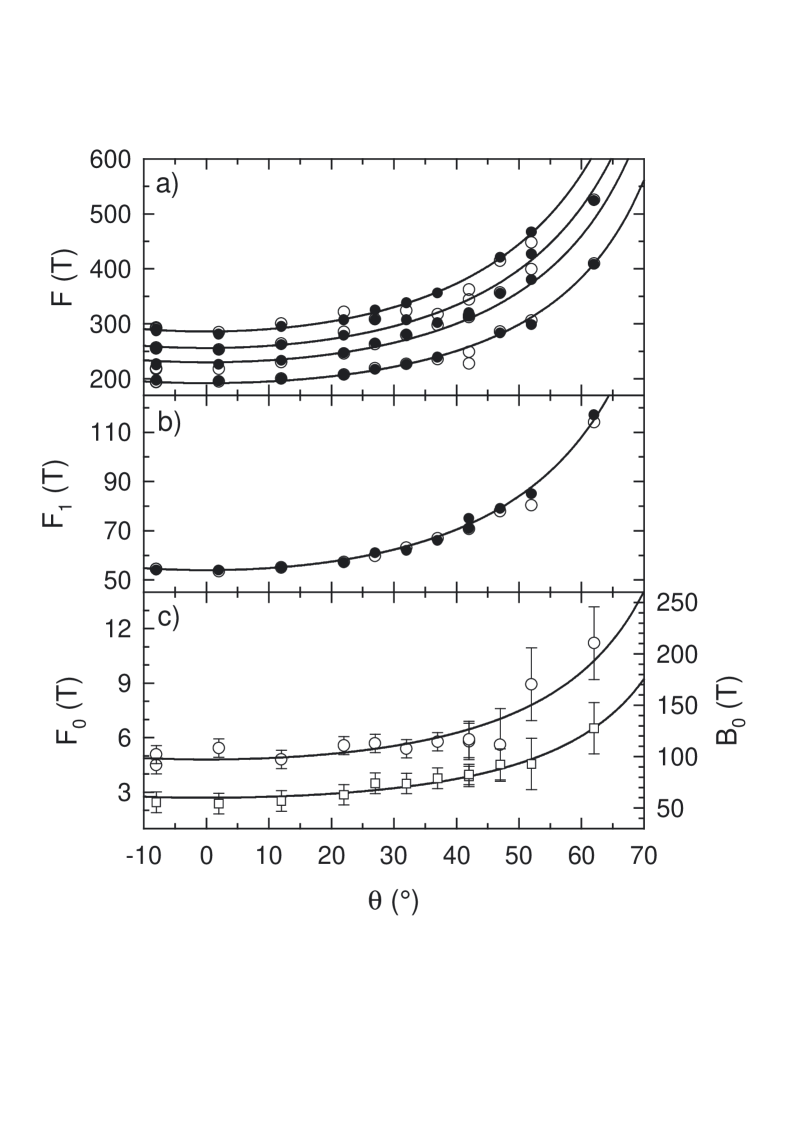
Figure 4 displays the normalized magnetoresistance of sample 2 at a temperature of 2 K for various directions of the magnetic field. The nature of the above mentioned slow undulation, whose extremes are angle-dependent, needs clarification since it can be due to either some non-monotonic behaviour of the background magnetoresistance or to a slow SdH oscillation linked to the presence of a very small orbit. In any case, it makes the determination of the background magnetoresistance difficult. This background should be properly removed from the magnetoresistance data in order to avoid a large zero-frequency peak liable to hamper the extraction of reliable oscillatory data at low frequency (say below few tens of teslas) by Fourier analysis. Moreover, as developed later on and in agreement with data from other compounds of the same family Au04 (10, 11), large Dingle temperatures are observed. This feature leads to a steep field dependence of the oscillation amplitude which reduces the field range in which oscillations can be detected and therefore broadens the various components’ peaks appearing in the Fourier transforms. For these reasons, in addition to Fourier analysis, information on the oscillatory spectra were extracted from direct fittings of the Lifshits-Kosevich formula (LK) to the magnetoresistance data, assuming the background magnetoresistance (Rbg) can be approximated by a 4th order polynomial.
According to the LK formula, the oscillatory magnetoresistance of a metal whose FS is composed of several 2D orbits is given by:
| (1) |
where is the harmonic order. Fi and are the frequency and the phase factor of the oscillation linked to the orbit . Equation 3.1 assumes that the oscillations amplitude is small so that R(B)/Rbg - 1 1 - (B)/ and that the Hall effect is either negligible (which is actually the case for interlayer magnetoresistance measurements with the magnetic field normal to the conducting plane) or contributes to the background magnetoresistance, only. The thermal (for a 2D FS), Dingle, magnetic breakthrough (MB) and spin (S) damping factors are respectively given by Sh84 (18):
| (2) | |||
| (3) | |||
| (4) | |||
| (5) |
where = 2mekB/e ( 14.69 T/K), m is the effective mass normalized to the free electron mass me, is the angle between the field direction and the conducting plane, TD is the Dingle temperature, = g∗m( = 0)/2, g∗ is the effective Landé factor and BMB is the MB field. Integers and are respectively the number of tunnelling and Bragg reflections encountered along the path of the quasiparticle. In the high range, for close to and assuming large (low) values and = 0 ( = 0), in which case = 1, Equation 3.1 can be approximated as:
| (6) |
where is a field-independent parameter, including in particular the contribution of the spin damping factor, and = . It should be kept in mind that, in addition to the above mentioned approximations, some deviations of the magnetoresistance oscillations from the LK formula are observed for 2D FS’s, in particular for clean crystals at low T/B values. As a consequence, Equation 3.1 may not yield reliable values of the and parameters. Nevertheless, as reported hereafter, this equation is useful in order to identify the various components entering the Fourier spectra with a restricted number of free parameters.
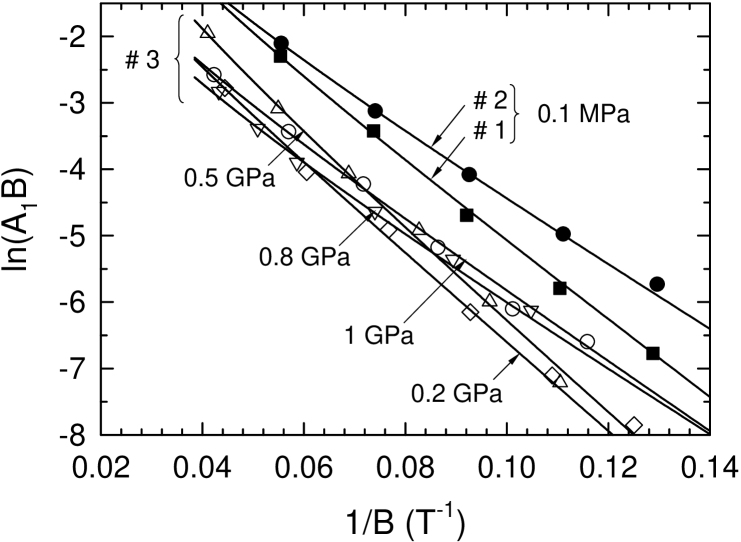
Examples of best fits of Equation 3.1 to magnetoresistance data recorded at ambient pressure are displayed in Figure 5. According to these data, six frequencies labelled F0 to F5 in the following, enter the oscillatory part of the magnetoresistance for magnetic field direction not too far from the normal to the conducting plane (up to 30∘), the lower frequencies F0 to F2 being perceptible up to 65∘. The residuals displayed in the bottom part of the figures either only contain high order harmonics or do not reveal any periodic component. E.g. the high field part of the residuals of data in Figure 5(a) is dominated by the 2nd harmonic of F3 and the 3rd harmonic of F4. As reported in Figure 6, the deduced frequencies follow the orbital behaviour expected for a 2D FS. Remarkably, the slow undulation is accounted for by an SdH oscillation with the frequency F0. In addition, a clear orbital behaviour of the parameter is observed in Figure 6(c), as it is the case for the Bi parameters relevant to the other components. A strongly negative background magnetoresistance is deduced from the fits for low values [see Figs. 5(a) and (b)]. Although a strongly negative magnetoresistance has already been reported above the critical field in the H3O-MNB superconducting salts (M = Ga, Cr) Ba04 (9), it should be noticed that the main part of the magnetoresistance results from the contributions of F0 and the background which, according to the data in Figure 5, have opposite variation above 15 T. In addition, the quantum limit is reached at a few tens of teslas for this frequency. In such a case, a significant error on their amplitude cannot be excluded. The frequency values deduced from the fits of the magnetoresistance data for crystals 1 and 2 are displayed in Table 1. Since the frequency F0 is very low, Fourier analyses have been performed subtracting the contributions of both the background magnetoresistance and the oscillation with frequency F0 from the magnetoresistance data. An example is given in Figure 7: a good agreement between Fourier analysis of the fits of Equation 3.1 and of the experimental data is observed.
| crystal 1 | crystal 2 | |||
|---|---|---|---|---|
| i | fit | FT | fit | FT |
| 0 | 6.21.0 | 5.00.5 | ||
| 1 | 541 | 54.80.5 | 53.51.5 | 53.71.0 |
| 2 | 2023 | 2002 | 1933 | 1963 |
| 3 | 2296 | 2305 | 2187 | 2264 |
| 4 | 2575 | 2502 | 2535 | 2534 |
| 5 | 2953 | 2875 | 2886 | 2846 |
F0 may correspond to an orbit with a very small cross section amounting to 0.1 percent of the FBZ area only. Such a low value is compatible with band structure calculations since the cross section values of the orbits close to the Y’ point of the FBZ in Figure 1(b) are of the same order of magnitude or even smaller. The values of the other observed frequencies (F1 to F5) correspond to orbital areas in the range 1 to 7 percent of the FBZ area. Such values are of the same order of magnitude as those deduced from the data of Refs. Au04 (10, 11). For example, F1 is very close to the frequencies Fa = 48 T and Fα = 38 to 50 T reported for the NH4-FeDMF Au04 (10) and H3O-MP Co04 (11) salts, respectively, while F4 is very close to the frequency Fb = 248 T reported for NH4-FeDMF Au04 (10). It can be deduced from the data in Table 1 that F0+F1+F2+F4 is equal to F3+F5 within the error bars, as expected for a compensated metal. However, even in the case where this latter relationship is not fortuitous, the large number of observed frequencies cannot be fully understood on the basis of the band structure calculations displayed in Figure 1. Nevertheless, a FS based on the intersection of elliptic 2D tubes scheme might still account for a large number of orbits. If true, the actual picture would be less naive than that displayed in Figure 1(c) and, in any case, this point needs a more detailed determination of the FS topology. Other relationships such as F4 = F1 + F2 or F5 = F1 + F4 are also observed (see Table 1). Still in the case where they are not fortuitous, such linear combinations could indicate that frequencies F4 and (or) F5 are linked to either MB orbits or frequency combinations. However, since band structure calculations cannot yield detailed FS topology, no reliable conclusion can be drawn regarding the presence of MB orbits. Effective masses deduced from the temperature dependence of the Fourier component’s amplitudes are in the range from 0.4 to 1.2 free electron mass (see Table 2) which is of the same order of magnitude as for other salts of this family Au04 (10, 11). Dingle temperature values are high (TD 7 K) which certainly rules out frequency combinations due to an oscillation of the chemical potential mu (13). Otherwise, although crystals 1 and 2 exhibit significantly different residual resistance ratios, their Dingle temperature are rather close. This feature is in line with the statement of Ref. Co04 (11) that the crystals are composed of a mixture of insulating and metallic domains, although a metallic conductivity is observed in the present case. Within this picture, the temperature dependence of the resistance reflects the relative parts of metallic and insulating domains while the oscillatory behaviour is only related to the metallic parts which are in turn characterized by a large disorder as indicated by the large measured Dingle temperatures.
3.2 Pressure-dependent oscillatory spectra
| 0.1 MPa ( 1) | 0.1 MPa ( 2) | 0.5 GPa ( 3) | 0.8 GPa ( 3) | 1 GPa ( 3) | ||||||
|---|---|---|---|---|---|---|---|---|---|---|
| i | m | TD | m | TD | m | TD | m | TD | m | TD |
| 1 | 0.40.2 | 7.55.0 | 0.40.2 | 6.54.0 | 0.50.05 | 82 | 0.40.2 | 5.02.5 | 0.600.15 | 42 |
| 2 | 0.40.1 | 64 | 0.40.1 | 74.5 | 0.60.2 | 6.53.5 | 0.800.25 | 7.54.0 | 0.80.2 | |
| 3 | 0.70.2 | 0.60.2 | 0.90.2 | 1.100.25 | 8.53.5 | 0.80.2 | 93 | |||
| 4 | 1.20.2 | 63 | 1.20.2 | 62 | ||||||
| 5 | 0.650.20 | 0.650.20 | ||||||||
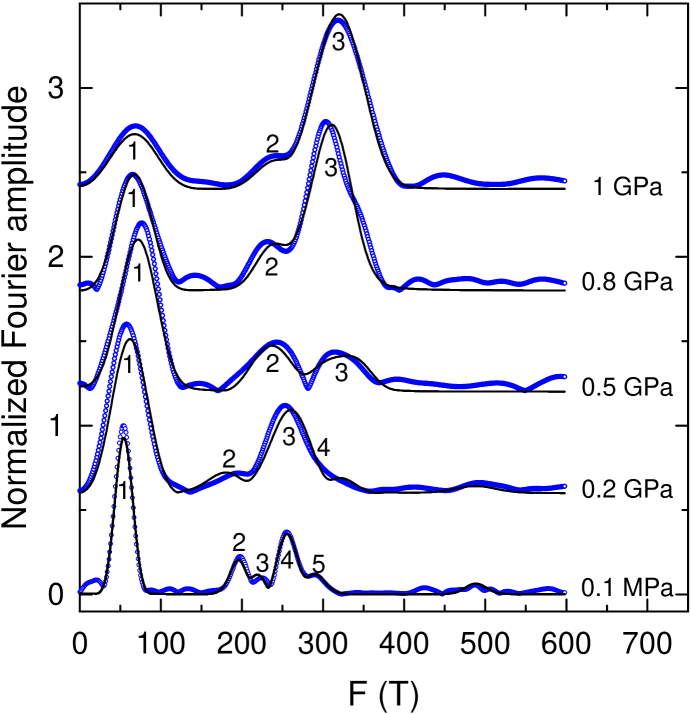
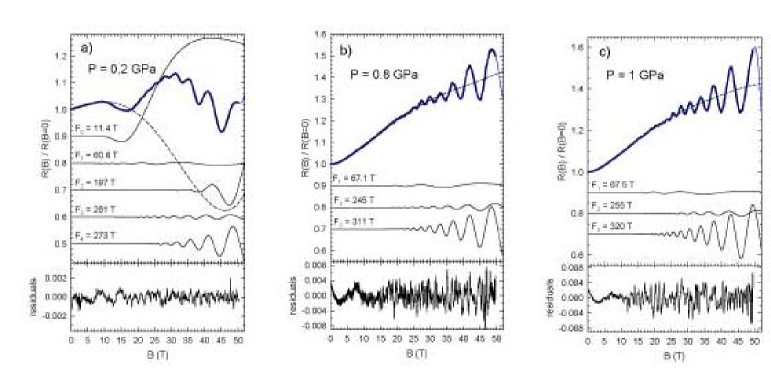
Examples of best fits of Equation 3.1 to the data collected under applied pressure are displayed in Figure 8. As it is the case for the ambient pressure data, a good agreement with Fourier analysis is obtained (see Fig. 7). The salient feature of the pressure dependence of the oscillatory spectra is the progressive decrease of the number of observed frequencies as the pressure increases. Indeed, only five and four frequencies can be detected at 0.2 GPa and 0.5 GPa, respectively. In addition, the slow undulation attributed to F0 cannot be detected above 0.5 GPa. Finally, only three frequencies labelled F1 to F3 in Figures 8(b) and (c) are observed at 0.8 GPa and 1 GPa. Both the effective masses (see Table 2) and the Dingle temperatures (see Table 2 and Fig. 10) remain constant within error bars. The three frequencies observed at high pressure are connected by the relation F1 + F2 = F3. This point is in agreement with e.g. Fourier analysis at 1 GPa that yields F1 = (68 2) T, F2 = (238 4) T and F3 = (313 7) T, respectively. This suggests that the corresponding orbits are compensated. As it is the case for the NH4-FeDMF salt Au04 (10), the high pressure spectra of NH4-CrDMF can be accounted for by the band structure calculations assuming the orbit, from which originates the FS, intersects both along the and directions yielding 3 compensated electron and hole orbits as depicted in Figure 1(c). Within this framework, the frequencies F1, F2 and F3 observed at 0.8 GPa and 1 GPa can be ascribed to the frequencies labelled Fa, Fb-a and Fb observed at ambient pressure in the NH4-FeDMF salt.
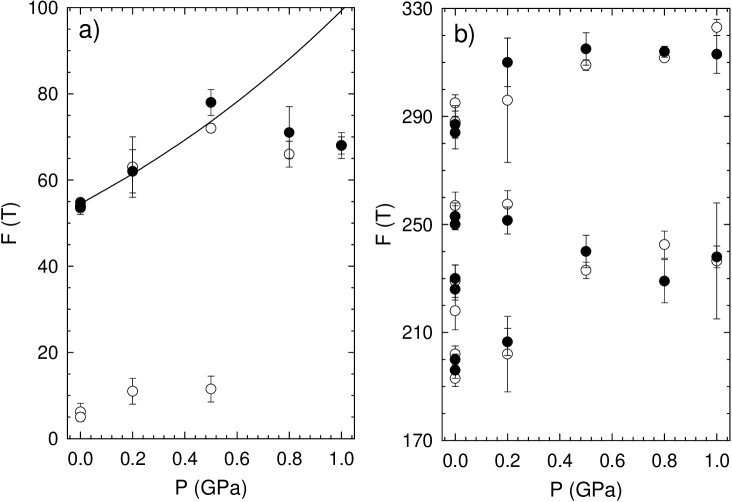
The various frequencies observed as the pressure varies are collected in Figure 9. Provided a given orbit keeps its identity as the applied pressure varies, the pressure dependence of the relevant oscillation frequency can be accounted for by a relationship of the form d[ln(F)]/dP = where is related to the compressibility tensor. The above relationship holds for various organic metals based on the BEDT-TTF molecule with ranging from 0.14 GPa-1 Br95 (19) to 0.7 GPa-1 Au96 (20). The solid line in Figure 9(a) has been derived assuming this is the case for F1. It is obtained with = 0.6 GPa-1 which is within the above range. A clear downward departure from this line is nevertheless observed above 0.5 GPa. A maximum in the pressure dependence of the frequency linked to the closed orbit was also reported at 0.6 GPa for ”-(BEDT-TTF)2SF5CH2CF2SO3 Ha03 (21). In this latter compound a pressure-induced phase transition is observed, although at 1.2 GPa. Regarding the other frequencies, no clear pressure dependence can be derived from data in figure 9(b) which certainly accounts for the observed drastic change of the FS topology as the applied pressure varies.
With regards to frequency combinations linked to either field-dependent Landau level broadening or chemical potential oscillations, no such features are observed, at least in the high pressure range. As a matter of fact, the frequency labelled Fa+b, observed in the NH4-FeDMF salt, which would correspond to the frequency F1 + F3 in the present case, is not observed. This can be considered at the light of the large Dingle temperatures observed (TD 4 to 9 K under applied pressure), keeping in mind that oscillations of the chemical potential are strongly damped by disorder. Since the other source of frequency combination is the Landau level broadening induced by coherent magnetic breakdown LLB (14), the absence of such frequencies suggests that the FS only contains individual orbits, at least at high pressure.
4 Summary and conclusion
The pressure dependence of the FS topology of the ”-(BEDT-TTF)4(NH4)[Cr(C2O4)3]DMF organic metal have been studied up to 1 GPa. The SdH oscillation spectra observed at ambient pressure are compatible with a FS composed of up to six individual orbits. A drastic change of the FS topology is observed under pressure. As a matter of fact, the number of orbits decreases as the applied pressure increases. At 0.8 GPa and above, only three compensated orbits are observed, as it is the case for the NH4-FeDMF salt at ambient pressure. This feature suggests similar FS in both cases, although the latter compound exhibits a strongly non-monotonous temperature-dependent behaviour. This result demonstrates that such non-monotonous behaviour is not necessarily connected with a density wave condensation, which was invoked in the case of H3O-MP Co04 (11). At variance with magnetoresistance data of the NH4-FeDMF compound and more generally of many networks of coupled orbits, no frequency combinations, due to e. g. field-induced chemical potential oscillations, were observed. This is likely connected to the large amount of disorder present in the studied crystals as indicated by the very large measured Dingle temperatures (TD 7 K).
Acknowledgements.
This work was supported by the French-Spanish exchange programm between CNRS and CSIC (number 16 210) and by Euromagnet under the European Union contract R113-CT-2004-506239. We acknowledge Geert Rikken for interesting discussions.References
- (1) E. Coronado and P. Day, Chem. Rev. 104 (2004) 5419
- (2) A. W. Graham, M. Kurmoo and P. Day, J. Chem. Soc., Chem. Commun. (1995) 2061.
- (3) L. Martin, S. S. Turner, P. Day, F. E. Mabbs and E. J. L. McInnes, Chem. Commun. (1997) 1367.
- (4) S. Rashid, S. S. Turner, P. Day, J. A. K. Howard, P. Guionneau, E. J. L. McInnes, F. E. Mabbs, J. H. Clark, S. Firth and T. Briggs, J. Mater. Chem. 11 (2001) 2095.
- (5) E. Coronado, J. R. Galán-Mascarós, C. J. Gómez-García and V. Laukhin, Nature 408 (2000) 447.
- (6) M. Kurmoo, A. W. Graham, P. Day, S. J. Coles, M. B. Hursthouse, J. L. Caulfield, J. Singleton, F. L. Pratt, W. Hayes, L. Ducasse and P. Guionneau, J. Am. Chem. Soc. 117 (1995) 12209.
- (7) L. Martin, S. S. Turner, P. Day, P. Guionneau, J. A. K. Howard, D. E. Hibbs, M. E. Light, M. B. Hursthouse, M. Uruichi and K. Yakushi, Inorg. Chem. 40 1363 (2001).
- (8) T. G. Prokhorova, S. S. Khasanov, L. V. Zorina, L. I. Buravov, V. A. Tkacheva, A. A. Baskakov, R. B. Morgunov, M. Gener, E. Canadell, R. P. Shibaeva and E. B. Yagubskii, Adv. Funct. Mater. 13 (2003) 403.
- (9) A. Bangura, A. Coldea, A. Ardavan, J. Singleton, A. Akutsu-Sato, H. Akutsu and P. Day, J. Phys. IV France 114 (2004) 285.
- (10) A. Audouard, V. N. Laukhin, L. Brossard, T. G. Prokhorova, E. B. Yagubskii and E. Canadell, Phys. Rev. B 69 (2004) 144523.
- (11) A. Coldea, A. Bangura, J. Singleton, A. Ardavan, A. Akutsu-Sato, H. Akutsu, S. S. Turner and P. Day, Phys. Rev. B 69 (2004) 085112.
- (12) A. Bangura, A. Coldea, J. Singleton, A. Ardavan, A. Akutsu-Sato, H. Akutsu, S. S. Turner and P. Day, Phys. Rev. B 72 (2005) 14543.
- (13) A. S. Alexandrov and A. M. Bratkovsky, Phys. Rev. Lett. 76 (1996) 1308; Phys. Lett. A 234 53 (1997) and Phys. Rev. B 63 033105 (2001); T. Champel, ibid. 65 153403 (2002); K. Kishigi and Y. Hasegawa, ibid. 65 205405 (2002); J. Y. Fortin, E. Perez and A. Audouard, ibid. 71 (2005) 155101.
- (14) A. B. Pippard, Proc. Roy. Soc. (London) A270 1 (1962); P. S. Sandhu, J. H. Kim and J. S. Brooks, Phys. Rev. B 56 (1997) 11566; J. Y. Fortin and T. Ziman, Phys. Rev. Lett. 80 (1998) 3117; V. M. Gvozdikov, Yu V. Pershin, E. Steep, A. G. M. Jansen and P. Wyder, Phys. Rev. B 65 (2002) 165102.
- (15) H. Akutsu, A Akutsu-Sato, S. S. Turner, D. Le Pevelen, P. Day, V. N. Laukhin, A.-K. Klehe, J. Singleton, D. A. Tocher, M. R. Probert and J. A. K. Howard, J. Am. Chem. Soc. 124 (2002) 12430.
- (16) S. S. Turner, P. Day, K. M. Abdul Malik, M. Hursthouse, S. Teat, E. MacLean, L. Martin and S. French, Inorg. Chem. 38 3543 (1999).
- (17) M. Nardone, A. Audouard, D. Vignolles and L. Brossard, Cryogenics 41 (2001) 175.
- (18) D. Shoenberg, Magnetic Oscillations in Metals (Cambridge University Press, Cambridge, 1984)
- (19) J. S. Brooks, X. Chen, S. J. Klepper, S. Valfells, G. J. Athas, Y. Tanaka, T. Kinoshita, N. Kinoshita, M. Tokumoto, H. Anzai and C. C. Agosta, Phys. Rev. B 52 (1995) 14457.
- (20) A. Audouard, P. Auban-Senzier, V. N. Laukhin, L. Brossard, D. Jérome and N. D. Kushch, Europhys. Lett. 34 (1996) 599.
- (21) J. Hagel, J. Wosnitza, C. Pfleiderer, J. A. Schlueter, J. Mohtasham and G. L. Gard, Phys. Rev. B 68 (2003) 104504.