Towards a Bose-Glass of ultracold atoms in a disordered crystal of light
Abstract
Starting from one-dimensional Mott Insulators, we use a bichromatic optical lattice to add controlled disorder to an ideal optical crystal where bosonic atoms are pinned by repulsive interactions. Increasing disorder, we observe a broadening of the Mott Insulator resonances and the transition to an insulating state with a flat density of excitations, suggesting the formation of a Bose-Glass.
pacs:
05.30.Jp, 03.75.Lm, 03.75.Kk, 32.80.Pj, 75.10.Nr, 73.43.NqDisorder plays a crucial role in statistical and condensed matter physics and it contributes in a substantial way to the mechanism of transport and conduction. As originally predicted by Anderson anderson58 , disorder can lead to localization of a wave scattered by random impurities. Also interactions are well known to induce localization effects, as happens in the Mott Insulator (MI) phase fisher89 ; greiner02 , in which a bosonic lattice system at zero temperature, instead of condensing in a superfluid (SF) state, forms an insulating “solid” with integer filling of the lattice sites. Much theoretical effort has been devoted to investigate the combined role of disorder and interactions in the SF-insulator transition observed in many condensed-matter systems condmat . If the disorder in the external potential is large enough, these systems are expected to enter an insulating state, the so-called Bose-Glass (BG), as predicted in the seminal paper fisher89 , characterized by a gapless excitation spectrum and a finite compressibility scalettar91 ; krauth91 ; roth03 ; damski03 .
In this work we add controlled disorder to a collection of 1D ultracold 87Rb gases in the MI phase by using a non-commensurate periodic potential superimposed on the main lattice, that introduces a randomization of the energy landscape on the same length scale as the lattice spacing. As a result, the characteristic resonances in the MI excitation spectrum are lost and the system rearranges to form a state with vanishing long-range coherence and a broadband excitability. These observations constitute the first significative evidence in the direction of demonstrating a BG phase of ultracold atoms.
At zero temperature the many-body quantum state of an interacting gas of identical bosons in a lattice potential is well described by the Bose-Hubbard Hamiltonian , where () is the destruction (creation) operator of one particle in the -th site, is the number operator, and indicates the sum on nearest neighbors fisher89 ; jaksch98 . The total energy results from the sum of three terms: is the hopping energy, proportional to the probability of tunnelling between adjacent sites, is the interaction energy, arising from on-site interactions (repulsive for 87Rb, for which ), and is a site-dependent energy accounting for inhomogeneous external potentials.
When the ground state is determined by the competition between and . When the system is in a SF state, in which the bosons are delocalized and tunnelling ensures long-range coherence. Instead, when , the system is in a localized MI state, where phase coherence is lost and number Fock states are created at the lattice sites. The transition from a SF to a MI for ultracold atoms in an optical lattice has been first reported for a 3D system in greiner02 and for an array of 1D gases in stoferle04 . The phase diagram of the system depends on the chemical potential (related to the atomic density) and shows the existence of MI lobes with integer number of atoms per site (Fig. 1a). In the experiments, an additional harmonic confinement is present, resulting in a smooth variation of the density across the sample. As a result, in a single experimental run one typically averages on an extended range of local (vertical dotted line in Fig. 1a). This inhomogeneity precludes a sharp phase transition, due to the coexistence of SF and MI near the critical point, and is responsible for the formation of domains with different fillings deep in the MI phase batrouni02 .
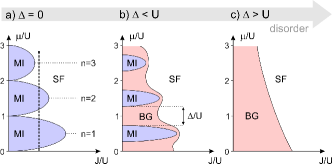
In the presence of a disordered external potential an additional energy scale enters the description of the system. We consider the case of bounded disorder, in which . In the presence of weak disorder the MI lobes should progressively shrink and a new BG phase should appear (Fig. 1b), eventually washing away the MI region for (Fig. 1c) fisher89 . This BG phase shares some properties with the MI state, namely both are insulating states, with vanishing long-range coherence and vanishing superfluid fraction. However, differently from the MI, the BG presents a gapless excitation spectrum and a finite compressibility.
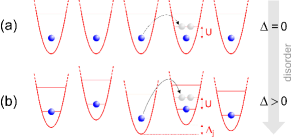
In order to understand the physics happening when approaching the BG phase, we consider the limit and unitary filling of the lattice sites. In a MI an energy gap exists, since the elementary excitation - the hopping of a boson from a site to a neighboring one - has an energy cost . The presence of disorder introduces random energy differences between neighboring sites (see Fig. 2b) and the energy cost for such a process becomes , that depends on the position. In the full BG, when , an infinite system can be excited at arbitrarily small energies and the energy gap shrinks to zero. Despite the zero energy gap, excitations only occur locally and the BG remains globally insulating.
For a system of ultracold bosons in an optical lattice one can introduce controlled disorder in different ways. Experiments have already been realized with laser speckles in combination with atomic Bose-Einstein condensates (BECs) lye05 ; fort05 ; clement05 ; schulte05 . Optical disorder on much smaller length scales can be obtained by using two-color lattices roth03 ; damski03 , i.e. superimposing on the already existing lattice a second weaker lattice with non-commensurate spacing.
In the experiment, an optical lattice (main lattice) is produced by using a Titanium:Sapphire laser at nm. Disorder is introduced by using an auxiliary lattice (disordering lattice) obtained from a fiber-amplified diode laser at nm. The resulting potential along the lattice axis is , where and measure the height of the lattices in units of the recoil energies kHz and kHz, is the Planck constant and the mass of a 87Rb atom. When the disordering lattice has the only effect to scramble the energies , which are non-periodically modulated at the length scale of the beating between the two lattices m, corresponding to 4.3 lattice sites (see Fig. 3b). In Fig. 3c we plot a histogram of the site-to-site energy differences occurring over the size of our samples (32 m) for . Recent theoretical works roth03 ; damski03 ; hild06 have demonstrated that in finite-sized systems this quasiperiodic potential can produce the same effects induced by a truly random potential and allow the observation of a BG of ultracold atoms.
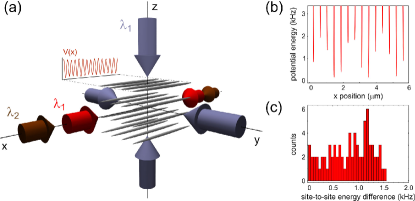
We perform the experiment with a collection of independent 1D bosonic systems tightly confined in the sites of a 2D optical lattice (trapping lattice) produced with laser light at nm and aligned along and axes (see Fig. 3a). The source of ultracold atoms is provided by a BEC of 87Rb atoms. In order to create the atom tubes we adiabatically increase the intensity of the 2D trapping lattice by using a 100 ms long exponential ramp with time constant 30 ms. After the ramp the lattice height, measured in units of , is and the atoms are confined in the lattice sites with trapping frequency kHz along and . The confinement along the tubes is much more loose, being caused by the gaussian shape of the laser beams and the harmonic magnetic trap, resulting in a trapping frequency Hz. The single-particle tunnelling rate between adjacent tubes is Hz, that can be completely neglected on the timescale of the experiments.
Together with the 2D lattice we switch on the bichromatic lattice at wavelengths and along the direction of the tubes (see Fig. 3a) by using the same exponential ramp. Then we characterize the many-body state of the 1D systems by measuring the excitation spectrum and observing the interference pattern after time-of-flight (TOF), i.e. switching off the confining potentials and imaging the density distribution after expansion.
The excitation spectrum of the 1D gases in the bichromatic lattice is measured with the Bragg spectroscopy technique introduced in stoferle04 . A sinusoidal modulation of the main lattice height with frequency and amplitude stimulates the resonant production of excitations with energy . We detect the excitations produced after 30 ms of modulation by first decreasing in 15 ms the intensity of the lattices back to , in the 3D SF phase, waiting 5 ms and then switching off the potentials and imaging the atoms after TOF. The width of the central peak in the images is related to the energy transferred to the atomic system, giving information on the excitability of the sample at that frequency stoferle04 .
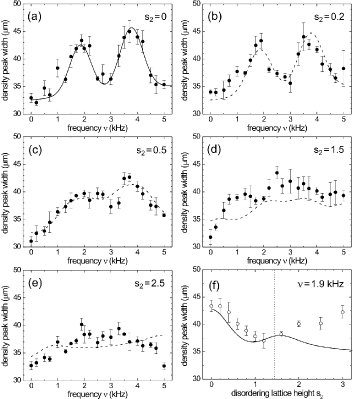
A typical spectrum for the MI state with and is shown in Fig. 4a. Here we detect the presence of an excitation peak at kHz, corresponding to the interaction energy . At twice the frequency 3.8(1) kHz we observe a second peak greiner02 , that can be attributed to higher-order processes and to excitations taking place at the boundary between different MI domains. For these parameters the peak chemical potential is (see vertical line in Fig. 1), giving rise to domains with 1, 2 and 3 atoms per site. The same measurements are then repeated in the presence of the disordering lattice. Fig. 4b-e show the measured spectra for increasing disorder from to . At (Fig. 4c) one already detects the disappearance of the characteristic peak structure of the MI and the appearance of a broader spectrum. At the largest disorder height , when the maximum energy difference between neighboring sites is kHz and one expects to have entered the full BG phase, the resonances are completely lost.
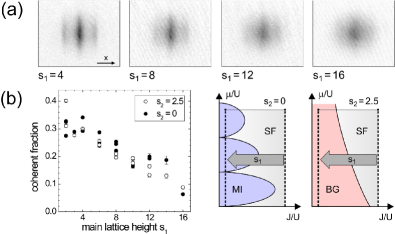
Additional information can be obtained by analyzing the TOF images, that provide a measurement of phase coherence. We first prepare the system in a state with arbitrary and , then we suddenly ramp in s the lattice heights to and (while keeping ) and finally switch off the confining potentials. This time is short enough not to change the coherence properties of the system, but allows us to project the state under investigation onto a same reference state stoferle04 . In Fig. 5a we report images of the density distribution after a TOF of 20 ms for and different values of . The presence of vertical interference fringes is an indicator of long-range coherence along the tubes. When increasing the height of the main lattice, we observe a progressive loss of coherence indicating the transition from a SF to an insulating state notacoerenza . In Fig. 5b we report the coherent fraction, measured as the number of atoms in the interference peaks divided by the total number of atoms stoferle04 both for and for .
The combination of the excitation spectra measurements and the TOF images indicates that, with increasing disorder, the system goes from a MI to a state with vanishing long range coherence and a flat density of excitations. The concurrence of these two properties cannot be found in either a SF or an ordered MI, and is consistent with the formation of a BG. Rigorously speaking, the BG phase should be characterized by a gapless spectrum. Detecting the absence of a gap is technically challenging, since it would require a measurement of excitability at arbitrarily small energies. A direct measurement of a small energy gap cannot be accomplished with the modulation technique we have used, that works well only for frequencies much larger than the reciprocal of the modulation time ms, i.e. starting from a few hundred Hz. However, the excitation spectrum is expected to be gapless only for an infinite system, while finite-sized systems always have discrete energy spectra. Nevertheless, we expect the density of excitations in a finite-sized BG to lose the characteristic resonances of the MI and to become flat fisher89 . In the following we will show that for weak disorder the spectra in Fig. 4 can be explained with the inhomogeneous broadening of the MI peaks, accompanied by the consequent reduction of the gap, which is the first prerequisite for the formation of a BG.
We have developed a model in which we calculate the inhomogeneous broadening of the MI resonances at and caused by the disordered distribution of site-to-site energy differences (see Fig. 2b). The broadened spectra are obtained by convolving the MI spectrum (fitted in Fig. 4a with a double gaussian + a linear pedestal, solid line) with the distribution of energy shifts across the lattice. The result of this convolution is reported in the dashed curves of Fig. 4b-e, showing a fine agreement with the experimental data for workinprogress .
In order to more quantitatively analyze the disappearance of the MI resonances, we report in Fig. 4f the width of the density distribution after an excitation at kHz, corresponding to the first resonance in the MI spectrum, as a function of (empty circles). The solid line is the theoretical prediction based on the model of inhomogeneous broadening, that nicely match the experimental findings for . One expects this broadening to happen when approaching the transition from a MI to a BG, with the energy gap progressively closing with increasing disorder krauth91 . Eventually, when the broadened resonances reach zero-energy and the gap completely disappears, the transition to a BG is expected to occur. We find that the agreement with the model breaks down for (vertical dotted line), when indeed the maximum site-to-site energy difference is larger than . At this point the atoms rearrange in a new insulating state with different sites filling, and the simple model of MI inhomogeneous broadening breaks down.
Similar results for the excitation spectrum have been recently predicted in hild06 , where the authors study the response of a 1D Bose gas to a periodic amplitude modulation of a superlattice. Our experimental findings are in good agreement with the numerical results of hild06 , showing a broadening of the MI resonances for weak disorder and their complete disappearance when entering the BG.
Despite this remarkable change in the excitation spectrum, an undeniable hallmark of the formation of a BG is still lacking. In particular, if a precise detection of the vanishing gap could be performed, it would discriminate between a genuine BG and a strongly inhomogeneous MI. To this aim a measurement of compressibility would provide a decisive proof for the creation of such a state. However, in actual MI experiments the existence of multiple domains leads itself to already globally compressible systems batrouni02 . Regarding the coherence properties, few theoretical works predict that for restricted ranges of parameters one should observe an enhancement of coherence due to the presence of disorder in the route to the BG sengupta06 . As shown in Fig. 5b, we do not observe any appreciable difference varying within the reproducibility limits of our experiment nota1 . However, a quantitative prediction of these effects for real experimental systems is absent. Furthermore, in the progression from SF to MI/BG, one simultaneously probes extended regions of the phase diagram (as sketched in Fig. 5b), that smooth the transition and could smear out these effects.
In conclusion, we have added controlled disorder onto a collection of 1D bosonic gases in an optical lattice by means of an additional lattice with different spacing. We have reported on the first observation of the transition from a Mott Insulator to a state with vanishing coherence and a flat density of excitations. These coexisting properties suggest the formation of a Bose-Glass, which is expected to appear for our parameters roth03 ; damski03 ; hild06 . Future work will be done in the direction of implementing new techniques for a more exhaustive characterization of this novel state, possibly including a measurement of compressibility and new detection schemes folling05 .
This work has been funded by the EU Contract No. HPRN-CT-2000-00125, MIUR FIRB 2001, MIUR PRIN 2005 and Ente Cassa di Risparmio di Firenze. We acknowledge E. A. Cornell, P. Zoller, R. Fazio, C. Tozzo, F. S. Cataliotti, M. Modugno, D. S. Wiersma and all the Cold Quantum Gases Group at LENS for stimulating comments. We thank P. Cancio Pastor and P. De Natale from INOA for kind concession of the infrared laser.
References
- (1) P. W. Anderson, Phys. Rev. 109, 1492 (1958).
- (2) M. P. A. Fisher et al., Phys. Rev. B 40, 546 (1989).
- (3) M. Greiner et al., Nature 415, 39 (2002).
- (4) P. A. Crowell, F. W. Van Keuls, and J. D. Reppy, Phys. Rev. Lett. 75, 1106 (1995); A. M. Goldman, and N. Marković, Phys. Today 51, No. 11, 39 (1998); H. S. J. van der Zant et al., Phys. Rev. Lett. 69, 2971 (1992); W. Jiang et al., Phys. Rev. Lett. 72, 550 (1994); R. C. Budhani, W. L. Holstein, and M. Suenaga, Phys. Rev. Lett. 72, 566 (1994).
- (5) R. T. Scalettar, G. G. Batrouni, and G. T. Zimanyi, Phys. Rev. Lett. 66, 3144 (1991).
- (6) W. Krauth, N. Trivedi, and D. Ceperley, Phys. Rev. Lett. 67, 2307 (1991).
- (7) R. Roth and K. Burnett, Phys. Rev. A 68, 023604 (2003).
- (8) B. Damski et al., Phys. Rev. Lett. 91, 080403 (2003).
- (9) D. Jaksch et al., Phys. Rev. Lett. 81, 003108 (1998).
- (10) T. Stöferle et al., Phys. Rev. Lett. 92, 130403 (2004).
- (11) G. G. Batrouni et al., Phys. Rev. Lett. 89, 117203 (2002).
- (12) J. E. Lye et al., Phys. Rev. Lett. 95, 070401 (2005).
- (13) C. Fort et al., Phys. Rev. Lett. 95, 170410 (2005).
- (14) D. Clément et al., Phys. Rev. Lett. 95, 170409 (2005).
- (15) T. Schulte et al., Phys. Rev. Lett. 95, 170411 (2005).
- (16) M. Hild, F. Schmitt, and R. Roth, J. Phys. B 39, 4547 (2006).
- (17) The technique used for the excitation spectrum measurements ensures itself that this loss of coherence is reversible. Indeed, when coming back to , , the peaks in the TOF images indicate that coherence can be reestablished, even for .
- (18) More details will be presented in a future publication.
- (19) P. Sengupta, A. Raghavan, and S. Haas, preprint arXiv:cond-mat/0602504 (2006).
- (20) We have also considered different values of ranging from 0.8 to 4 obtaining similar results. We have also measured the coherence length (by taking the width of the peaks), still finding no appreciable differences varying .
- (21) S. Fölling et al., Nature 434, 481 (2005).