,
Universal optimal hole-doping concentration in single-layer high-temperature cuprate superconductors
Abstract
We argue that in cuprate physics there are two types, hole content per CuO2 plane () and the corresponding hole content per unit volume (), of hole-doping concentrations for addressing physical properties that are two-dimensional (2D) and three-dimensional (3D) in nature, respectively. We find that superconducting transition temperature () varies systematically with as a superconducting “” with a universal optimal hole-doping concentration = 1.6 1021 cm-3 for single-layer high temperature superconductors. We suggest that determines the upper bound of the electronic energy of underdoped single-layer high- cuprates.
pacs:
74.72.-h, 74.25.Fy, 74.25.Dw1 Introduction
In high-temperature cuprate superconductors (HTS) the hole-doping concentration is the single most important physical parameter that dictates the cuprate physics. It has been a subject of extensive studies since the beginning of the HTS era until today. It is also evident from the existence of the robust generic electronic properties hole-doping concentration phase diagram [1]. In spite of its fundamental important role in studying HTS, there is no consistent and simple method to determine hole-doping concentration for all HTS.
HTS consist of one, two and more conductive “ ” layers sandwiched between blocks of insulating “ ” layers generally referred as single-, double- and multi-layer HTS, respectively. Cation-doping and/or oxygen-doping within the charge reservoir introduce holes into the CuO2 plane. In general, the doped-holes are expressed as the hole content per CuO2 plane (). Note that so defined is intrinsically a two-dimensional (2D) quantity. In the cation doped HTS, the can be directly determined from the doped cation content, such as = in the Sr-doped La2-xSrxCuO4 (SrD-La214). However, in the oxygen-doped (OD-) or cation/oxygen co-doped (CD-) HTS, it is highly non-trivial to determine . Because, for La2-xSrxCuO4+δ, depends on the excess oxygen content (), but the doping efficiency of oxygen atoms depends on the type of charge reservoir and/or [2, 3].
Superconducting transition temperature () for the SrD-La214 shows a dome-shaped curve with a maximum () of 37 K at 0.16. Many other HTS also exhibited the similar dome-shaped curve, although the depends on the HTS materials. It was then conjectured that all HTS follow a universal dome-shaped curve with at = 0.16 [4]. Subsequently, the hole concentration (), considered to be identical to , was conveniently estimated by ()-scale using eq. (1).
| (1) |
Most recently, based on the thermoelectric power at room temperature (), a universal ()-scale (hereafter -scale) is constructed as new scale that is different from the ()-scale (hereafter -scale) [5]. The distinct features of -scale are: (a.) pseudogap temperatures become universal to all HTS and depend only on , and (b.) is no longer universally pinned at = 0.16, it depends on the specific material system of HTS [5]. Therefore can be regarded as a carrier scale dictated by the pseudogap energy scale. In contrast the -scale is based on the energy scale of . Since pseudogap phase is the precursor of high- superconductivity, it seems to be plausible that is the proper carrier scale for both normal and superconducting properties of layered cuprates. If so, then we expect the -scale should recover the experimentally observed dome-shaped () curve. In this letter, we show that , with a straight forward extension of to an effective three-dimensional (3D) hole concentration, can indeed describe the universal dome-shaped () curve.
We define a 3D hole concentration () in terms of in eq. (2).
| (2) |
Here, and are the unit cell volume and the number of CuO2 plane per unit cell, respectively. Since is defined on the universal 2D -scale, this definition has qualitatively taken into account the charge de-confinement effect of the holes in cuprates. Therefore can be viewed as the “” 3D hole-doping concentration even when holes are completely confined in .
In this letter we make a clear distinction between , hole content per CuO2 plane, and the corresponding effective 3D hole-doping concentration () defined in eq. (2). We show that it is important to use the physically relevant hole-doping concentration in order to visualize the intrinsic and systematic doping behaviors of any physical property of HTS. Furthermore, we show that the exhibits a universal dome-shaped curve with the universal optimal hole-doping concentration = 1.6 1021 cm-3 for single-layer HTS. We find that the -scale is identical to the -scale and should be understood in the context of a normalized effective 3D carrier concentration. In this report we will focus only on the single-layer HTS. The extension of our definition of for the multi-layer HTS with equivalent CuO2 planes is straight forward.
2 Experimental
of data collected from the literatures [6, 7, 8, 9, 10, 11, 12, 13, 14, 15, 16, 17, 18, 19] are reliably determined by -scale. Some of the data plotted in Fig. 1 and 3 are coming from the literatures [20, 21, 22, 23] where only is reported. Their are estimated from the () curve plotted in Fig. 2(a). For the calculation of , we use the typical value of 190 Å3, 345 Å3, 355 Å3 and 143 Å3 for the unit cell volume of SrD-La214 with = 2 [7], Tl2Ba2CuO6+δ (OD-Tl2201) with = 2 [24], Bi2Sr2-xLaxCuO6+δ (CD-Bi2201) with = 2 [25], and HgBa2CuO4+δ (OD-Hg1201) with = 1 [26], respectively.
3 Results and discussion
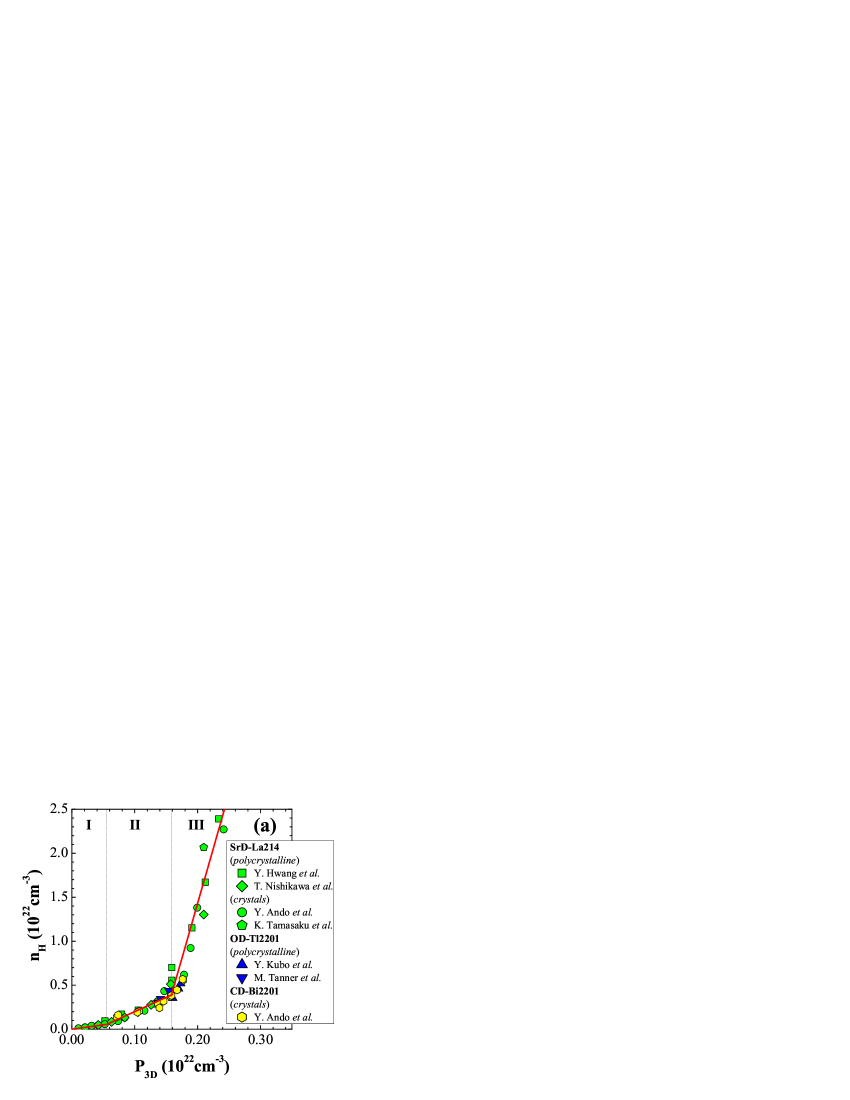
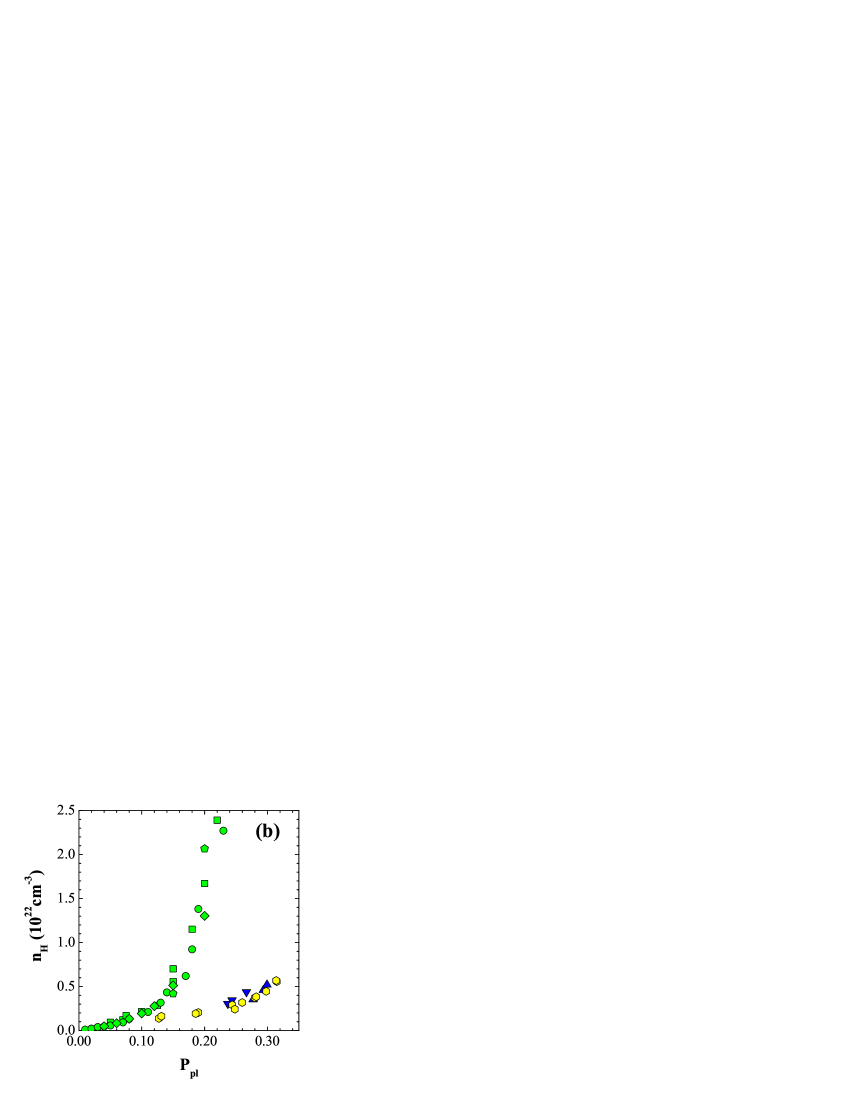
We start with a comparison of our scale to in-plane Hall number ( = ), where is in-plane Hall coefficient and is electron charge, that estimates carrier number per unit . In the single-layer SrD-La214 and OD-Tl2201, the of the polycrystalline samples is experimentally confirmed to be corresponding to the in-plane of the single crystals [16, 27]. In Fig. 1(a), we plot the as a function of for the single-layer HTS. For SrD-La214 [13, 14, 15, 16], there are three linear () regimes (regime-I, II and III). In regime-I for 5.5 1020 cm-3, is identical to . This is very encouraging and indicates that the defined here is physically sound and quantitatively valid. At = 5.5 1020 cm-3, the slope of linear () suddenly changes from 1 to 3.2. In the regime-III for 1.6 1021 cm-3, the linear () changes slope to 25. The observed rapid increase in may related to the change in sign of observed in the overdoped SrD-La214 [16]. The three regimes clearly define three distinct electronic states of doped holes. The identical trend is also observed in CD-Bi2201 crystals [8, 11, 12] and OD-Tl2201 ceramics [6, 17, 23]. We need to emphasize that this systematic behavior is not governed by the , but by the . In Fig. 1(b) we plot the same data set of as a function of . The for CD-Bi2201 and OD-Tl2201 do not follow that of SrD-La214, and the three physically distinct regimes can not be resolved.
Since it is well known that the electronic anisotropy decreases with doping in all HTS, the above observations suggest that there are three distinct confinement regimes of doped holes. In regime-I where is the same as indicates doped holes are completely confined within the CuO2 plane. For regimes-II and -III where = with a non-unity slope, 3.2 and 25, respectively, each represents a distinct de-confinement regime of doped-hole states. Noted that the change of slope between two regimes is quite abrupt, more like a phase transition than some kind of crossover behaviors. The critical that define the boundary between regime-I and -II and the boundary between regime-II and -III actually correspond to the crtitical for the insulator-superconductor transition () and , respectively. The physical meaning of each regime will become clear in our discussion of Fig. 2(b).
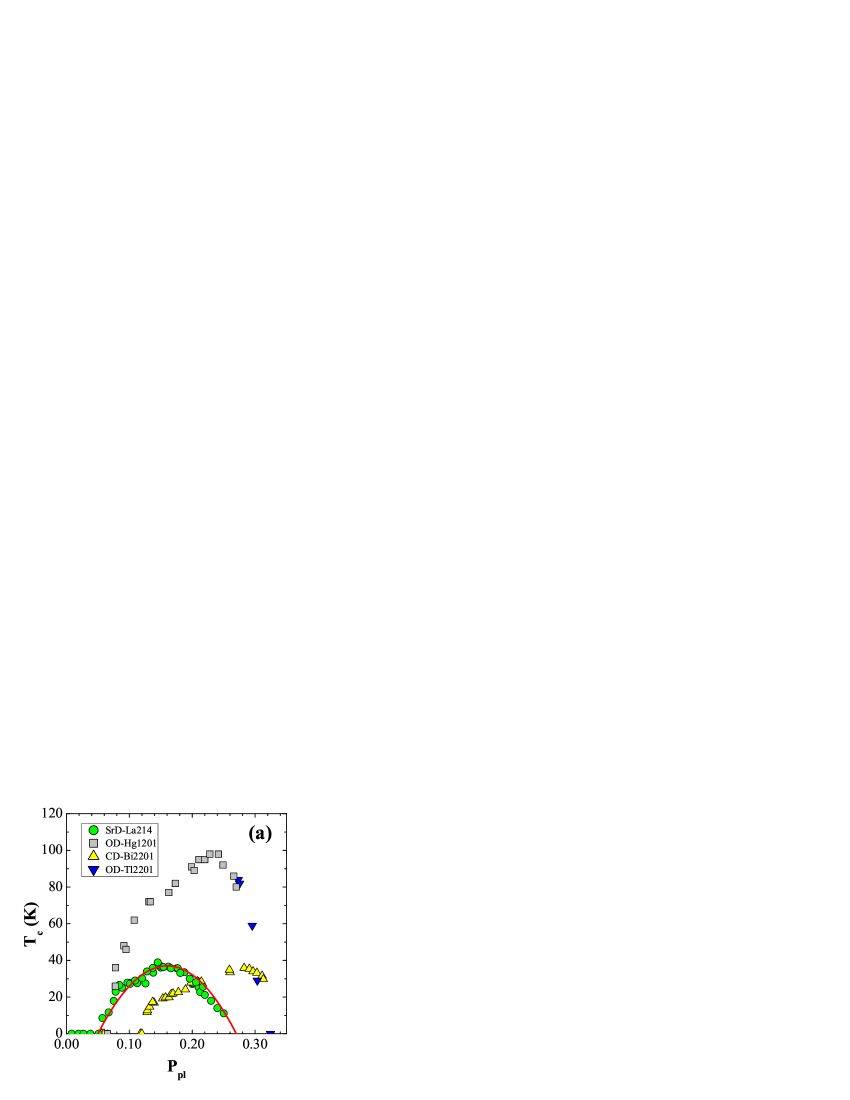
In Fig. 2(a), we plot as a function of . Here, we use value reported in the literature [6, 7, 8, 9, 10], irrespective of how it was defined. The optimal doping level strongly depends on the systems. Noted that the optimal doping levels for OD-Hg1201 and CD-Bi2201 are at 0.23 and 0.28, respectively, although that for SrD-La214 is 0.16. Thus, the optimal doping level for the single-layer HTS is not universally equal to 0.16, as reported in some earlier studies [5, 28]. However, the -scale has been used successfully to discuss various characteristic properties of HTS [29]. We show that the is actually related to .
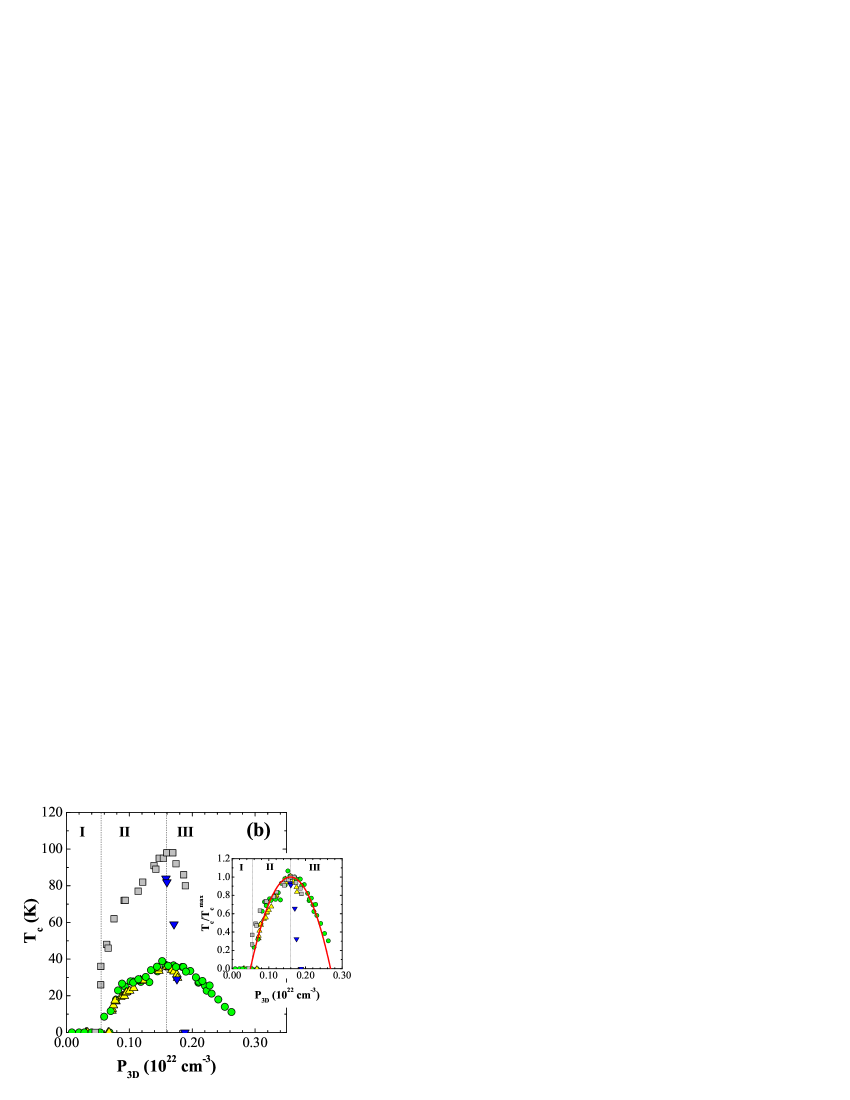
To see that has real physical consequence we replot, in Fig. 2(b), as a function of using the same data set of Fig. 2(a). The superconductivity appears at 5.5 1020 cm-3. The universally appears at 1.6 1021 cm-3. The inset shows the . The for SrD-La214, OD-Hg1201 and CD-Bi2201 follow the same dome-shaped curve. Now we can pin down the absolute value of 3D optimal hole-doping concentration in eq. (3) :
| (3) |
where the unit of is “ ”. It is clear that the determined in eq. (1) is not planar hole-doping concentration but physically identical to our defined . Therefore, we can understand why -scale worked in the earlier doping-dependence studies. However, we need to emphasize that -scale is the proper carrier scale for 3D “bulk” cuprate properties. The of underedoped OD-Hg1201 may seem slightly to be higher than calculated from eq. (3). OD-Hg1201 is the pure oxygen-doped compound, although CD-Bi2201 is the cation/oxygen co-doped compound. Accordingly, the oxygen atom within the charge reservoir is more mobile or softer in OD-Hg1201 [30, 31]. The slightly higher could be due to the change in by the thermal oxygen re-arrangement [31].
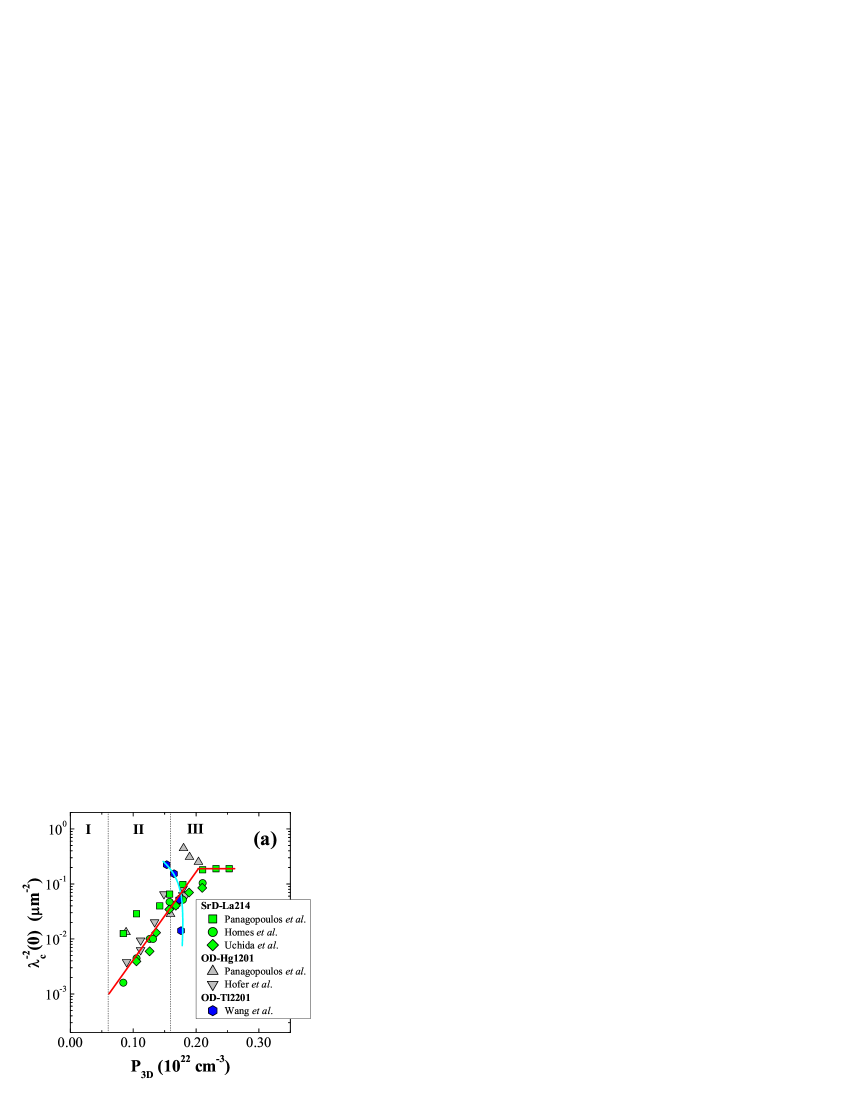
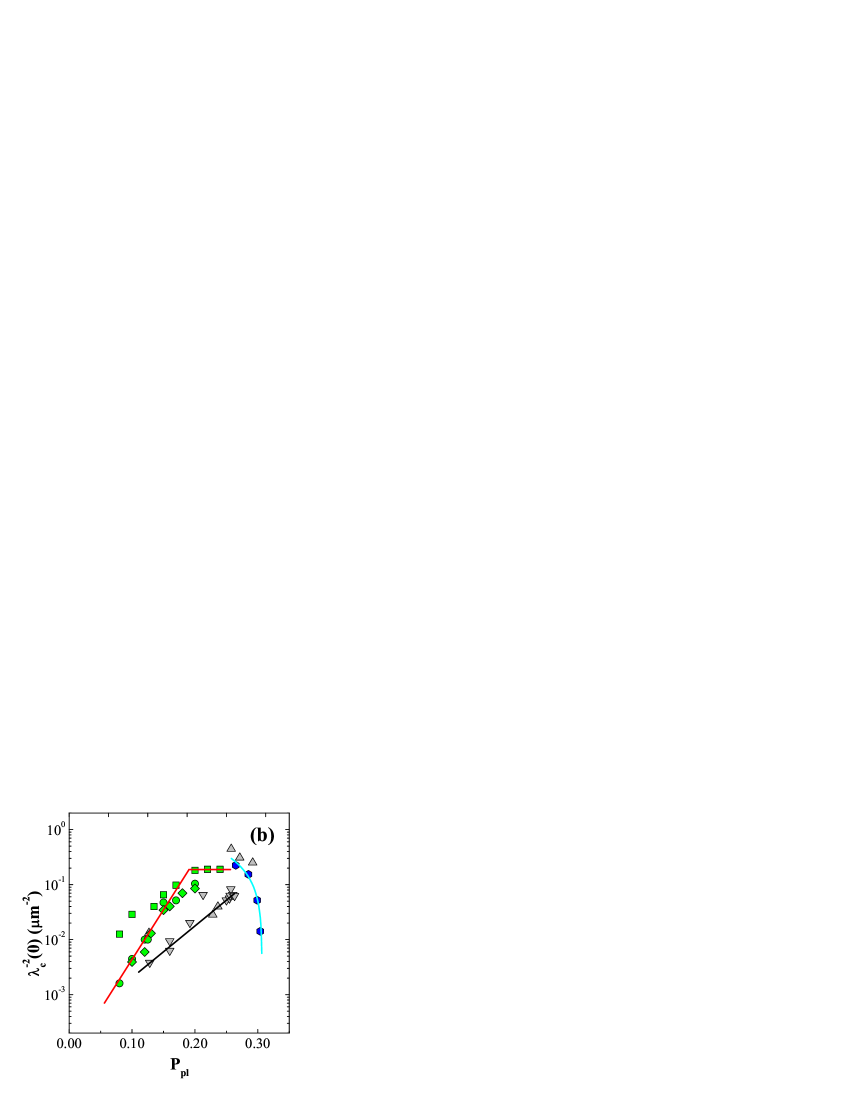
To further demonstrate our point that we should use the hole-doping concentration of the correct dimensionality consistent with the very nature of the physical properties under study, we consider the inverse square of the -axis penetration depth ((0)). The -axis superfluid density ((0)), independent of the -axis coupling mechanism, is intrinsically a 3D property of the HTS. In Fig. 3(a), we plot (0) on the logarithmic scale as a function of [18, 19, 20, 21, 22]. The (0) increases with doping until 2 1021 cm-3, higher than , and either decreases or remains at a constant level beyond. In Fig. 3(b), we plot the same data set of (0) as a function of . In the underdoped side, the trend in (0) for OD-Hg1201 is different from that for SrD-La214. No systematic (0) behaviors can be observed. Thus, the (0) is not governed by the but by the . Accordingly, the (0), independent of the -axis coupling mechanism, is intrinsically a 3D property of the HTS. There are many studies based on the -scale [29] and, to put them into proper prospective, these results should be understood in the context of .
The existence of a universal has an interesting implication to the stability of underdoped electronic states, namely, it is the upper bound of the electronic energy of single-layer HTS. Therefore there is a common physical origin, dictated by , for the transition from underdoped to overdoped regimes. Note that is an effective “3D” hole concentration that is intrinsically consistent with the dominance of Fermi liquid state in 3D electronic systems and the experimental observations that Fermi liquid behavior emerges beyond optimal doping concentration [32]. Using the simple free electron model with hole concentration equal to [33], the corresponding Fermi energy is 0.5 eV, close to the binding energy of the lower Hubbard band ( 0.4 to 0.6 eV) of layered cuprates [34]. More specifically, as suggested in ref. [35], the 0.5 eV is the energy required to promoting a hole from to to form exciton, another plausible channel for hole de-confinement.
4 Summary
We have shown that for HTS there are two types of hole-doping concentration depending on the dimensionality, that is, the effective 3D hole-doping concentration and hole content per Cu-O2 plane defined in ref.[5]. Combining these two we have a complete working scale to address various physical properties for all HTS. Any 2D/in-plane property should be plotted as a function of and any 3D/out-of-plane property as a function of . Indeed, we see that (0) and the magnitude of are governed by , while pseudogap physics is described by [5]. While the is different for different single-layer HTS, we observed a universal = 1.6 1021 cm-3 for single-layer HTS that determines the stability limit of the electronic states of the underdoped regime. The optimal superconducting transition temperature for a specific material system will depend on another material specific energy-scale, such as the inter-plane block spin coupling suggested in ref. [36], along the -axis.
References
References
- [1] Batlogg B and Emery V J 1996 Nature 382 20
- [2] Li Z G, Feng H H, Yang Z Y, Hamed A, Ting S T, Hor P H, Bhavaraju S, DiCarlo J F and Jacobson A J 1996 Phys. Rev. Lett. 77 5413
- [3] Tokura Y, Torrance J B, Huang T C and Nazzal A I 1988 Phys. Rev. B 38 R7156
- [4] Presland M R, Tallon J L, Buckley R G, Liu R S and Flower N E 1991 Physica C 176 95
- [5] Honma T, Hor P H, Hsieh H H and Tanimoto M 2004 Phys. Rev. B 70 214517
- [6] Obertelli S D, Cooper J R and Tallon J L 1992 Phys. Rev. B 46 R14928
- [7] Radaelli P G, Hinks D G, Mitchell A W, Hunter B A, Wagner J L, Dabrowski B, Vandervoort K G, Viswanathan and Jorgensen J D 1994 Phys. Rev. B 49 4163
- [8] Ando Y, Hanaki Y, Ono S, Murayama T, Segawa K, Miyamoto N and Komiya S 2000 Phys. Rev. B 61 R14956
- [9] Yamamoto A, Hu W. Z and Tajima S 2000 Phys. Rev. B 63 024504
- [10] Komiya S, Chen H D, Zhang S C and Ando Y 2005 Phys. Rev. Lett. 94 207004
- [11] Ando Y and Murayama T 1999 Phys. Rev. B 60 R6991
- [12] Ando Y, Murayama T and Ono S 2000 Physica C 341-348 1913
- [13] Ando Y, Lavrov A N, Komiya S, Segawa K and Sun X F 2001 Phys. Rev. Lett.87 017001 ; Ando Y, Kurita Y, Komiya S, Ono S and Segawa K, 2004 Phys. Rev. Lett.92 197001
- [14] Tamasaku K, Ito T, Takagi H and Uchida S 1994 Phys. Rev. Lett. 72 3088
- [15] Nishikawa T, Takeda J and Sato M 1995 J. Phys. Soc. Jpn. 63 1441
- [16] Hwang H Y, Batlogg B, Takagi H, Kao H L, Kwo J, Cava R J, Krajewski J J, Peck W F Jr. 1994 Phys. Rev. Lett. 72 2636
- [17] Tannar M A, Yefanov V S, Dyakin V V, Akimov A I and Chernyakova A 1991 Physica C 185-189 1247
- [18] Uchida S, Tamasaku K and Tajima S 1996 Phys. Rev. B 53 14558
- [19] Homes C C 2004 Nature 430 539
- [20] Wang Y T and Hermann A M 2000 Physica C 335 134
- [21] Panagopoulos C, Xiang T, Anukool W, Cooper J R, Wang Y S, Chu C W 2003 Phys. Rev. B 67 R220502(R)
- [22] Hofer J, Karpinski J, Willemin M, Meijer G I, Kopnin E M, Molinski R, Schwer L, Rossel C and Keller H 1998 Physica C 297 103
- [23] Kubo Y, Shimakawa Y, Manako T and Igarashi H 1991 Phys. Rev. B 43 7875
- [24] Izumi F, Jorgensen J D, Shimakawa Y, Kubo Y, Manako T, Pei Shiyou, Matsumoto T, Hitterman R L, Kanke Y 1992 Physica C 193 426
- [25] Tsvetkov A A, Schützmann J, Gorina J I, Kaljushnaia G A and Marel D van der 1997 Phys. Rev. B 55 14152 ; Groen W A, de Leeuw D M and Stollman G M 1989 Solid State Commun. 72 697
- [26] Wagner J L, Radaelli P G, Hinks D G, Jorgensen J D, Mitchell J F, Dabrowski B, Knapp G S and Beno M A 1993 Physica C 210 447
- [27] Manako T Kubo Y and Shimakawa Y 1992 Phys. Rev. B 46 11019
- [28] Markiewicz R S and Kusko C 2002 Phys. Rev. B 65 064520
- [29] For example; Tallon J L and Loram J W 2001 Physica C 349 53
- [30] Sadewasser S, Schilling J S and Herman A M 2000 Phys. Rev. B 62 9155
- [31] Lorenz B, Li Z G, Honma T and Hor P H 2002 Phys. Rev. B 65 144522
- [32] Takeuchi T, Kondo T, Kitao T, Kaga H, Yang H, Ding H, Kaminski A and Campuzano J C 2005 Phys. Rev. Lett. 95 227004
- [33] Kittel C 2005 Introduction to Solid State Physics, 8th Ed. (New York: John Wiley Sons) p 140
- [34] Yoshida T 2003 Phys. Rev. Lett. 91 027001 ; Ino A 2000 Phys. Rev. B 62 4137
- [35] Hor P H and Kim Y H 2002 J. Phys.: Condens. Matter 14 10377
- [36] Kim Y H and Hor P H 2006 Mod. Phys. Lett. B 20 571