Detection mechanism for ferroelectric domain boundaries
with lateral force microscopy
Abstract
The contrast mechanism for the visualization of ferroelectric domain boundaries with lateral force microscopy is generally assumed to be caused by mechanical deformation of the sample due to the converse piezoelectric effect. We show, however, that electrostatic interactions between the charged tip and the electric fields arising from the surface polarization charges dominate the contrast mechanism. This explanation is sustained by quantitative analysis of the measured forces as well as by comparative measurements on different materials.
pacs:
77.80.Dj, 68.37.Ps, 77.84.-s, 84.37.+qLateral force microscopy (LFM) is usually utilized for the detection of friction forces between tip and sample while scanning the surface. LFM can therefore map topographical steps (roughness) but also different material compositions, whereby the contrast depends strongly on the scanning parameters (velocity, direction etc.) Wie .
In first LFM experiments with ferroelectric samples, investigating GASH and TGS, such dependences were observed, indicating that the domain contrast was due to topographical features, as these materials exhibit domain selective, hygroscopic properties Lue93 ; Gru95 . Domains or domain boundaries have also been revealed by LFM in other crystals such as Wit02 ; Scr05 , Wit02 ; Can03 , Eng98 , and PZT Rod04 ; Rod05 , using the very same experimental setup as for piezoresponse force microscopy (PFM) Alexe . In brief, an alternating voltage (amplitude ; frequency ) is applied to the tip which leads to deformations of the sample due to the converse piezoelectric effect. The resulting vibrations of the surface cause oscillations of the cantilever which can be read out with a lock-in amplifier. For LFM, instead of the bending, the torsion of the cantilever is detected. In the case of anti-parallel -domains, the alternating voltage leads to tilting vibrations of the surface at the domain boundaries. This tilting is supposed to cause lateral forces acting on the tip which result in torsional oscillations of the cantilever Wit02 ; Scr05 . Our investigations show, however, that these torsional oscillations are dominated by the electrostatic interaction between the charged tip and the electric fields arising from the surface polarization charges. We therefore name this detection technique lateral electrostatic force microscopy (LEFM).
For the experiments we used a commercial scanning force microscope (Smena, NT-MDT), modified to allow application of voltages to the tip. The AC-voltage driven bending and torsion of the cantilever were recorded simultaneously as vertical and lateral response, respectively. To obtain accurate experimental data, the alignment of the four-segmented photo-detector with respect to the cantilever is crucial. In case of a misalignment, a pure bending of the cantilever inevitably pretends a (nonexisting) torsion, and vice versa. The magnitude of this cross-talk can be estimated when exciting the cantilever in air at its resonance frequency and comparing the vertical and the lateral response: We measured cross-talks of typically 5 - 20% why we developed a cross-talk compensator which electronically suppresses the cross-talk by a factor of 100. Therefor we add a 180∘ phase-shifted correction-signal of adjustable amplitude to the error-signal. Note that for every cantilever, the compensation has to be adjusted anew.
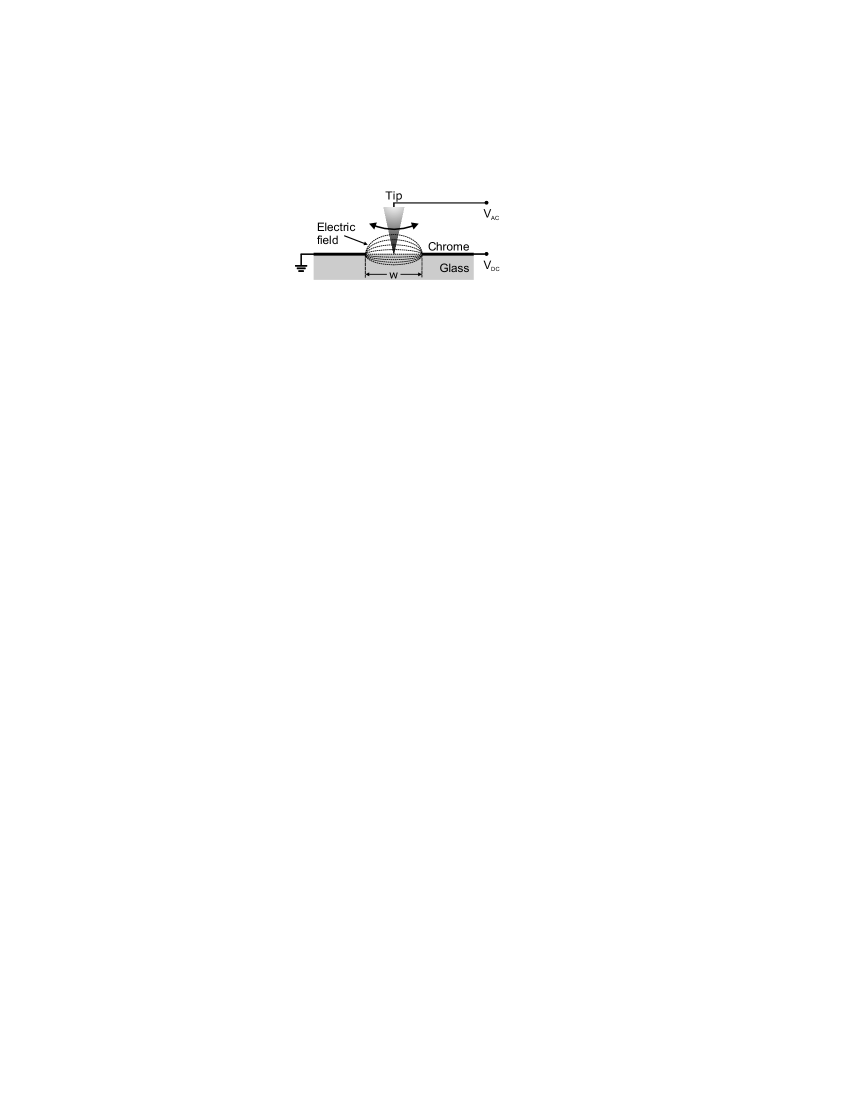
The LEFM setup was calibrated with a sample consisting of a glass plate with chrome electrodes which allow to generate electric fields parallel to the sample surface (Fig. 1). The chrome mask had a thickness of 250 nm and a slit width of µm. Applying a voltage of V to the electrodes generates an electric field of V/m within the slit which at its center is mainly parallel to the surface. The tip ( Vpp; kHz) senses this electric field and performs oscillations which can be read out with a lock-in amplifier. The positioning of the tip was found to be uncritical along a section of at least 10 µm width in the middle of the slit. This setup allows to determine the phase of the oscillations with respect to the direction of the electric field. Furthermore, the influence of friction between tip and sample surface on the oscillation amplitude can be measured: Altering the load up to 30 µN had no influence on the signal, however, when retracting the tip, an enlargement by a factor of 1.5 was measured.
In LFM the orientation of the cantilever with respect to the lateral force acting on the tip is crucial. If is perpendicular to the cantilever, the latter will be forced to twist which can be read out as a torsion signal. If, on the contrary, is orientated parallel to the cantilever, this will lead to a buckling, which can be detected as a deflection signal. The LFM signals were calibrated taking into account the appropriate force constants of the cantilever and assuming that the photo detector has the same sensitivity for vertical as for lateral signals. Be aware that for topographical images the contrast information is height [m] whereas for LFM images it is force [N]. The dimensions of the cantilevers used for the measurements are: length = 130 µm, width = 35 µm, thickness = 1.9 µm, and tip height = 17 µm. Therefore the lateral spring constants are N/m for torsion and N/m for buckling (shear modulus N/m2 and Young’s elasticity modulus N/m2 Lide ). For the sake of completeness we give the deflection spring constant which is N/m.
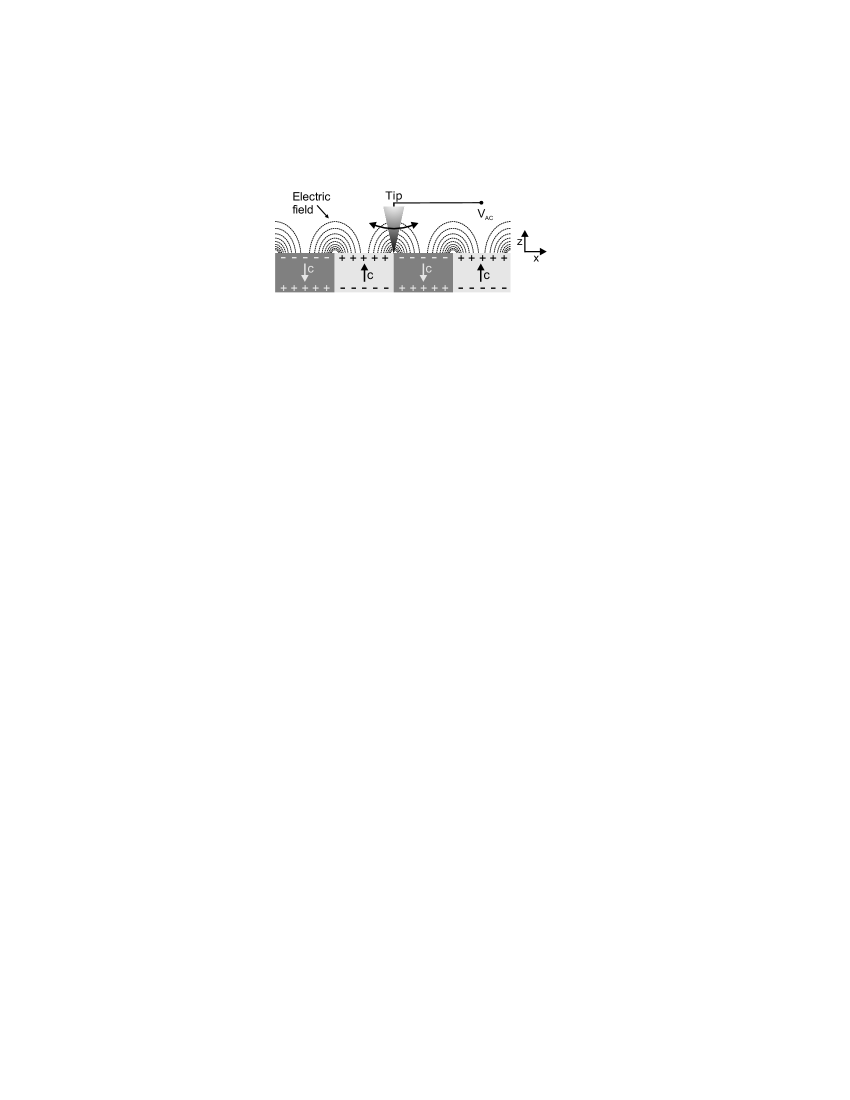
We investigated a -cut periodically-poled crystal (PPLN) with a period length of 8 µm and a thickness of 0.5 mm. The appropriate piezoelectric coefficient is known to be pm/V and the (uncompensated) surface polarization charge density is C/m2 Landolt . Figure 2 shows a sidewise sketch of a PPLN crystal. Because of the surface polarization charges, electric fields build up whose strength parallel to the surface is most at the domain boundaries. The electric field with being the axis parallel to the surface and perpendicular to the domain boundaries, and denoting the distance from the sample surface (Fig. 2) for an infinite PPLN structure is given by
with denoting the domain size (PPLN period: ) and the number of domains being included. For the PPLN sample electric field strengths of V/m are theoretically expected if no compensation of the surface charges is assumed.
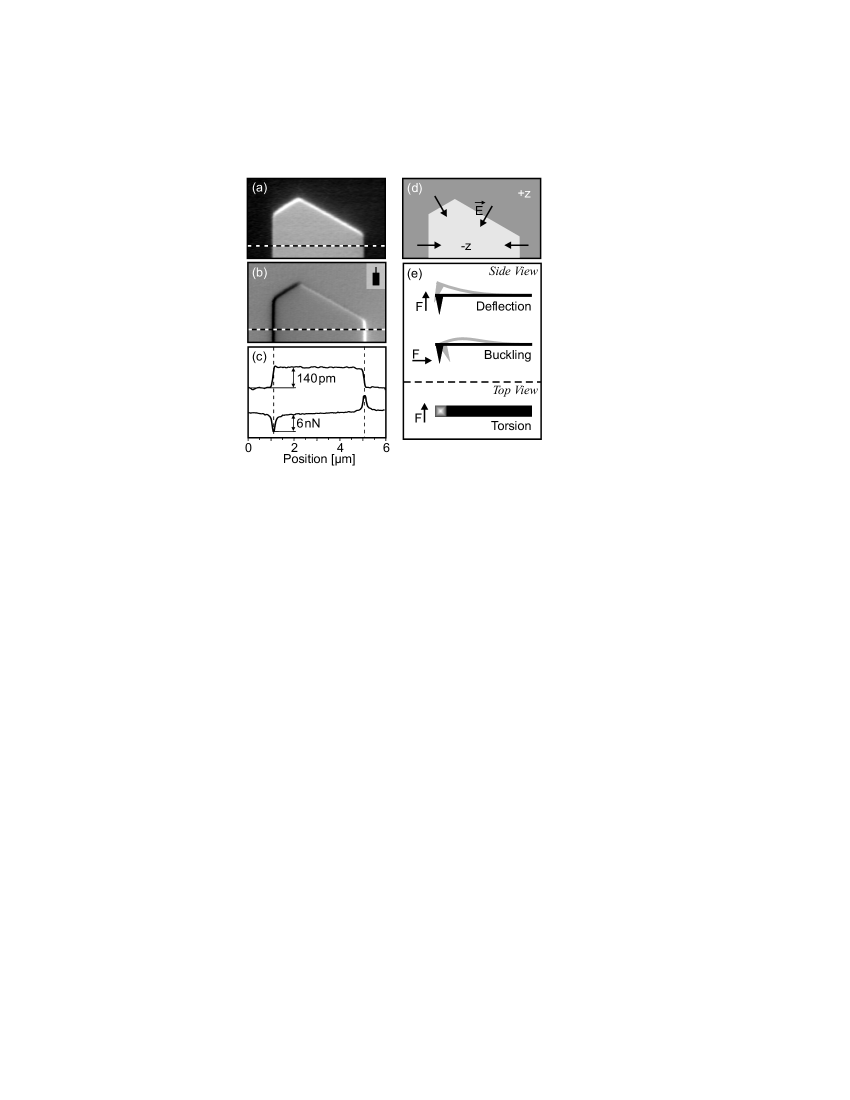
In Fig. 3 the experimental results for deflection (a) and torsion (b) images of the end of a poled stripe of PPLN are shown, with the corresponding scan lines in (c). The orientation of the cantilever was chosen to be parallel to the stripe (see also inset of Fig. 3(b)). At first sight it is obvious that the deflection image (a) shows the domain faces (due to the converse piezoelectric effect) whereas the torsion image (b) only shows the domain boundaries, at the left edge as a dark stripe and at the right edge as a bright stripe. The contrast inversion is due to the change of the direction of the electric field (see also Fig. 3(d)). This is consistent with the results we obtained with the test sample from Fig. 1, where we determined the sign of the output of the lock-in amplifier with respect to the direction of the electric field. The contrast is reduced when the electric field vector perpendicular to the cantilever becomes smaller as it can be seen on the tilted edges of the domain. As the cross-talk between vertical and lateral signals was suppressed, the level of the torsion signal within and outside the domain is same. Looking more closely at Fig. 3(a), at the top edges of the domain a bright stripe is visible. When comparing with the schematic drawing of the electric field configuration in Fig. 3(d) at these edges the electric field has a component along the axis of the cantilever. This also leads to lateral forces acting on the tip which result in a buckling of the cantilever.
To summarize the experimental results of Fig. 3: the deflection image Fig. 3(a) shows the vertical movement of the cantilever due to the converse piezoelectric effect and, at the top edges the electrostatic interaction of the periodically charged tip with the electric field which leads to a buckling of the cantilever (upper part of Fig. 3(e)). The torsion image Fig. 3(b) only shows the electric field component perpendicular to the axis of the cantilever (lower part of Fig. 3(e)).
To support our explanation, that lateral forces measured at the domain boundaries are due to electrostatic interactions of the periodically charged tip with the electric field arising from the surface polarization charges, we analyzed the data quantitatively. Assuming a tip radius of nm and a voltage of Vpp applied to it results in a charge of C. In an external electric field V/m this leads to a force N. As the strength of the electric field is directly proportional to the surface charge density , comparing this result with the measured value of nN underlines that the surface charge is reduced by three orders of magnitude by compensation charge which agrees with other publications Kal01 ; Lik01 .
For comparison, we estimated the lateral forces expected from the tilting of the surface due to the converse piezoelectric effect. From the tip size and the lateral resolution in PFM measurements one can assume that the tilt of the surface occurs in a region of nm diameter. The maximum vertical surface displacement in is pm with applied to the tip. The surface can then be described as a inclined plane with an angle of . A vertical force acting on this inclined plane can be vectorially devised in two components: one normal to the slanted surface () and the other one parallel to it () causing a torsion of the cantilever. From simple geometrical considerations it is evident that because of being very small. When operating a scanning force microscope in contact mode, the typical load of the tip acting on the surface is nN Wie and therefore the expected lateral forces are nN. This is smaller by almost three orders of magnitude than the values measured e.g. in Fig. 3(b). Therefore the mechanical contribution to the lateral forces is negligible. Furthermore, we have not observed any dependence of the lateral forces measured on the load of the tip, as it is required for this contrast mechanism.
Finally we carried out comparative LEFM measurements on and SBN crystals. Because the piezoelectric coefficient of SBN is three times larger than of , the expected tilting of the surface at the domain boundaries should be much steeper. The measured lateral forces, however, are smaller by a factor of 6 with respect to those on . This agrees well with an electrostatic origin of the lateral forces as the surface polarization charge density is smaller for SBN than for .
In conclusion, we have shown that the origin of the contrast mechanism for the detection of domain boundaries in lateral force microscopy is dominated by the electrostatic interaction of the charged tip with the electric field arising from the surface polarization charges. A quantitative estimate as well as comparative measurements on and SBN crystals sustain this explanation.
Acknowledgements.
We thank Boris Sturman for fruitful discussions. Financial support of the DFG research unit 557 and of the Deutsche Telekom AG is gratefully acknowleged.References
- (1) R. Wiesendanger Scanning Probe Microscopy and Spectroscopy : Methods and Applications (Cambridge University Press, 1994)
- (2) R. Lüthi, H. Haefke, K.-P. Meyer, E. Meyer, L. Howald, and H.-J. Güntherodt J. Appl. Phys. 74, 7461 (1993).
- (3) A. Gruverman, O. Kolosov, J. Hatano, K. Takahashi, H. Tokumoto, J. Vac. Sci. Technol. B 13, 1095 (1995).
- (4) J. Wittborn, C. Canalias, K. V. Rao, R. Clemens, H. Karlsson, and F. Laurell, Appl. Phys. Lett. 80, 1622 (2002).
- (5) D. A. Scrymgeour and V. Gopalan, Phys. Rev. B 72, 024103 (2005).
- (6) C. Canalias, V. Pasiskevicius, A. Fragemann, and F. Laurell, Appl. Phys. Lett. 83, 734 (2003).
- (7) L. M. Eng, H.-J. Güntherodt, G. Rosenman, A. Skliar, M. Oron, M. Katz, and D. Eger, J. Appl. Phys. 83, 5973 (1998).
- (8) B. J. Rodriguez, A. Gruverman, A. I. Kingon, R. J. Nemanich, and J. S. Cross, J. Appl. Phys. 95, 1958 (2004).
- (9) B. J. Rodriguez, A. Gruverman, A. I. Kingon, R. J. Nemanich, and J. S. Cross, Appl. Phys. A 80, 99 (2005).
- (10) M. Alexe and A. Gruverman, eds., Nanoscale Characterisation of Ferroelectric Materials (Springer, Berlin; New York, 2004) 1st ed.
- (11) D. R. Lide, ed., CRC Handbook of chemistry and physics (CRC press, Boca Raton, 1993).
- (12) K.-H. Hellwege and A. M. Hellwege, eds., Landolt Börnstein - Numerical data and functional relationships in science and technology Group III Volume 16 (Springer, Berlin; New York, 1981).
- (13) S. V. Kalinin and D. A. Bonnell, Phys. Rev. B 63, 125411 (2001).
- (14) V. Likodimos, M. Labardi, M. Allegrini, N. Garcia, and V. V. Osipov, Surf. Sci. 490 76 (2001)