Low-energy excitations in the magnetized state of the bond-alternating quantum chain system NTENP.
Abstract
High intensity inelastic neutron scattering experiments on the =1 quasi-one-dimensional bond-alternating antiferromagnet Ni(C9D24N4)(NO2)ClO4 are performed in magnetic fields of up to 14.8 T. Excitation in the high field magnetized quantum spin solid (ordered) phase are investigated. In addition to the previously observed coherent long-lived gap excitation [M. Hagiwara et al., Phys. Rev. Lett 94, 177202 (2005)], a broad continuum is detected at lower energies. This observation is consistent with recent numerical studies, and helps explain the suppression of the lowest-energy gap mode in the magnetized state of NTENP. Yet another new feature of the excitation spectrum is found at slightly higher energies, and appears to be some kind of multi-magnon state.
pacs:
75.40.Gb, 75.10.Jm, 75.50.EeI Introduction
The spin dynamics of gapped one-dimensional (1-D) quantum magnets in high magnetic fields has recently become an area of intensive research. The lowest-energy excitations in these systems are typically an triplet, and therefore subject to Zeeman splitting by an external field. With increasing field the gap in one of the three modes decreases and eventually vanishes, leading to a 1-D Bose condensation of magnons.Schulz (1986); Katsumata et al. (1989); Affleck (1990); Takahashi and Sakai (1991) A qualitatively new state emerges at higher fields. In the presence of magnetic anisotropy it is characterized by long-range Neel order. Despite that, its dynamical properties are nothing like those of conventional 3-D magnets. Quasiclassical spin wave theory (SWT) breaks down on the qualitative level, and the ground states are exotic “quantum spin solids”. Such is the case for the Haldane gap compounds NDMAP Honda et al. (1998); Chen et al. (2001); Zheludev et al. (2002, 2003); Zhe and NENP,Reg (a) where at there are three distinct magnon branches, while SWT can account for only two.
The excitation spectrum in the high-field phase is non-universal, but can qualitatively vary from one spin system to another. In a recent work we investigated the bond-alternating dimerized chain compound NTENP.Narumi et al. (2001); Zheludev et al. (2004); Reg (b) Like the structurally similar NDMAP, at this material has a singlet ground state and a triplet of coherent gap excitations. It goes through a soft mode antiferromagnetic ordering transition at T in a field applied parallel to the spin chains, and T in a transverse field. Narumi et al. (2001) However, its dynamical properties in a field are markedly different: only one coherent mode survives in the high-field phase of NTENP.Hagiwara et al. (2005); Zhe The highest-energy gap mode disappears well below . This is due to interactions between magnons that mix single-magnon and two-magnon states, opening an effective decay channel for the upper mode.Suzuki and Suga (2005); Zhitomirsky ; Kolezhuk and Sachdev In addition, the lowest-energy mode (the one that goes soft), is a sharp long-lived excitation at all fields below the transition, but is absent in the magnetized phase. Thus, only the middle mode persists above . This one-mode picture is at present poorly understood. In the present paper we report a high intensity inelastic neutron scattering study that sheds new light on this peculiar behavior. At high fields, apart from the previously seen single coherent mode, we find a novel gapped low-energy excitation continuum.
II Experimental procedures and results
The structural elements of NTENP are discussed elsewhere, so only the key features are summarized here. NTENP crystallizes in the triclinic system (space group ) with lattice constants =10.747(1), =9.413(2), =8.789(2), =95.52(2)∘, =108.98(3)∘ and =106.83(3)∘. The Ni2+ ions are bridged by nitrito groups along the axis with alternating bond distances of 2.142(3) and 2.432(6) , and corresponding exchange constants are estimated as meV and meV. Single-ion easy-plane anistropy of type is significant with , where is the average coupling constant. In the experiments we employed a fully deuterated NTENP single crystal of approximate volume mm3. Sample environment was a 15 T split coil superconducting magnet with a dilution refrigerator insert. Inelastic neutron data were collected at the IN14 cold-neutron spectrometer at Institut Laue-Langevin. In most cases neutrons with a fixed final energy (wave number) of 2.74 meV (1.15 Å-1) were used with a Be higher-order filter positioned after the sample and a horizontally focusing Pyrolitic Graphite (PG) analyzer. No additional beam collimation devices were used. The sample was in all cases mounted with the axis vertical (parallel to the applied field), allowing access to wave vectors in the reciprocal-space plane.
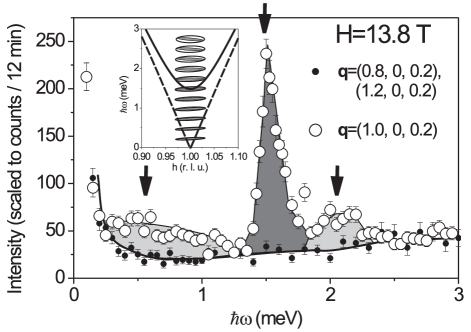
The data were collected in constant- scans near the 1D AF zone-centers and . Typical raw data are shown in Fig. 1 (open circles). The background (Fig. 1, solid circles) was measured at and , and found to be field-independent. A 5-point smoothed average of all background scans was subtracted from the data at each field. The resulting data sets collected at several fields are shown in Figs. 2 and 3. They are to be compared with the data shown in Figs. 2 and 4 of Ref. Hagiwara et al., 2005, that were measured on a considerably less intense neutron source, with a somewhat broader energy resolution.

The new data for are consistent with previous measurements. They clearly show a gap mode at meV and a strong gapless feature at low energies. The latter corresponds to the excitation branch that went soft at the critical field. At higher fields, the scattering intensity at low energies decreases, but does not vanish entirely, as previously assumed.Hagiwara et al. (2005) Instead, it is transformed into a broad peak (lower light shaded area in Fig. 1a) that is positioned below the strong coherent mode (dark shaded area in Fig. 1a). The low intensity of this new feature explains why it could not be reliably detected in previous experiments: only a hint of a low-energy peak is visible in Fig. 4c of Ref. Hagiwara et al., 2005. The new feature persists at higher fields, and its gap increases, with an intensity maximum shifting to around 0.6 meV at . At this field it is also observed at an equivalent but larger and almost orthogonal scattering vector (Fig. 3). Here the intensity is considerably smaller, consistent with its magnetic (as opposed to vibrational) origin. It is important to emphasize that, unlike the sharp and intense lowest-energy mode in NDMAP, the low-energy feature in NTENP remains very broad and weak in the entire accessible field range.
At the highest fields, yet another new feature of the spectrum is revealed at meV energy transfer (upper light shaded area in Fig. 1a, and Figs. 2c,d). The new peak is also detected at (Fig. 3). This peak clearly does not correspond to the highest-energy member of the triplet seen at low fields. Indeed, the latter vanishes well below , and it energy extrapolates to much higher values with increasing field (somewhere in the range 3–3.5 meV at T). Although at present we can not irrefutably prove that the new feature does not originate from spurious scattering, that possibility seems rather unlikely. Indeed, the peak is observed at several wave vectors, does not increase at a larger wave vector, shows a clear field dependence, and, as will be discussed below, appears to have a meaningful polarization character. In the discussion below we shall assume that it is in fact real and magnetic in nature.
III Data analysis and discussion
In order to learn more about the newly observed excitations, we performed fits to the experimental data, taking into account the effects of instrument resolution. The model cross section used for these fits included three separate branches, the partial contribution of each mode written as:
| (1) | |||
| (2) |
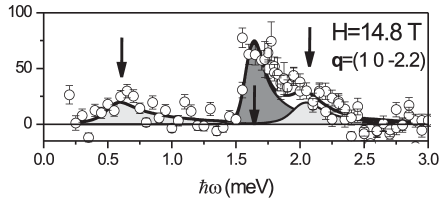
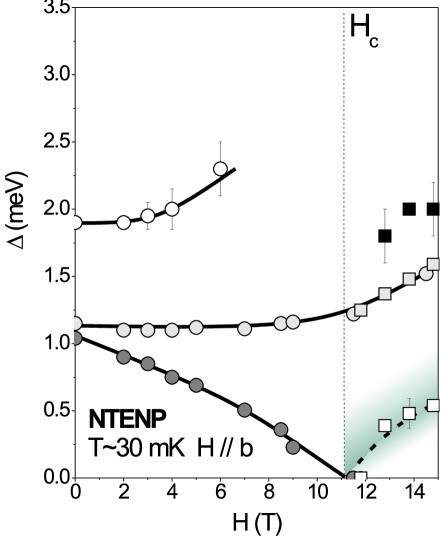
where is the dispersion relation for mode , is a normalized peak shape function of width , taken in the Lorentzian or Dirac’s -function (for ) form, and meV is the previously determined spin wave velocity.Zheludev et al. (2004); Reg (b); Hagiwara et al. (2005) The model cross section was numerically convoluted with the resolution function of the spectrometer that was calculated in the Popovici approximation.Popovici (1975) The intensities and widths of each mode, as well as the gap energies were refined to best-fit the experimental data at each field. The results of the fit are shown in heavy solid lines in Fig. 2. The grayed areas represent partial contributions of each mode. The excitation energies are plotted against the strength of applied field in Fig. 4 (squares). Here we also show the data from previous studies (circles).Hagiwara et al. (2005)
The fits consistently yielded a zero intrinsic energy width for the central coherent mode. However, at the lowest-energy feature is clearly broader than experimental energy resolution. Its intrinsic energy full width at half height as about 0.30(6) meV at T, and decreases to 0.15(4) meV at the highest accessible field of 14.8 T. The broad nature of this excitation is emphasized by the dashed lines in Fig. 2 that represent the calculated resolution width. We thus conclude that at the lowest-energy excitations in NTENP are actually a continuum of states, rather than a single long-lived coherent mode as, for instance, in NDMAP. Such behavior is fully consistent with the Lanczos diagonalization results of Ref. Suzuki and Suga, 2005. Indeed, that numerical study predicted three coherent modes for NDMAP and only one for NTENP, but also a low-lying continuum of excitations in the latter system. In NTENP the observed intensity maximum of the low-energy spectral feature can be associated with the singularity on the lower bound of the continuum. This interpretation is consistent with the observed continuum spectrum being gapped or, at least, showing a pseudogap behavior.
For the “2 meV” excitation, a zero intrinsic width was assumed for T, where it is plainly too weak for a meaningful peak-shape analysis. However, at at T (Fig. 3) the feature is clearly broad beyond the effect of experimental resolution. At this field its intrinsic width was determined to be 0.12(6) meV, comparable to that of the low-energy continuum.
Additional information on the excitations in the high-filed phase was obtained in a partial polarization analysis at the highest accessible filed of T. This procedure involved a comparison of the inelastic intensities measured at (Fig. 2c) and the equivalent wave vector (Fig. 3). Note that, due to the large values of the crystallographic angle , these two wave vectors are almost orthogonal to each other, and form angle of and with the (chain) axis, respectively. Neutron spectroscopy probes only the fluctuations of spin components perpendicular to the scattering vector. For the intensity scaling factors for excitation polarized along the (parallel to the chains), (in the horizontal plain, perpendicular to the chains) and (vertical) axes are 0.30, 0.70 and 1.0, respectively. For the corresponding coefficients are 0.85, 0.15 and 1.0. Fits to the experimental data reveal that, corrected for resolution effects and the Ni2+ magnetic form factor, the intensities of all three components of the spectrum vary between the two wave vectors. At the corrected intensities of the central coherent mode and the low-energy continuum are decreased by factors of 1.6(1) and 1.27(4), respectively, as compared to . In contrast, after form factor and focusing corrections, the “2meV” excitation is stronger at , by a factor of 2.4(3). This intensity pattern is consistent with the “2meV” excitation being polarized parallel to the spin chains, and the two lower-energy modes being transverse in nature.
Regarding the origin of the “2 meV” feature, we note that its peak energy is approximately equal to the sum of the gap in the main coherent mode and the energy of the intensity maximum of the continuum. This may indicate that the “2 meV” mode is a composite excitation of these two lower-energy states, similar to bound magnon states in the classical magnet TMMC.Heilmann et al. (1981) Such excitations near are permitted by energy-momentum conservation laws. Indeed, the intrinsic breaking of translational symmetry (bond-alternation) in NTENP makes the wave vectors and equivalent, allowing excitations of total momentum composed of a continuum state near and a single-magnon state at , or vice versa. A further theoretical study is required to clarify this point.
IV Conclusion
The examples of NDMAP and NENP may lead to a simple-minded conclusion that the high field phase of anisotropic gapped quantum spin chains is entirely dominated by long-lived coherent excitations. The new results on NTENP clearly demonstrate the opposite: broad spectral continua may, in fact, play a key role in the dynamics of highly anisotropic quantum spin solids even at low energies.
Acknowledgements.
We thank Sei-Ichiro Suga and Takahumi Suzuki for fruitful discussions. This work was in part supported by the Molecular Ensemble research program from RIKEN and the Grant-in-Aid for Scientific Research on Priority Areas from the Japanese Ministry of Education, Culture, Sports, Science and Technology. Work at ORNL was sponsored by the Division of Materials Sciences and Engineering, Office of Basic Energy Sciences, U.S. Department of Energy, under contract DE-AC05-00OR22725 with Oak Ridge National Laboratory, managed and operated by UT-Battelle, LLC.References
- Schulz (1986) H. J. Schulz, Phys. Rev. B 34, 6372 (1986).
- Katsumata et al. (1989) K. Katsumata, H. Hori, M. D. T. Takeuchi, A. Yamagishi, and J. P. Renard, Phys. Rev. Lett. 63, 86 (1989).
- Affleck (1990) I. Affleck, Phys. Rev. Lett. 65, 2477 (1990).
- Takahashi and Sakai (1991) M. Takahashi and T. Sakai, J. Phys. Soc. Jpn. 60, 760 (1991).
- Honda et al. (1998) Z. Honda, H. Asakawa, and K. Katsumata, Phys. Rev. Lett. 81, 2566 (1998).
- Chen et al. (2001) Y. Chen, Z. Honda, A. Zheludev, C. Broholm, K. Katsumata, and S. M. Shapiro, Phys. Rev. Lett. 86, 1618 (2001).
- Zheludev et al. (2002) A. Zheludev, Y. C. Z. Honda, C. Broholm, and K. Katsumata, Phys. Rev. Lett. 88, 077206 (2002).
- Zheludev et al. (2003) A. Zheludev, Z. Honda, C. Broholm, K. Katsumata, S. M. Shapiro, A. Kolezhuk, S. Park, and Y. Qiu, Phys. Rev. B 68, 134438 (2003).
- (9) A. Zheludev, cond-mat/0507534 (2005).
- Reg (a) L.P. Regnault, I. Zaliznyak, J.P. Renard, and C. Vettier, Phys. Rev. B 50, 9174 (1994).
- Narumi et al. (2001) Y. Narumi, M. Hagiwara, M. Kohno, and K. Kindo, Phys. Rev. Lett. 86, 324 (2001).
- Zheludev et al. (2004) A. Zheludev, T. Masuda, B. Sales, D. Mandrus, T. Papenbrock, T. Barnes, and S. Park, Phys. Rev. B 69, 144417 (2004).
- Reg (b) L. P. Regnault, M. Hagiwara, N. Metoki, Y. Koike, K. Kakurai, and A. Stunault, Physica B 66, 350B (2004).
- Hagiwara et al. (2005) M. Hagiwara, L. P. Regnault, A. Zheludev, A. Stunault, N. Metoki, T. Suzuki, S. Suga, K. Kakurai, Y. Koike, P. Vorderwisch, et al., Phys. Rev. Lett. 94, 177202 (2005).
- Suzuki and Suga (2005) T. Suzuki and S. Suga, Phys. Rev. B 72, 014434 (2005).
- (16) A. Kolezhuk and S. Sachdev, cond-mat/0511353.
- (17) M. E. Zhitomirsky, cond-mat/0601405.
- Popovici (1975) M. Popovici, Acta Cryst. A31, 507 (1975).
- Heilmann et al. (1981) I. Heilmann, J. Kjems, Y. Endoh, G. Reiter, G. Shirane, and R. Birgeneau, Phys. Rev. B 24, 3939 (1981).