Infrared properties of Mg1-xAlB1-yCy)2 single crystals in the normal and superconducting state
Abstract
The reflectivity of -oriented Mg1-xAlx(B1-yCy)2 single crystals has been measured by means of infrared microspectroscopy for cm-1. An increase with doping of the scattering rates in the and bands is observed, being more pronounced in the C doped crystals. The -band plasma frequency also changes with doping due to the electron doping, while the -band one is almost unchanged. Moreover, a interband excitation, predicted by theory, is observed at eV in the undoped sample, and shifts to lower energies with doping. By performing theoretical calculation of the doping dependence , the experimental observations can be explained with the increase with electron doping of the Fermi energy of the holes in the -band. On the other hand, the band density of states seems not to change substantially. This points towards a reduction driven mainly by disorder, at least for the doping level studied here. The superconducting state has been also probed by infrared synchrotron radiation for cm-1 in one pure and one C-doped sample. In the undoped sample ( = 38.5 K) a signature of the -gap only is observed. At = 0.08 ( = 31.9 K), the presence of the contribution of the -gap indicates dirty-limit superconductivity in both bands.
pacs:
74.70.Ad, 74.25.Gz, 74.62.DhI Introduction
Since the discovery of superconductivity in MgB2 (40K)Nagamatsu the electronic properties of this system have been intensively studied from a theoretical and experimental point of view. The band structure of MgB2 is characterized by two distinct electronic bands: the quasi two-dimensional band, formed by the hybridized spxpy B orbitals and consisting of two holelike sheets, and the three-dimensional band, made of pz orbitals and consisting of two hole-like and one electron-like honeycombs. Liu ; Kortus ; An ; Uchiyama ; Yelland ; Eltsev The disparity between - and - band suppresses impurity interband scattering giving rise to the most intriguing feature of the superconductor MgB2, that is multigap superconductivity. The bands holes are strongly coupled to the in plane boron mode EAn ; Choi ; Golubov ; Kong and originate a large superconducting gap (), whereas a small one opens on -bands (). Szabo ; Iavarone ; Eskildsen ; Wang ; Bouquet ; Tsuda ; Quilty ; Souma The electronic properties of MgB2 can be modified by chemical substitution. The two elements which substitute most readily in MgB2 are Al for Mg and C for B (an exhaustive collection of literature data is reported in Ref. Kortus05, ). Atomic substitutions change the electronic properties of MgB2 both by increasing the impurity scattering (interband and intraband) and by changing the electron density. Indeed, C and Al have one more electron than B and Mg respectively, and therefore it is expected that electrons are doped into the system. The most evident effect of Al and C doping is the decrease of [see for example Refs. Bianconi, and Kazakov05, and references therein].
Two changes in the electronic properties with doping can be considered. The first change is the shift of the Fermi level. Although electron doping is expected from the valence consideration, the experimentally observed evidence is unclear. The change of the electron density was tentatively estimated by means of Hall effect measurements, Masui but a quantitative and selective analysis of Hall coefficient is difficult in a multi-band system. In MgB2 the band filling due to electron doping should reduce the carrier density in the hole like -band, but experimentally it is not yet clear if this effect leads to a decrease of the density of states at the Fermi level . The decrease of , which enters electron-phonon coupling constant , would lead to a reduction of and of the energy gaps . The second change is the increase of carrier (inter-band and intra-band) scattering rate. The latter effect was estimated by several experiments, as, for example, measurements of resistivity and upper critical field. Ohmichi ; Ribeiro ; Karpinski05 ; Kazakov05 ; Masui These effects are much stronger in C than in A substituted systems. In particular, a quantitative estimate of the change of the intra-band scattering rate in the and band, selectively, has been given by far infrared measurement of the reflectivity above and below in Al doped and neutron irradiated polycrystalline samples.Ortolani Evidence for the increase of the inter-band scattering rate was given by measuring the merging of the two gap with C substitution. Gonnelli Indeed, while intra-band impurity scattering is expected to reduce by disorder-induced pair breaking, a small inter-band impurity scattering may lead to a mix of and Cooper pairs, averaging the order parameters ( 7meV and meV) and reducing down to the isotropic value. Golubov97
Infrared (IR) spectroscopy, when performed on oriented samples, is a powerful tool to measure both the carrier density and the scattering rate selectively in the two bands. Furthermore, IR spectroscopy is also a bulk probe of the superconducting state, which can provide the gap values, as demonstrated recently in polycrystalline MgB2. Ortolani Although more detailed information can be obtained in single crystals than in polycrystalline samples, however the small size of available MgB2 single crystals (typically 0.3x0.3 mm2) has been up to now a strong limit for the use of the IR spectroscopy. Indeed, this technique is challenging on such samples, because of low signal intensity, further reduced by diffraction effects. For this reasons, until now, an extensive IR spectroscopic work at low temperature has been carried out on polycrystals Fudamoto ; Kuzmenko01 ; Gorshunov ; Ortolani and oriented films Tu ; Lobo only. However, for a deeper insight in the fundamental properties of MgB2, oriented single crystal are needed, since in films and polycrystals both the intergrain effects and the increase in the scattering rate of the carriers are present and may change the electronic properties qualitatively. The infrared response of MgB2 single crystals in the superconducting state was first investigated by Perucchi et al. Perucchi as a function of temperature and magnetic field. To increase the signal in the far-infrared region ( cm-1), where conventional sources provide poor photon flux, Perucchi et al. built a mosaic of several crystallites. Although clear effects of the superconducting transition could be observed in Ref. Perucchi, , the reflectivity was lower than 70% for cm-1. More recently, Guritanu et al. Kuzmenko investigated the optical response of single crystallites of MgB2 in the mid-infrared and visible range at room . They found below 6000 cm-1 with field parallel to the -plane. This value of can be reconciliated with band calculation predictions belashenko ; Ravindran and dc-conductivity () measurements, Kazakov05 ; Masui indicating that the use of single crystallites seems to be preferred for an extensive study of the electronic properties by infrared spectroscopy.
In the present work we measure in MgB2 single crystal at room temperature, and investigate how it is modified by C and Al doping. in the pure sample is in agreement with the results of Ref. Kuzmenko, . Pure and doped crystals show a metallic, with a pseudo plasma-edge at around 2 eV slightly decreasing on doping. With increasing C or Al content, the expected increase of the scattering rates in the () and () bands is observed. The plasma frequency of the band is affected by electron doping too, while that of the band is almost constant. Furthermore, an absorption band at eV is found in the pure sample, which becomes less evident and finally disappears as doping proceeds. The latter feature, not observed in previous infrared experiments on pure MgB2 single crystals, Kuzmenko is explained here in terms of interband electronic transition by direct comparison with band structure calculations. The calculated and observed redshift of the -interband transition with C- and Al- doping allows us to provide an estimate of the corresponding Fermi level shift.
Since the band in the pure compound fulfills the clean-limit condition (), Quilty the superconducting transition is not expected to strongly modify the infrared absorption around . This is not the case for the dirty-limit -band. Indeed previous infrared experiments in the superconducting state Perucchi ; Tu found an increase of around only. However, the increase of is expected to make the effect of the large gap observable in the far infrared spectrum, as demonstrated in Ref. Ortolani, on a neutron-irradiated polycrystalline sample. In the present work, we show the different far-infrared response below of a pure and a C-doped single crystal, which can be ascribed to the transition towards dirty superconductivity with C-doping in MgB2.
II Experimental
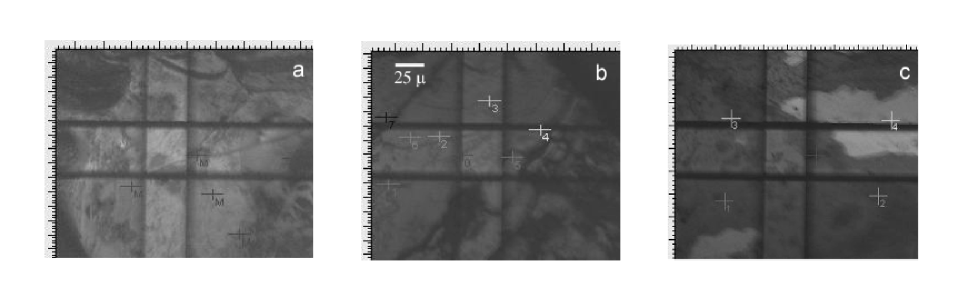
We selected a series of C-doped and a series of Al-doped crystallites (see Table 1). The -oriented surface is not larger than 300x300 m in doped crystals, and it often presents cracks and holes when inspected at the optical microscope (see Fig.1), thus making a normal-incidence reflectivity measurement very challenging. However, we have selected clean surfaces for reflectivity measurements in the mid-infrared range by means of an infrared microscope, where the beam coming from the interferometer is focused in a micrometric spot-size by means of a beam condenser. However, infrared microscopy is limited on the low-frequency side around 200 cm-1 (radiation wavelength of 50 m) by diffraction effects. The study of the superconducting state requires photon energies of the order of the gap or smaller, i.e. cm-1 ( 12 meV). Infrared Synchrotron Radiation (IRSR) with a conventional normal-incidence reflectivity setup was used in the present work to provide a photon flux density high enough to get a signal in the far-infrared from a 300x300 m single crystal inside a cryostat.
For the synthesis of Al and C substituted MgB2 crystals a high-pressure growth method has been applied. Karpinski03 A detailed description of the technique can be found in Refs. Karpinski05, and Kazakov05, for Al and C doped system, respectively. The Al and C content of each sample studied is listed in Table 1 together with superconducting determined by magnetization measurements.
| batch | code | x | y | (K) |
| AN406/1 | P | 0 | 0 | 38.5 |
| AN284/9 | C5.3 | 0 | 0.053 | 34.75 |
| AN286/6 | C8.3 | 0 | 0.083 | 31.9 |
| AN277/5 | C9.7 | 0 | 0.097 | 29.0 |
| AN258/2 | C11.4 | 0 | 0.114 | 23.5 |
| AN262/19 | A7.2 | 0.072 | 0 | 33.05 |
| AN273/1 | A11.8 | 0.118 | 0 | 30.5 |
We used an Hyperion-2000 infrared microscope connected to a Bruker IF66 interferometer to select clear apertures of 40x40 m on the surface of each sample. Gold was evaporated on a portion of the sample surface to get an in-situ reference signal (see Fig. 1). The final is obtained by multiplying for the reflectivity of gold. A 40x40 m clear aperture is large enough that there is no need to use the IRSR source, so that a conventional thermal source and a tungsten filament lamp were employed. The reflectivity ) in Fig. 2 and 3 was measured at room temperature for cm-1 with a 15x beam condenser. The low-frequency cut-on is due to the microscope detector, while the high-frequency cut-off, close to the gold screened plasma frequency ( 2 eV), is mainly due to the gold film deposited on the microscope mirrors and to errors in the gold reflectivity correction procedure. The response of MgB2 single crystals in the superconducting state has been investigated in the present work by normal-incidence reflectivity ratio measurements by FT-IR in the far-infrared range, where the photon energy is of the order of the superconducting gap ( meV).
The measurements at low- and low- were performed at the infrared beamline IRIS at the BESSY-II storage ring in Berlin, Germany. The beam collected at the end of a bending magnet from vertical angle of 40 mrad is sent to a Bruker IF66 interferometer equipped with a liquid-He cryostat and a normal-incidence reflectivity setup. A cut-on optical filter at 100 cm-1 was put in front of a 4.2 K bolometer. The intensity of the IRSR source is about one order of magnitude larger than that of a Hg-arc lamp, depending on the current inside the storage ring (typical values are 150 250 mA). However, the signal-to-noise ratio of the far-infrared data from a 300x300 m sample is strongly limited by several experimental problems, which we now discuss. Information on the gap value of MgB2 has been obtained from FT-IR measurements in far-infrared on pellets, Ortolani films, Tu and single crystal mosaics. Perucchi However, we decided to measure the intensity reflected by one single crystal, not a mosaic or a film, in order to be able to compare the data with quantitative models of the electrodynamic in-plane response, based on the Bardeen-Cooper-Schrieffer (BCS) theory, which includes the plasma frequencies, the scattering rates and the superconducting gaps of both the and the band (see section IV). The disadvantage is that the available surface area for the reflection (300x300 m2) is 50 to 1000 times smaller than that, for example, of Refs. Tu, ; Perucchi, ; Ortolani, . The loss of signal intensity could in principle be recovered by the use of infrared synchrotron radiation (IRSR), which provides a much higher brilliance if compared with blackbody sources. However, two main problems arise for : diffraction effects and increase in the IRSR beam size. In the far-infrared range ( cm-1, meV) the radiation wavelength is mm, of the order of the sample size mm. Therefore, we are deeply into the diffraction regime, where a large portion of the incoming radiation is not reflected at specular angle, but rather diffused in a much larger solid angle. The effect of diffraction on the measured signal is difficult to be exactly determined, as it depends on the details of the experimental setup geometry. We have however estimated, through a series of test measurements in our setup, that diffraction effects should decrease the signal intensity by one order of magnitude in the entire far-infrared range. Jong The second problem is that the IRSR beam size approximately increases as (Schwinger law). Since the spot size at the sample position in the visible range is about 500 m in diameter, the spot at 30 cm-1 should be around 5 mm in diameter. Ulli As a consequence of this, only a minor part of the IRSR photons hit the sample.
To eliminate the diffraction effects, we eliminated any uncertainty on the optical alignment due to cryostat strain or to IRSR variations by directly measuring the reflected intensity ratio (which in principle equals the reflectivity ratio) during several experimental runs without heating above K. In this way, the diffraction pattern is washed out by dividing the spectra taken with the same setup geometry. To avoid the contribution from the radiation not hitting the sample, we mounted the crystals on the top of a cone-shaped sample holder. To check the contribution from diffuse radiation, we performed a background intensity test by measuring the intensity reflected by the sample holder without the sample. The background signal is smaller by a factor 20 and does not change for cryostat temperatures K, and therefore could be easily subtracted. In conclusion, we could obtain reliable data for cm-1 by averaging a total of 20000 interferometer scans, with a spectral resolution of 2 cm-1 and an uncertainty of on the reflectivity ratio. We repeated the procedure several times for one pure and one C-doped sample ().
III Normal state


The reflectivity at room temperature of the two single crystal series is shown in Fig. 2 and 3 in the range of the present measurements ( eV). For all crystals, is a typical free carrier response in a metal, with a pseudo plasma-edge (i.e. the frequency where almost reaches zero value) around 2 eV and almost independent on doping. The pseudo plasma-edge roughly corresponds to the screened plasma-frequency , which is determined by the free carrier density in both the and bands by means of the relation:
| (1) |
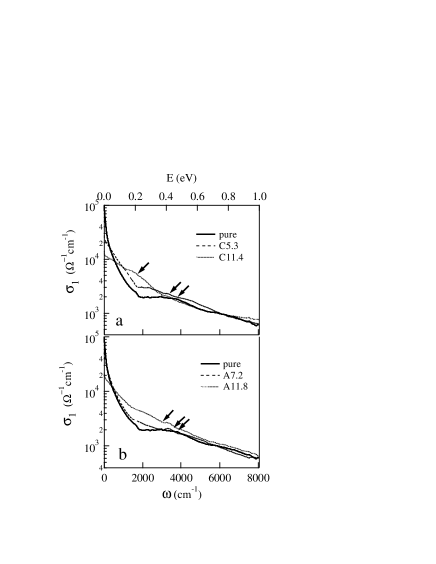
where is the high frequency dielectric constant determined by the electronic interband transitions and are the plasma frequencies respectively for the and bands. We note that the level of the reflectivity in the mid-IR ( eV) decreases with increasing both Al and C doping, indicating the expected increase in the scattering rates (please note that the curves in Fig. 2 and 3 are shifted for clarity). In Fig. 2 and 3 a kink at eV in is evident in the pure sample. This feature, not observed in previous infrared experiments on pure MgB2 single crystals, becomes less prominent and finally disappears as doping proceeds.
Since there are several open questions about the quality of optical data on MgB2 crystals, it is worth to compare in Fig. 3-b our reflectivity spectrum on pure MgB2 with those reported in Refs. Perucchi, and Kuzmenko, . The -dependence of the free carrier contribution is remarkably similar in all three cases. A small discrepancy is seen below eV, where we observe a change of slope, not so clearly seen elsewhere. One may ask whether the present observation can be ascribed to surface contamination effects. Although the reason of this discrepancy is not clear at the moment, however, the reflectivity level in the present work is very close to that of Ref. Kuzmenko, , where the surface contamination is minimal. Another discrepancy between our data and those of Ref. Kuzmenko, is seen above 2 eV and probably due to an artifact of the gold reflectivity correction described in section I.
The analysis of the optical spectra allows for a reliable determination of the plasma frequencies and the scattering rates. Considering that it seems very hard to extract quantitative values for and from the measured screened plasma frequency, since the exact variation of with doping is unknown, we employed a Drude-Lorentz fitting procedure, which was shown to work well in the case of pure MgB2. Kuzmenko The Drude model can be adapted to the case of MgB2 by introducing two separate Drude terms for the two bands, plus a suitable which we take as doping independent and set to the value of 11.9 found by ellipsometric measurements in Ref. Kuzmenko, . A Lorentzian oscillator centered at = 0.47 eV was necessary to reproduce the change of slope seen in the reflectivity. The final fitting formulas are therefore
| (3) |
where are the strength and the width of the Lorentzian oscillator respectively. In Fig. 4 we show the result of the fitting procedure together with the reflectivity data, which are well reproduced by the above formula. The discussion about the evolution with doping of the resulting fitting parameters is detailed in the next section.

The optical conductivity was obtained from through standard Kramers-Kronig transformations. The reflectivity was extrapolated to zero frequency by using the fitting curves in Fig. 4 below 1300 cm-1. To extrapolate at high frequencies we used the data from Ref. Kuzmenko, showed in Fig. 3b. In Fig. 5, where is plotted for representative doping values of C (panel a) and Al (panel b), a typical metallic Drude-like behavior is clearly evident at low frequencies for all samples. The extrapolation of to zero frequency strongly decreases with doping in agreement with dc transport measurements on similar samples. Kazakov05 At mid-IR frequencies, between 2000 and 5000 cm-1, the deviation from a monotonous behavior, more pronounced in the pure sample, indicates the presence of a broad absorption band superimposed to the Drude peak. The black arrows indicate the frequency of the Lorentzian oscillator at 0.47 eV introduced in the fit to the reflectivity data. The overall agreement between obtained from the fit to and the bump in the optical conductivity indicates that the change of slope in corresponds to the mid-IR absorption band. The latter feature clearly shifts and broadens as the doping (Al and C) increases. In the discussion section of this paper we will argue that this peak corresponds to an interband electronic transition between two bands.
III.1 Discussion
The main effects of Al and C substitution are expected to be an increase of the scattering rate and a decrease of the plasma frequencies in the and bands. Looking at the Fig.6 we notice a clear evolution with doping of the scattering rate in the two bands, while the plasma frequency seems to vary only in the -band. Let’s first discuss the evolution of the scattering rates with doping.
In Fig. 6 we show and in the two series of Al and C doped samples as a function of dopant concentration, that is the amount of substituted Mg or B atoms.

In the pure sample meV and meV in good agreement with the values found in Ref. Kuzmenko, . This finding () is expected, since the -band is considered in a clean conduction regime, whereas the -band in a dirty one. Quilty ; Ortolani With increasing Al and C doping the scattering rate increases in all samples of the two series, but with a different trend. In the C doped samples and both sharply increase towards a common value at high doping level. This means that C substitution is much effective in disordering both the bands, but more strongly the -band driving it towards a less clean conduction regime. This is consistent with the strong increase of the upper critical field measured in C-doped single crystals. Kazakov05 ; Masui However, a different scenario could also be considered. In the present fitting procedure, we can distinguish between the two bands only if they have a very different scattering rate. Therefore, we cannot exclude that for high C- doping levels, the conduction takes place in one band only. As for the Al doped samples, the effect of doping on the intraband scattering rates is similar in the two bands: they increase substantially only for , keeping . This result suggests that C substitution is more efficient than Al one in disordering both the bands.
In addition to tune the magnitude of the disorder scattering processes, Al and C substitutions are expected to introduce also additional charges in MgB2 affecting thus the plasma frequency of the system. The measured plasma frequencies , , obtained from the fitting procedure of the reflectivity data, as well as the “total” plasma frequency , are shown in Fig. 7a as a function of electron doping for all the samples studied (full symbols refer to C doping and empty symbols to Al doped crystals).
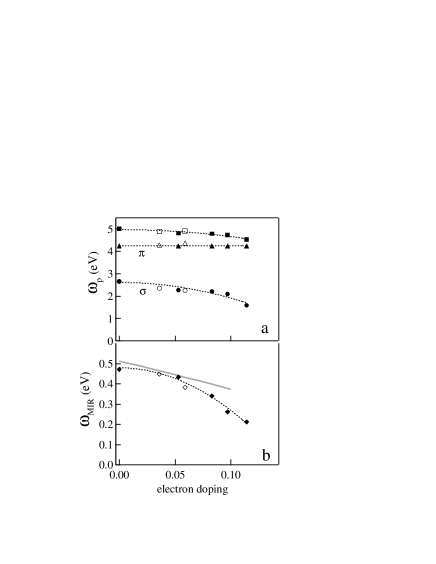
For the undoped compound we find eV, eV, yielding eV, much larger than previously reported in optical experiments, apart from Ref. Kuzmenko, . The discrepancy between the present and the previous measured values of the plasma frequency can be ascribed to different sample purity and air contamination, as also proposed in Ref. Kuzmenko, . In the present study, the samples are single crystals with minimal exposition to air, which explains the much larger value. However, the present values, in particular eV and eV, are still smaller than those reported in Ref. Kuzmenko, ( 6.3 eV) and those predicted by the theory ( 7 eV An ; Kong ; Liu ). The discrepancy between the theoretical and optically measured values of the plasma frequencies has been addressed in Ref. Kuzmenko, . We can note however that the discrepancies between the present values and the ones reported in Ref. Kuzmenko, can be explained by the difference in the fitting procedure, since we added an absorption at 0.47 eV whose spectral weight is comparable with that of the Drude terms. Different hypotheses can be invoked about the origin of this optical structure. We cannot exclude for instance that a minimal exposition to air is responsible for shifting part of the spectral weight from the Drude term to finite frequency absorption corresponding to charges localized by defects in the crystal structure produced by air exposition. In this case, part of the spectral weight of the band at 0.47 eV should be added to the computation of and a value around 6 eV could be easily attained. However, as we will see later, we propose for the band at eV a different physical meaning related to a predicted interband transition, as suggested by the doping dependence of its frequency .
As for the doping dependence of (), we note the band plasma frequency does not change substantially within this electron doping range, whereas the band presents a slight decrease. The reduction of can be easily explained in terms of reduction of the hole charge density in the bands which, in this doping regime, can be safely modelled as almost two-dimensional parabolic bands. A simple calculation gives thus , where is the hole Fermi energy of the bands which is roughly given by the distance between the chemical potential and the top edge of the bands. Theoretical calculations show that the band density of states is essentially doping independent in this range of doping,An ; Kortus so that the decrease of is mainly ruled by . According to this analysis, we can thus estimate a reduction of of a factor from the pure to the highest doped compound, which, using eV for the undoped system,An ; Kortus gives eV for the C11.4 compounds, corresponding to s shift of the chemical potential eV. Note that, since the Fermi energy of the bands is much larger than the band one, eV, the relative change in the band charge density is much smaller and practically negligible, in agreement with Fig. 7a. We have to warn however that some caution should be employed when extracting quantitative information about and from the Drude-Lorentz fit in the high doping region. In this regime indeed the and band scattering rates , become very similar, making hard to separate in the fit procedure the two distinct and band contributions, whereas of course the total value of the plasma frequency is not affected by this kind of problem.
Although a quantitative analysis of the , would requires some care in the high doping range, a clearer evidence of the filling of the bands as a function of the electron doping may be given by the doping dependence of the resonance frequency of the Lorentzian oscillator present in Eq. 3. We have already mentioned above that a possible explanation for this structure could be related to the interband electronic transitions. An absorption band around 0.4-0.7 eV has been indeed theoretically predicted in the pure sample, although not observed so far.Kuzmenko ; belashenko However, there could be other different hypothesis to consider. One already mentioned possibility is the presence of an absorption corresponding to charges localized by defects in the crystal structure produced by air exposition. But the high values of both reflectivity data and plasma frequency seem to contradict this hypothesis. Another possible interpretation of the MIR band could be given in terms of the frequency-dependent electron-phonon scattering rate . Indeed, if the conductivity is calculated from the Eliashberg electron-phonon spectral function, Kuzmenko then a deviation from the simple Drude model in Eq. 3 is found in the MIR range, which can be interpreted as an increase of . However, due to the addition of dopant atoms, the scattering should be dominated by impurity scattering at all (apart from that in the -band of the pure sample) and hence the conductivity could be as well described by a frequency-independent in Eq. 3 plus a MIR band, as for example in the case of cuprates. Padilla The presence of the MIR band with a similar intensity in all samples suggests therefore that it might not be fully explained in terms of electron-phonon scattering. A last hypothesis could ascribe this MIR absorption band to a possible presence of MgO impurity on the sample surface. The clear doping dependence of the absorption frequency shown in Fig. 7b makes us confident in excluding also this last possibility. Indeed, the softening of the with doping, as shown in Fig. 7b, is expected since the distance between the two hole-like quasi-parabolic bands decreases as electron charges are added to the compound.
To have a more quantitative insight, we compare these data with the simple model for the bands introduced in Ref. An, , namely
| (4) |
where is the index of the two bands. Following Ref. An, we take eV, eV, , . Within this model the band IB absorption results to have a energy window eV eV, and a Lorentzian fitting gives eV, in very good agreement with our data. We can also investigate the doping dependence assuming a rigid band filling. It is easy to show that . The results are shown in Fig. 7b, also in an overall agreement with our data. The slight bend of our data with respect to the almost linear behavior of the theoretical analysis can be probably ascribed to non-rigid band effects, which are also known to be important in the doping range.Kortus05 Note that the reduction of the measured values of , from the pure to the highest doped compound, is , also in a qualitative agreement with the reduction of obtained by . We conclude therefore that the assignment of the eV absorption with the IB transition is in good agreement with theoretical predictions, thus giving an experimental indication of an upwards shift of the chemical potential with the substitution of Al and C and of the corresponding electron doping of the bands. As discussed before, since the bands are almost two-dimensional and the corresponding DOS almost flat in this doping regime, the band filling is however unlike to be the only source of the suppression, and we think that an important role is played by the disorder as well.
IV Superconducting state
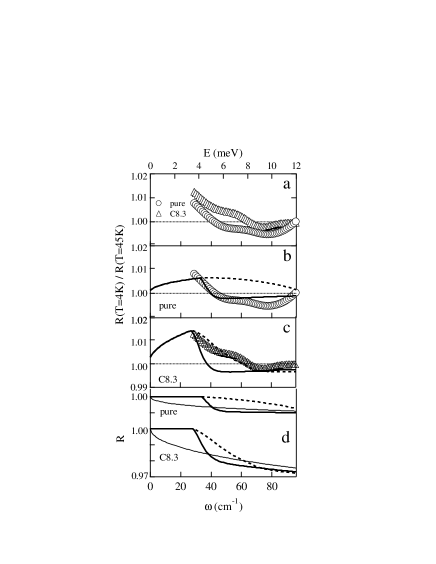
The reflectivity ratio () is reported for the pure and the C-doped sample in Fig. 8-a. The pure sample shows a decrease below 1 for cm-1 and a sharper increase above 1 for cm-1. The C-doped sample only shows an increase above 1 in for cm-1. Above 80 cm-1, there seems to be no effect of the superconducting transition on the within uncertainties. Although the data quality does not allow an uncostrained best-fitting procedure, the fact that both the present datasets are each taken on one oriented single crystal poses strong constraints. We are therefore in the condition to compare the present data from MgB2 samples with the prediction of different BCS-based models for the infrared response of a two-gap superconductor. The BCS calculation employed here for the complex conductivity of one band in the superconducting state is that proposed by Zimmermann et al.. Zimmermann Therein, the normal state conductivity is a Drude term defined by the plasma frequency and the scattering rate , while the superconducting state conductivity is computed trough the input of and the gap value .
However, in the present experiment the quantity which is probed is the reflectivity , rather than . In a s-wave BCS superconductor, for , the in the superconducting state is close to 100%, because of total radiation screening from the supercurrent flowing in a surface sheet, whose thickness is determined by the field penetration depth . The normal state reflectivity is then recovered even at for , since the radiation with energy larger than that of the Cooper pairs cannot be screened. If one now turns to the two-gap case, which is relevant for our work, one may ask whether the radiation would be screened or not for , since the photon energy is now larger than the -band Cooper pair energy, but smaller than the -band Cooper pair energy. Normal electrons, which are unpaired due to radiation-induced Cooper-pair breaking in the -band, will coexist with the surface supercurrent generated by the pairs in the -band. The question whether the radiation with would be screened or not has not yet been addressed theoretically to our knowledge. We considered these two possibilities by using two different sets of parameters to calculate the conductivity in the two bands (case 1 and case 2 described below). We then summed up the contribution from the two bands and we determined the reflectivity and the from the complex conductivity with the standard Fresnel formulae.
In case 1 we assumed that the conductivity in the superconducting state is the parallel of two superconductors, each one with a different and . This assumption, which holds for the normal state, was already used to analyze the far-infrared data in the superconducting state of MgB2 pellets and films. Lobo ; Ortolani The superconducting state conductivity is then given by summing up the contributions from the two bands, each weighted by . The fact that must be explicitly taken into account in the finite temperature calculation. The use of the parallel sum in the superconducting state corresponds to the assumption that there is no interaction between the two superconducting fluids when they are exposed to an incoming electromagnetic wave. In case 2 we assume that the unpaired -electrons inhibit the radiation screening for frequencies , thus allowing for the propagation of the radiation in the sample in a surface layer larger than the theoretical value of . In this case, the reflectivity measurements are only sensitive to the smaller gap . We have therefore input in our calculations one single effective optical gap for both bands in case 2. We note that the above discussion does not imply that there is a single value for the gap or for the penetration depth in the two-band superconductor, but rather one single critical energy of the order of for the ac-field penetration depth.
We have generated two curves for each of the two samples, reported in Fig. 8-b and -c, by using different gap parameters for case 1 and case 2. The input parameters, reported in Table 2, are entirely determined a priori, since the data quality does not allow a reliable fitting procedure. and were taken from the room temperature optical data reported in the present work on the same samples, and assumed to be temperature independent. The scattering rates are mainly determined by impurity scattering at low temperature. Therefore, we used the room temperature values for all the cases where impurity scattering dominates the electron scattering also at room temperature, i.e. for the pure sample and for the C-doped sample. According to several authors, Kuzmenko ; Kazakov05 ; Masui in the pure sample the electron scattering in the -band is dominated by phonons at room temperature, so we cannot use the value for from the present work. However, in Ref. Kuzmenko, an impurity scattering rate value of 12.4 meV was derived and found to be in agreement with dc transport measurements; we have therefore used this value for the low-temperature of the pure sample. Concerning the gap values and , we have used the values from photoemission measurements of Ref. TsudaPES, for samples with similar doping level. was 0.1 for the pure sample and 0.13 for the C-doped sample.
| sample | (K) | ||||||
|---|---|---|---|---|---|---|---|
| 38.5 | 6.4a | 2.1a | 12.4b | 100 | 2600 | 4200 | |
| 31.9 | 4.2a | 1.7a | 180 | 180 | 2300 | 4200 |
The result of the analysis of Fig. 8 is the following: case 1, i.e. the parallel conductivity (dashed line), can account for the data from the C-doped sample but not for those on the pure sample. On the other hand, case 2, i.e. the single effective gap case (thick line) may explain the data from the pure sample. This is not surprising, since all the infrared reports of the superconducting gap value in undoped MgB2 are in agreement with the value for from other techniques. Tu ; Lobo ; Perucchi This low value of the optical gap was often explained with the fact that the -band is a superconductor in the clean limit () while the -band is in the dirty-limit (). In a clean-limit superconductor, the superconducting transition would not leave imprints in the electrodynamic response at the gap energy, YouDoNotSee and therefore infrared radiation would only probe the smaller -gap. On the other hand, the data on the C-doped sample, with both bands in the dirty limit, can be successfully reproduced by a parallel sum of two dirty superconductors. As a consequence, we can confirm that the gap in the clean-limit -band is not observed in the infrared experiments. On the other hand, even a fit curve which includes the clean-limit condition can not reproduce the data for the pure sample. In the absence of more refined theoretical models for the electrodynamic response of a two-gap superconductor, we speculate that the lack of -gap signature in the reflectivity in the pure sample could be due to unpaired -electrons inhibiting the radiation screening for frequencies . This is not the case when the -band is also in the dirty limit, like in the C-doped sample, as shown by the higher cutoff frequency in the . We believe that the larger , and hence the larger thickness of the screening supercurrent sheet, may play a role in determining the higher cutoff frequency in the C-doped sample. Note that, in spite of the higher cutoff frequency in the , the absorptivity of the dirty C-doped sample is larger than that of the pure sample, as expected (see Fig. 8-d).

The clean-limit nature of the -band in the pure sample can be made clear by looking, in Fig. 9, at the model optical conductivity which was used to generate the curves in Fig. 8. The normal-state conductivity in Fig. 9 is the sum of two purely Drude terms, and therefore cannot be taken as a description of the real frequency dependence of the optical conductivity of MgB2 single cystals. However, since the model curves in Fig. 9 are obtained from a-priori values of the input parameters and generate curves in good agreement with the experimental data, they can be interestingly used to estimate for both samples the spectral weight loss below . This quantity is given by
| (5) |
where are the real part of the normal and superconducting state conductivity respectively. The quantity , i.e. the value of the integral in Eq. 5 for , is proportional to the superfluid density, as the total spectral weight lost through the transition is transferred to the zero-frequency delta-function representing the contribution of the superconducting carriers to the optical conductivity (Ferrel-Glover-Thinkham sumrule).
However, in our BCS approach, where the energy scale of the superconducting phenomenon is set by the larger energy gap , 90% of can be recovered by extending the integral only up to few units of , as shown by the dashed lines in Fig. 9-c. In the model for the pure sample (Fig. 9-a) we find that 90% of is obtained by integrating up to 12 meV only. This correpsonds to the clean-limit case, since most of the normal-state spectral weight is located in the frequency region because of the small scattering rate , which determines the width of the Drude peak. On the other hand, the model for the C-doped sample shows a broad Drude term and therefore a recovery of 90% of by integration up to 25 meV (being meV in the C-doped sample) which is usually considered the upper limit of the integration in Eq. 5 for dirty-limit BCS superconductors. Homes
can be more readily expressed in terms of a superconducting plasma frequency . can be compared to the total plasma frequency derived from the fit in Section 2 of the present work to give an estimate of the proximity of MgB2 to the ideal clean-limit condition, defined by the London model prediction at . We obtained 1.8 and 0.9 eV for the pure and C-doped sample respectively (see Fig. 9-c), to be compared with = 5.0 and 4.7 eV respectively. We can conclude trough the analysis of the model conductivity curves that the far-infrared data in Fig. 8 confirm the clean-limit scenario for the pure sample and the the dirty-limit scenario for the C-doped sample with .
V Conclusions
A systematic investigation of the in-plane optical properties of Mg1-xAlx(B1-yCy)2 single crystals has been curried out as a function of Carbon (x) and Aluminum (y) concentration by means of infrared microspectroscopy for cm-1. For pure and doped crystals the reflectivity is metallic, with a pseudo plasma-edge at around 2 eV slightly decreasing on doping. Using a Drude-Lorentz fit (see Eq. 3) to the experimental , an increase of the scattering rates in the () and () bands is found with increasing Al and C content. Whereas the -band plasma frequency results not to be affected by electron doping, the -band one shows a substantial decrease. An absorption band at eV was found in the pure sample, which becomes less evident and finally disappears as doping increases. We performed band structure calculations which ascribe it to a interband electronic transition. The calculated and observed redshift of this transition with C- and Al- doping allows us to provide an estimate of the corresponding Fermi level shift, which is in qualitative agreement with the decrease of the -band plasma frequency. Since the bands are almost two-dimensional and the corresponding DOS almost flat in the doping region studied here, An ; Kortus the band filling is unlike to be the only source of the suppression, and we think that an important role is played by the disorder as well.
The effect of doping in MgB2 has been also probed in the superconducting state by using infrared synchrotron radiation for cm-1 in one pure and one C-doped single crystal. The far-infrared response below in the two samples is substantially different, due to the different -band conduction regime. Indeed, in the undoped sample, with clean -band, a signature of the -gap only is observed. In the C-doped one, a contribution from the -gap to the reflectivity ratio appears, indicating a transition towards dirty superconductivity with C-doping in MgB2.
VI Acknowledgement
We are grateful to P. Dore, P. Calvani, P. Postorino, and H. Keller for illuminating and fruitful discussions. We also acknowledge L. Baldassarre for help during measurements at the synchrotron BESSY in Berlin and M. Cestelli Guidi, M. Piccinini and A. Nucara for help in preliminary measurements of the low temperature optical response of single crystal.
References
- (1) J. Nagamatsu, N. Nakagawa, T. Muranaka, Y. Zenitani, and J. Akimitsu, Nature (London) 410, 63 (2001).
- (2) A.Y. Liu, I.I. Mazin, and J. Kortus, Phys. Rev. Lett. 87, 087005 (2001).
- (3) J. Kortus, I. I. Mazin, K. D. Belashchenko, V. P. Antropov, and L. L. Boyer, Phys. Rev. Lett. 86, 4656 (2001).
- (4) H. Uchiyama, K. M. Shen, S. Lee, A. Damascelli, D. H. Lu, D. L. Feng, Z.-X. Shen, and S. Tajima, Phys. Rev. Lett. 88, 157002 (2002).
- (5) E. A. Yelland, J. R. Cooper, A. Carrington, N. E. Hussey, P. J. Meeson, S. Lee, A. Yamamoto, and S. Tajima, Phys. Rev. Lett. 88, 217002 (2002).
- (6) Yu. Eltsev, K. Nakao, S. Lee, T. Masui, N. Chikumoto, S. Tajima, N. Koshizuka, and M. Murakami, Phys. Rev. B 66, 180504(R) (2002).
- (7) J. M. An and W. E. Pickett, Phys. Rev. Lett. 86, 4366 (2001).
- (8) Hyoung Joon Choi, David Roundy, Hong Sun, Marvin L. Cohen, and Steven G. Louie, Phys. Rev. B 66, 020513(R) (2002); Nature (London) 418, 758 (2002).
- (9) A. A. Golubov, J. Kortus, O. V. Dolgov, O. Jepsen, Y. Kong, O. K. Andersen, B. J. Gibson, K. Ahn, and R. K. Kremer, J. Phys.: Condens. Matter 14, 1353 (2002).
- (10) Y. Kong, O.V. Dolgov, O. Jepsen, and O.K. Andersen, Phys. Rev. B 64, 020501(R) (2001).
- (11) P. Szabó, P. Samuely, J. Kačmarč k, T. Klein, J. Marcus, D. Fruchart, S. Miraglia, C. Marcenat, and A. G. M. Jansen, Phys. Rev. Lett. 87, 137005 (2001).
- (12) M. Iavarone, G. Karapetrov, A. E. Koshelev, W. K. Kwok, G. W. Crabtree, D. G. Hinks , W. N. Kang, Eun-Mi Choi, Hyun Jung Kim, Hyeong-Jin Kim, and S. I. Lee, Phys. Rev. Lett. 89, 187002 (2002).
- (13) M. R. Eskildsen, M. Kugler, S. Tanaka, J. Jun, S.M. Kazakov, J. Karpinski, and Ø. Fischer, Phys. Rev. Lett. 89, 187003 (2002).
- (14) Y. Wang, T. Plackowski, and A. Junod, Physica C 355, 179 (2001).
- (15) F. Bouquet, R. A. Fisher, N. E. Phillips, D. G. Hinks, and J. D. Jorgensen, Phys. Rev. Lett. 87, 047001 (2001); F. Bouquet, Y. Wang, I. Sheikin, T. Plackowski, and A. Junod, S. Lee, and S. Tajima, Phys. Rev. Lett. 89, 257001 (2002).
- (16) S. Tsuda, T. Yokoya, T. Kiss, Y. Takano, K. Togano, H. Kito, H. Ihara, and S. Shin, Phys. Rev. Lett. 87, 177006 (2001); S. Tsuda, T. Yokoya, Y. Takano, H. Kito, A. Matsushita, F. Yin, H. Harima, and S. Shin, Phys. Rev. Lett. 91, 127001 (2003).
- (17) J. W. Quilty, S. Lee, S. Tajima, and A. Yamanaka, Phys. Rev. Lett. 90, 207006 (2003).
- (18) S. Souma, Y. Machida, T. Sato, T. Takahashi, H. Matsui, S.-C. Wang, H. Ding, A. Kaminski, J. C. Campuzano, S. Sasaki, and K. Kadowaki, Nature (London) 423, 65 (2003).
- (19) J. Kortus, O. V. Dolgov, K. Kremer, A. A. Golubov Phys. Rev. Lett. 94, 027002 (2005)
- (20) A. Bianconi, S. Agrestini, D. Di Castro, G. Campi, G. Zangari, N. L. Saini, A. Saccone, S. De Negri, M. Giovannini, G. Profeta, A. Continenza, G. Satta, S. Massidda, A. Cassetta A. Pifferi, M. Colapietro, Phys. Rev. B 65, (2002) 174515.
- (21) S. M. Kazakov, R. Puzniak, K. Rogacki, A. V. Mironov, N. D. Zhigadlo, J. Jun, C. Soltmann, B. Batlogg, and J. Karpinski, Phys. Rev. B 71, 024533 (2005).
- (22) T. Masui, S. Lee, and S. Tajima, Phys. Rev. B 70, 024504 (2004).
- (23) R.A. Ribeiro, S.L. Bud’ko, C. Petrovic, and P.C. Canfield, Physica C 384 227 (2003).
- (24) J. Karpinski, N. D. Zhigadlo, G. Schuck, S. M. Kazakov, B. Batlogg, K. Rogacki, R. Puzniak, J. Jun, E. M uller, P. W agli, R. Gonnelli, D. Daghero, G. A. Ummarino, and V. A. Stepanov, Phys. Rev. B 71, 174506 (2005).
- (25) E. Ohmichi, T. Masui, S. Lee, S. Tajima, T. Osada, J. Phys. Soc. Jpn. 73, 2065 (2004).
- (26) M. Ortolani, D. Di Castro, P. Postorino, I. Pallecchi, M. Monni, M. Putti, and P. Dore, Phys. REv. B 71, 172508 (2005).
- (27) R. S. Gonnelli, D. Daghero, A. Calzolari, G. A. Ummarino, Valeria Dellarocca, V. A. Stepanov, S. M. Kazakov, N. Zhigadlo, and J. Karpinski, Phys. Rev. B 71, 060503(R) (2005).
- (28) A.A. Golubov, and I. I. Mazin, Phys. Rev. B 55, 15146 (1997).
- (29) A.B.Kuz’menko, F.P.Mena, H.J.A.Molegraaf, D.van der Marel, B.Gorshunov, M.Dressel, I.I.Mazin, J.Kortus, O.V.Dolgov, T.Muranaka, J.Akimitsu, Solid State Comm. 121, 479 (2002).
- (30) B. Gorshunov, C. A. Kuntscher, P. Haas, M. Dressel, F. P. Mena, A. B. Kuz menko, D. van der Marel, T. Muranaka, and J. Akimitsu, Eur. Phys. J. B 21, 159 (2001).
- (31) Y. Fudamoto and S. Lee, Phys. Rev. B 68, 184514 (2003).
- (32) R.P.S.M. Lobo, M. Elsen, P. Monod, J.J. Tu, Eun-Mi Choi, Hyeong-Jin Kim, W. N. Kang, Sung-Ik Lee, R.J. Cava, G.L. Carr, cond-mat/0404382.
- (33) J. J. Tu, G. L. Carr, V. Perebeinos, C. C. Homes, M. Strongin, P. B. Allen, W. N. Kang, Eun-Mi Choi, Hyeong-Jin Kim, and Sung-Ik Lee, Phys. Rev. Lett 87, 277001 (2001).
- (34) A. Perucchi, L. Degiorgi, J. Jun, M. Angst, and J. Karpinski, Phys. Rev. Lett. 89, 097001 (2002).
- (35) V. Guritanu, A.B. Kuzmenko, D. van der Marel, S.M. Kazakov, N.D. Zhigadlo, and J. Karpinski, cond-mat/0509345.
- (36) V. P. Antropov, K. D. Belashchenko, M. van Schilfgaarde and S. N. Rashkeev, cond-mat/0107123 (2001).
- (37) P. Ravindran, P. Vajeeston, R. Vidya, A. Kjekshus, and H. Fjellvaġ, Phys. Rev. B 64, 224509 (2001).
- (38) J. Karpinski, S. M. Kazakov, J. Jun, M. Angst, R. Puzniak, A. Wisniewski, and P. Bordet, Physica C 385, 42 (2003).
- (39) Y. S. Lee, K. Segawa, Z. Q. Li, W. J. Padilla, M. Dumm, S. V. Dordevic, C. C. Homes, Y. Ando and D. N. Basov, cond-mat/0509167
- (40) J. S. Lee, M. Ortolani and U. Schade, private communication.
- (41) A spot size of 10 mm at the sample position has been indeed measured at cm-1. U. Schade, private communication.
- (42) W. Zimmermann, E. H. Brandt, M. Bauer, E. Seider, and L. Genzel, Physica C 183, 99 (1991).
- (43) S. Tsuda, T. Yokoya, T. Kiss, T. Shimojima, S. Shin, T. Togashi, S. Watanabe, C. Zhang, C. T. Chen, S. Lee, H. Uchiyama, S. Tajima, N. Nakai, and K. Machida, Phys. Rev. B 72, 064527 (2005).
- (44) K. Kamaras, S. L. Herr, C. D. Porter, N. Tache, B. Tanner, S. Etemad, T. Venkatesan, E. Chase, A. Inam, X. D. Wu, M. S. Hegde, and B. Dutta, Phys. Rev. Lett. 64, 84 (1990).
- (45) C. C. Homes, S. V. Dordevic, D. A. Bonn, Ruixing Liang, and W. N. Hardy, Phys. Rev. B 69, 024514 (2004)