Low Ghz loss in sputtered epitaxial Fe
Abstract
We show that sputtered, pure epitaxial iron films can have high-frequency loss as low as, or lower than, any known metallic ferromagnetic heterostructure. Minimum 34 Ghz ferromagnetic resonance (FMR) linewidths of 41 2 Oe are demonstrated, some 5-10 % lower than the previous minimum reported for molecular beam epitaxially (MBE) deposited Fe. Intrinsic and extrinsic damping have been separated over 0-40 Ghz, giving a lower bound for intrinsic LL(G) relaxation rates of or ( = 0.0027 0.0001) and extrinsic . Swept frequency measurements indicate the potential for integrated frequency domain devices with at 30-40 Ghz.
I Introduction
Low damping , or relaxation rates , are essential for high frequency applications of magnetic heterostructures. Nanoscale spin electronic sensors operating above 1 Ghz have signal-to-noise ratios (SNR) which depend inversely on the damping constant and are independent of spin transport parameters.Smith and Arnett (2001) Integrated magnetic frequency domain devices have frequency linewidths (/2) limited fundamentally by the Landau-Lifshitz-(Gilbert) relaxation rate ,Patton (1968) where is the gyromagnetic ratio. It is timely to determine how low relaxation rates can be made in a ferromagnetic thin film, particularly using widely accessible deposition techniques such as sputtering.
Relaxation processes expressed phenomenologically in Silva et al. (1999) can be divided into extrinsic and intrinsic types. Extrinsic damping results from microstructure; intrinsic damping results from spin-orbit coupling.Kamberský (1970) The two effects can be separated through variable-frequency ferromagnetic resonance measurements (FMR), through .Heinrich (2005) in this context expresses intrinsic processes, and expresses inhomogeneous broadening due to e.g. line defects.Woltersdorf and Heinrich (2004)
The lowest overall linewidths have been seen in the ultrathin molecular beam epitaxially (MBE) deposited Fe films of Prinz, with a 35 Ghz (1.29 Oe/Ghz) seen in ultrathin Fe(100) deposited on ZnSe(100) epilayers.Prinz et al. (1986) Intrinsic and extrinsic losses were not separated in the prior work, carried out at a single frequency. Fe also possesses the lowest known intrinsic damping constant of any metallic ferromagnet, with a range of quoted as ( in FMR measurement to 40 Ghz.Stearns (1990) Variable frequency FMR estimates of over this range, through , have typically uncovered values of 140 Mhz in high-quality MBEWoltersdorf and Heinrich (2004); Platow et al. (1998) or sputtered films.Lubitz et al. (2003)
In this work, we report UHV sputtered epitaxial pure Fe(100)(15nm)/Ti(2nm) films on MgO(100) which show FMR linewidths of = 41 2 Oe at 34 Ghz (1.20 Oe/Ghz), some 5-10% lower than the narrowest linewidths seen to date in MBE deposited films. Variable frequency 0-40 Ghz FMR indentifies = 85 5 Mhz () and for these thin films; a role of eddy current damping is identified in of thicker Fe films. Swept-frequency measurements demonstrate the potential for field-tunable 35 Ghz filters with , an order of magnitude better than achieved previously in Fe.
II Experimental
Fe (8-75 nm) thin films were deposited on polished MgO(001) substrates using dc magnetron UHV sputtering at a base pressure of 3.010-9 Torr. Pressures immediately prior to deposition after sample introduction were typically 1.010-8 Torr. Substrates were held at 200 ∘C during sputter deposition, at 410-3 Torr in-situ getter-purified Ar, 300 W power for 2 inch targets, and 10 cm target-substrate spacing. Growth rates of 6 Å/s were measured by a quartz crystal microbalance and ex-situ profilometry. Films were capped with 2 nm sputtered Ti to protect the surface from oxidation. Rocking curve half widths measured for 50 nm films were very low, only 0.5 ∘, and roughly independent of deposition temperature over the range 200-300 ∘C. Results for ion beam sputtered Ni81Fe19(48 nm) are plotted for comparison; see Ref. Reidy et al. (2003) for deposition conditions.
Broadband FMR measurements were carried out using microwave frequencies in the range 4-40 Ghz generated by a synthesized sweep generator operating in cw mode. Microwaves were applied to the samples through a coplanar waveguide (CPW) for the range 4-18 GhzSilva et al. (1999) and a shorted K-band rectangular waveguide for higher frequencies, with diode detector in transmission and reflection, respectively. Derivative spectra were recorded using ac field modulation (2 G) and lock-in detection.Heinrich and Cochran (1993) Swept-field and swept-frequency measurements were both carried out, at room temperature.
III Results
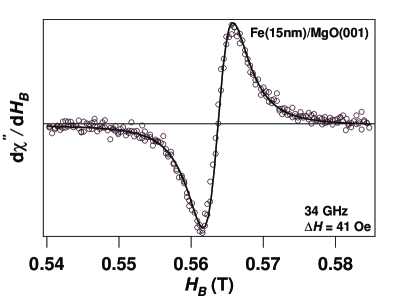
A representative FMR spectrum for thin (8 or 15 nm) Fe films at 34 Ghz is shown in Fig. 1. The film is measured with applied along the 110 hard axis, along MgO100. The derivative spectrum is shown to be symmetric, with Lorenzian fit indicated, and peak-to-peak linewidth measured of .
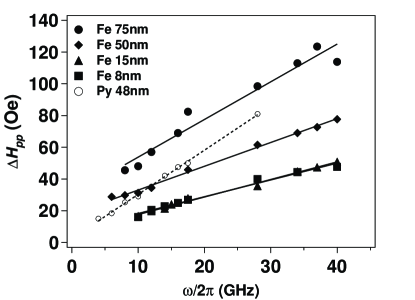
Peak-to-peak FMR linewidths versus frequency were plotted for all samples (Fig. 2) to determine the Landau-Lifshitz-Gilbert (LLG) damping constant and the inhomogeneous broadening . From the slope , we find a minimum for thin Fe (15 nm). is measured for Ni81Fe19(48nm), consistent with the lower bound of typical values and characteristic of high quality films. Relaxation rates are converted from measurements using Stearns (1990) and , 4, and plotted for comparison. reaches a minimum of 85 5 Mhz for epitaxial Fe and 120 10 Mhz for Ni81Fe19. Inhomogeneous broadening is negligible for Ni81Fe19, with , and reaches a minimum of for 15 nm Fe.
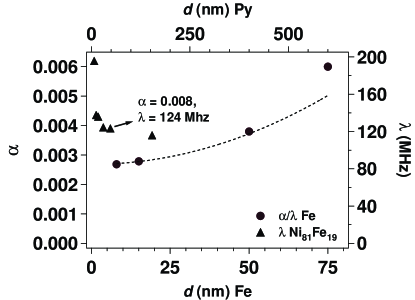
An increasing trend in with thickness can be seen for Fe films thicker than 15 nm. We have compared the increase in with a standard theory of eddy current damping,Lock (1966) which predicts a quadratic increase in Gilbert-type (proportional to ) linewidth with film thickness :
| (1) |
where is the conductivity ( for cgs units) and the speed of light in vacuum. values used for Fe and Ni81Fe19 were respectively 9.111016 hz ( = 10 .cm from four-point-probe measurement) and 4.51016 hz ( = 20 .cm). Order of magnitude agreement is found with the increase in for Fe films to 75 nm; the Ni81Fe19 data are plotted with thickness scale compressed by the ratio of the prefactors for the two materials (), indicating an expected delayed onset of eddy-current damping ( 200 nm) for Ni81Fe19. A thickness-dependent increase of the inhomogeneous term from 6 to 30 Oe with increasing Fe thickness may originate in a higher concentration of strain-relaxing dislocations for thicker films.Woltersdorf and Heinrich (2004)
The advantage of swept- FMR measurement for extracting total relaxation rates has been pointed out by Patton.Patton (1968) can be measured independent of geometry as
| (2) |
Patton (1968)where , giving the decay time as in a time-domain experiment,Silva et al. (1999) and where in the absence of extrinsic relaxation. can be estimated in the intrinsic limit as . We approximate extrinsic and intrinsic relaxation rates as with measured in the absence of .
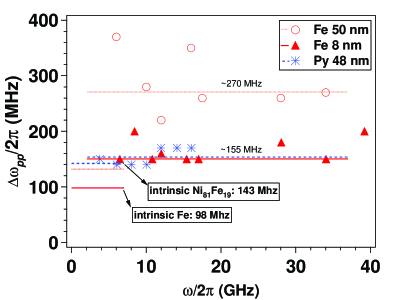
Figure 4 shows a plot of the peak-to-peak swept- FMR linewidths versus frequency for Fe (8 and 50 nm) and Ni81Fe19 (48 nm) films. It can be seen that the Ni81Fe19 films follow the intrinsic limit quite well, with = 129(2/3) = 149 Mhz (theoretical) approximated to 16 Ghz. However, the inhomogeneous term is appreciable in 8 nm Fe; translates to = 191 60 Mhz and /2 = (191 Mhz/22/3) = 35 10 Mhz, comparable to the observed 50 5 Mhz.
IV Discussion
The observed low extrinsic relaxation rates are a plausible result of the excellent crystalline quality in the ultrathin epitaxial sputtered Fe films. Inhomogeneous broadening is more typically measured on the order of ,Schreiber et al. (1995) compared with the best of seen here. X-ray diffraction rocking curves of the (200) peak on our films show full-width-half-maxima (FWHM) as low as 0.6∘; more standard values for seeded epitaxy in sputtering for this system are 1.1∘.Harp and Parkin (1996) Moreover, easy-axis (100) coercivities , measured by VSM, are 2.1 Oe compared with 3.7 Oe in Ref. Prinz et al. (1986) in thinner films (50 nm vs. 320 nm for MBE). The inhomogeneous linewidth is the lowest we are aware of in Fe films.
Finally we comment on applications. Favorable epitaxial structures in sputtered Fe/MgO/Fe junctions have resulted in very high tunneling magnetoresistance;Yuasa et al. (2004) our results indicate that low and high may coexist. Additionally, the low 35 Ghz frequency linewidths seen in our epitaxial Fe films could translate directly to high half-power in a frequency domain device. One example is a tunable bandstop filter based on FMR. We see in our films, roughly an order of magnitude higher than that realized to date in Fe device structures.Kuanr et al. (2003)
V Acknowledgements
We thank Z. Frait for helpful discussions. This work was supported by the Army Research Office under contracts DA-ARO-W911NF0410168, DAAD19-02-1-0375, and 43986-MS-YIP, and has used the shared experimental facilities that are supported primarily by the MRSEC program of the National Science Foundation under NSF-DMR-0213574.
References
- Smith and Arnett (2001) N. Smith and P. Arnett, Appl. Phys. Lett. 78, 1448 (2001).
- Patton (1968) C. Patton, J. Appl. Phys. 39, 3060 (1968).
- Silva et al. (1999) T. Silva, C. Lee, T. Crawford, and C. Rogers, J. Appl. Phys. 85, 7849 (1999).
- Kamberský (1970) V. Kamberský, Can. J. Phys. 48, 2906 (1970).
- Heinrich (2005) B. Heinrich, Ultrathin magnetic structures: fundamentals of nanomagnetism, edited by B. Heinrich and J. A. C. Bland (Springer, 2005), Vol. III, Chap. 5, pp. 143–210.
- Woltersdorf and Heinrich (2004) G. Woltersdorf and B. Heinrich, Phys. Rev. B 69, 184417 (2004).
- Prinz et al. (1986) G. Prinz, B. Jonker, J. Krebs, J. Ferrari, and F. Kovanic, Appl. Phys. Lett. 48, 1756 (1986).
- Stearns (1990) M. Stearns, Landolt-Borstein Tables (Springer-Verlag, Dusseldorf, 1990), Chap. III-13: 1.1.2.10, pp. 86–91.
- Platow et al. (1998) W. Platow, A. Ansimov, G. Dunifer, M. Farle, and K. Baberschke, Phys. Rev. B 58, 5611 (1998).
- Lubitz et al. (2003) P. Lubitz, S. F. Cheng, and F. Rachford, J. Appl. Phys. 93 (2003).
- Reidy et al. (2003) S. Reidy, L. Cheng, and W. Bailey, Appl. Phys. Lett. 82, 1254 (2003).
- Heinrich and Cochran (1993) B. Heinrich and J. Cochran, Adv. Phys. 42, 523 (1993).
- Lock (1966) J. Lock, Br. J. Appl. Phys. 17, 1645 (1966).
- Schreiber et al. (1995) F. Schreiber, J. Pflaum, Z. Frait, T. Mughe, and J. Pelzl, Solid State Commun. 93, 965 (1995).
- Harp and Parkin (1996) G. Harp and S. Parkin, Thin Solid Films 288, 315 (1996).
- Yuasa et al. (2004) S. Yuasa, T. Nagahama, A. Fukushima, Y. Suzuki, and K. Ando, Nature Materials 3, 868 (2004).
- Kuanr et al. (2003) B. Kuanr, Z. Celinski, and R. Camley, Appl. Phys. Lett. 83, 3969 (2003).