Spin waves in the Frustrated Kagomé Lattice Antiferromagnet KFe3(OH)6(SO4)2
Abstract
The spin wave excitations of the ideal Kagomé lattice antiferromagnet KFe3(OH)6(SO4)2 have been measured using high-resolution inelastic neutron scattering. We directly observe a flat mode which corresponds to a lifted “zero energy mode,” verifying a fundamental prediction for the Kagomé lattice. A simple Heisenberg spin Hamiltonian provides an excellent fit to our spin wave data. The antisymmetric Dzyaloshinskii-Moriya interaction is the primary source of anisotropy and explains the low temperature magnetization and spin structure.
pacs:
75.25.+z,75.30.Ds,75.50.EeGeometrically frustrated spin systems have received considerable attention in recent years due to the presence of remarkable properties such as spin iceRamirez et al. (1999); Snyder et al. (2001), spin nematicChalker et al. (1992), and spin liquid behaviors Waldtmann et al. (1998); Sachdev (1992); Zeng and Elser (1995). The Kagomé lattice antiferromagnet is a highly frustrated two-dimensional lattice, being comprised of corner-sharing triangles. For classical Heisenberg spins, the ground state of a Kagomé antiferromagnet is infinitely degenerate, but the spins are believed to order in the limit by a process known as “order by disorder” Huse and Rutenberg (1992); Reimers and Berlinsky (1993). On the other hand, there are predictions that the ground state of the Kagomé lattice is disordered, being a realization of the long sought after quantum spin-liquidWaldtmann et al. (1998); Sachdev (1992); Zeng and Elser (1995); Sindzingre et al. (2000). Experimentally, several materials have been studied that are believed to be realizations of the Kagomé lattice antiferromagnet, such as SCGOBroholm et al. (1990), volborthiteHiroi et al. (2001), and jarositesWills (2001); Inami et al. (2000); Lee et al. (1997). However, these materials are often plagued by non-stoichiometry issues or have structural differences from the ideal Kagomé network. In this paper, we present a high-resolution neutron scattering study on a single crystal sample of a pure system with an ideal Kagomé networkGrohol et al. (2003), the iron jarosite KFe3(OH)6(SO4)2. This allows us to directly compare our data with fundamental theoretical predictions.
One of the hallmarks of highly frustrated systems is the presence of “zero energy modes” which result from the huge ground-state degeneracy. For the Kagomé lattice Heisenberg model, the only constraint for the ground state is that the spins on each triangle be oriented relative to each other. A “zero energy mode” for the Kagomé lattice is depicted in Fig. 1(a). The small loops at the tips of the spins illustrate rotations of two of the spin sublattices about the axis defined by the third spin sublattice. These spins, forming a chain, can collectively rotate around the loop paths with no change in energy (the 120∘ angles on each triangle are maintained). Furthermore, the spins on different parallel chains can be excited independently. Hence, this type of excitation costs no energy and is non-dispersiveHarris et al. (1992). This mode has not been directly observed previously, and, since it occurs at zero energy, it is difficult to measure with most experimental techniques. Here, we report a direct observation of a zero energy mode in iron jarosite, which is lifted to a finite energy due to the presence of spin anisotropy resulting from the Dzyaloshinskii-Moriya (DM) interactionDzyaloshinkii (1958); Moriya (1960).
KFe3(OH)6(SO4)2 is an ideal realization of a Kagomé Heisenberg antiferromagnet due to its undistorted lattice, fully occupied magnetic sites, and weak interlayer couplingGrohol et al. (2003); Grohol et al. (2005). The Fe3+ ions form a perfect Kagomé arrangement and are surrounded by an octahedral environment of oxygens. Previous powder neutron diffraction studiesInami et al. (2000); Wills (2001) identified the long-range magnetic order below K as that shown in Fig. 1(a). For this spin arrangement, each triangle has positive vector chiralityInami et al. (2000); Grohol et al. (2005), such that the spins rotate clockwise as one traverses the vertices of a triangle clockwise. Magnetization results on single crystals have determined that the spins are canted slightly out of the Kagomé plane, yielding an “umbrella” structure. Moreover, each plane has a net ferromagnetic moment, with an antiferromagnetic coupling between adjacent planesGrohol et al. (2005).
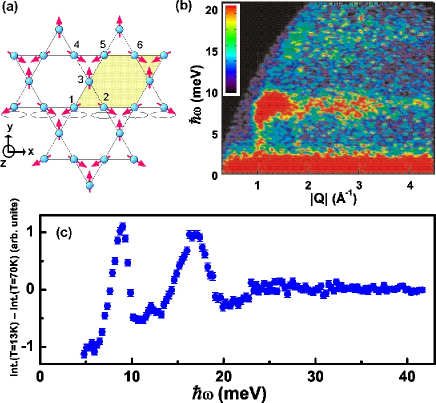
We first studied the magnetic excitations using a deuterated powder sample ( g) on the DCS and BT4 spectrometers at the NIST Center for Neutron Research, as shown in Figures 1(b) and 1(c). Figure 1(c) shows a difference plot of the intensity as a function of neutron energy loss measured above ( K) and below ( K) the Néel temperature. This difference plot removes most of the phonon contributions to the spectrum, hence yielding the spin wave density of states. Despite the powder average, the spectrum shows one sharp feature at meV and a second broad peak at about . Both features appear as excitation bands over a wide range of , as shown in Fig.1(b). This behavior is quite similar to that observed in strongly frustrated spinel systems where the excitation at has been described as a local resonanceLee et al. (2000). It is tempting to identify the features observed in the excitation spectrum as one- and two-magnon scattering since strong multi-magnon scattering might be expected due to the strong frustration and cubic terms in the spin-Hamiltonian. However, as shown below, our single crystal measurements provide much greater detail and demonstrate that these are regular spin wave modes, albeit with unusual dispersive behavior.
The spin wave dispersions were obtained from inelastic neutron scattering measurements on a single crystal sample (composed of four co-aligned crystals of total mass 101 mg) grown using a hydrothermal method reported previouslyGrohol et al. (2003); Grohol et al. (2005). High-resolution measurements were performed using the triple-axis spectrometer HB1 at the High Flux Isotope Reactor at Oak Ridge National Laboratory with the sample aligned in the (HK0) and (HHL) zones with the final energy fixed at either 13.6 meV or 14.7 meV. Vertically focused pyrolytic graphite (PG) crystals were used to monochromate and analyze the incident and scattered neutron beams using the reflection. Horizontal collimations of were employed, and PG filters were placed in the scattered beam to reduce higher-order contamination. The sample was cooled to K using a closed cycle 4He cryostat.
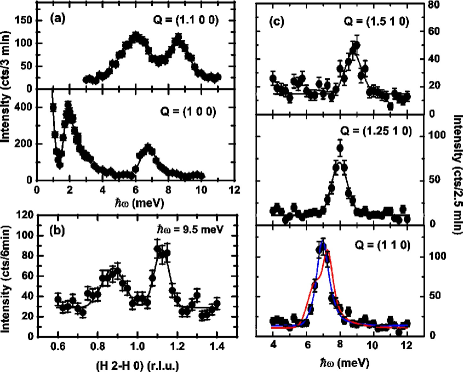
A series of energy scans (at constant ) and -scans (at constant energy) were performed, and a few representative scans are shown in Fig. 2. The observed peaks were initially fit with narrow Gaussians convoluted with the experimental resolution function. Subsequent fits were performed taking into account the empirical dispersion of the excitations. The peaks are resolution-limited, and the line-shapes are simply governed by the convolution with the instrumental resolution. A summary of all of the peak positions and intensities is shown in Figure 3(a). The error bars plotted in Figs. 3(a) and (b) correspond to three times the statistical error or one-tenth of the instrumental resolution, whichever is larger. The most striking feature of the data is the relatively flat mode near 7 meV which barely disperses, even out to the zone boundary.
The energy scan in Fig. 2(a) at the magnetic Brillouin zone center reveals two spin gaps, one at 1.8(1) meV (which is non-degenerate), and the other at 6.7(1) meV (which is two-fold degenerate within the experimental resolution). At , the lower-energy mode has dispersed to higher energy and merges with the flat mode located around 7 meV. The other upper-energy mode disperses strongly, moving to a high zone boundary energy of about 19 meV. Figure 2(c) shows constant-Q scans of the flat mode within a Brillouin zone centered at . This excitation barely disperses, starting from about 7 meV at the zone center and reaching about 9 meV at the zone boundary. We identify this flat mode as the “zero energy mode” of the Kagomé lattice which is lifted in energy for reasons discussed below.
We have fit the observed spin wave dispersions using the following generic Hamiltonian:yil
| (1) | |||||
where () indicates summation over pairs of nearest neighbors (next nearest neighbors), is the DM vector for bond as shown in Fig. 1(a), and the single-ion anisotropy terms are those used by Nishiyama et al.Nishiyama et al. (2003) in their treatment of the spin wave spectrum in jarosites. Here the primed spin components refer to the local axis associated with the rotated oxygen octahedra (see Ref. Nishiyama et al., 2003 for details). We ignore the weak interplane coupling, which is several hundred times smaller than Grohol et al. (2005).
The DM interaction is allowed for this crystal structure and merits further discussionElhajal et al. (2002). For bond 1-2, it has the form . The other DM vectors can be obtained from symmetry, such as , and . Note that the direction of the DM vector oscillates from bond to bond along the -direction. The -component of the DM vector favors the spins to lie in the plane and therefore effectively acts like an easy-plane anisotropy. The sign of breaks the symmetry between positive and negative vector chirality. Similarly the component breaks the rotational symmetry around the -axis and creates a small anisotropy with respect to in-plane orientations. The effect of is also to cant the spins so that they have a small out-of-plane component, consistent with the observed umbrella spin configuration.
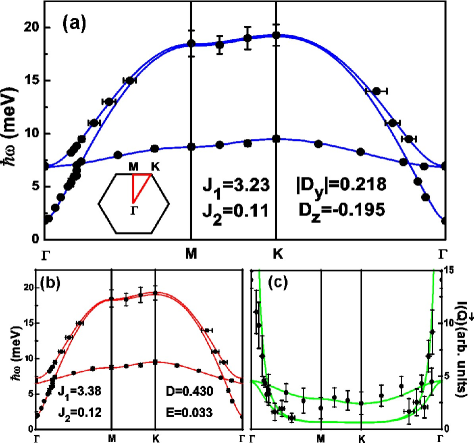
We may describe the spin wave data in terms of two simple spin models. In the first of these, which we call the DM model, we neglect the single ion anisotropy, so that the only nonzero parameters are , , , and . In the second model, which we call the CF (crystal field) model, all the anisotropy is attributed to the single-ion crystal field, so that the only nonzero parameters are , , , and . In both cases, is the dominant interaction. The numerical results obtained from these two models are plotted as the lines in Fig. 3, and the approximate analytic expressions for the spin gaps at the point are given in Table 1.
To account for the observed umbrella spin structure, we considered the effect of spin-canting on the spin wave energies. We find that the splitting of the mode energies at the high symmetry points are particularly sensitive to the magnitude of the spin canting angle out of the Kagomé plane. The best fit to the DM model is depicted by the lines in Fig. 3(a) and describes the data very well. We reproduce not only the gaps at the zone center, but also the small dispersion of the flat-mode. This small dispersion is a result of a weak interaction . We note that is positive (antiferromagnetic), which favors the experimentally observed ground state. The component of the DM vector also reinforces selection of this ground state. The “zero energy mode” is lifted by an energy equal to the out-of-plane spin wave gap, consistent with the spin rotations depicted in Fig. 1(a). The gaps at the point obtained numerically are in good agreement with the analytic results given in Table 1. The DM model yields a spin-canting angle of about 2.1o, in reasonable agreement with the experimentally estimated value of 1.5(5)o est .
The lines in Fig. 3(b) show the best fit to the CF model, which also is in reasonable agreement with the data. This model predicts a canting angle of 0.8o, which is slightly smaller than, but consistent with, the deduced experimental value. However, the least-squares goodness-of-fit to the spin wave spectrum is not as good as that using the DM model. The difference is most apparent in the numerical results for the mode splitting at the zone center. The CF model yields a relatively large splitting of about 0.71 meV for the 7 meV mode at the point, whereas the data indicate that this splitting is smaller than 0.4 meV. The red line in Fig. 2(c) shows the CF prediction for the energy scan at the zone center, and we see that this does not describe the lineshape very well. The DM model, depicted by the blue line, describes the data better. Moreover, as pointed out in Ref. Elhajal et al. (2002), the single ion anisotropy of the Fe3+ ion is expected to be small since it appears at second order in the spin-orbit coupling, whereas the DM term appears at first order.
| DM Model | CF Model | |
|---|---|---|
Therefore, we believe the observed spin wave spectrum is most naturally explained by a simple model which has only nearest and next-nearest isotropic interactions plus the DM interaction. The obtained fit parameters (in meV) are , , , and . From a previous studyGrohol et al. (2005), a value for of 3.9(2) meV was obtained from a fit of the susceptibility to a high-temperature series expansion resultHarris et al. (1992). The values of are in reasonable agreement, and the agreement would be even closer if the effects of and the DM term were taken into account in the susceptibility fit. As a further comparison, the susceptibility in Ref. Grohol et al. (2005) indicated a value of , where is the free electron Landé factor and is its shift in the crystalline environment. The magnitude of the DM vector can be estimated from Moriya’s calculation as Moriya (1960). From the current study, we have , showing very good agreement between measurements of the spin dynamics and the bulk thermodynamics.
Finally, from the analytic expressions for the spin gaps given in Table 1, we note that the in-plane gap is proportional to while the out-of-plane gaps are proportional to . Since is large compared to other interactions, the out-of-plane gap is significantly higher than the in-plane gap, despite the similar magnitude of and . This also suggests that at high temperatures (even above ), the spins would feel an easy-plane anisotropy and therefore display -like spin dynamics at high temperatures. This picture is consistent with the previous neutron scattering measurements of the critical fluctuations above which indeed have symmetryGrohol et al. (2005). That previous study also showed that vector chiral order is apparent above , consistent with the presence of the DM term and the positive sign of . Another interesting aspect of the analytic results is that the spin wave spectrum does not depend on the sign of , which determines the direction of the spin-canting relative to the in-plane order. This information on the canting cannot be determined from the currently available data and would be important for testing microscopic calculations of the DM interactions.
In summary, the spin wave spectrum of a Kagomé lattice antiferromagnet has been measured using inelastic neutron scattering. We observe a flat, lifted “zero energy mode” at 7 meV, whose presence reflects the huge ground-state degeneracy of the ideal Kagomé Heisenberg antiferromagnet. We have also determined all of the relevant spin Hamiltonian parameters by fitting our data to a Heisenberg model with the antisymmetric DM interaction. This realization of the Kagomé antiferromagnet is perhaps the best characterized geometrically frustrated spin system, and, as such, would be useful for precise tests of theoretical predictions. These results also highlight the importance of single crystal measurements to accurately interpret the data taken on powder samples of frustrated magnets.
We thank M.D. Lumsden, J.W. Lynn, and J.R.D. Copley for useful discussions. The work at MIT was supported by the National Science Foundation under award number DMR 0239377, and, in part, by the MRSEC program under award number DMR 02-13282. This work utilized facilities supported in part by the NSF under Agreement No. DMR-0454672. ORNL is managed for the US DOE by UT-Battelle, LLC. under Contract No. DE-AC05-00OR22725.
References
- Ramirez et al. (1999) A. Ramirez et al., Nature 399, 333 (1999).
- Snyder et al. (2001) J. Snyder, J. S. Slusky, R. J. Cava, and P. Schiffer, Nature 413, 48 (2001).
- Chalker et al. (1992) J. T. Chalker et al., Phys. Rev. Lett. 68, 855 (1992).
- Waldtmann et al. (1998) C. Waldtmann et al., Eur. Phys. J. B 2, 501 (1998).
- Sachdev (1992) S. Sachdev, Phys. Rev. B 45, 12377 (1992).
- Zeng and Elser (1995) C. Zeng and V. Elser, Phys. Rev. B 51, 8318 (1995).
- Huse and Rutenberg (1992) D. A. Huse and A. D. Rutenberg, Phys. Rev. B 45, 7536 (1992).
- Reimers and Berlinsky (1993) J. N. Reimers and A. J. Berlinsky, Phys. Rev. B 48, 9539 (1993).
- Sindzingre et al. (2000) P. Sindzingre et al., Phys. Rev. Lett. 84, 2953 (2000).
- Broholm et al. (1990) C. Broholm et al., Phys. Rev. Lett. 65, 3173 (1990).
- Hiroi et al. (2001) Z. Hiroi et al., J. Phys. Soc. Jap. 70, 3377 (2001).
- Wills (2001) A. S. Wills, Phys. Rev. B 63, 064430 (2001).
- Inami et al. (2000) T. Inami et al., Phys. Rev. B 61, 12181 (2000).
- Lee et al. (1997) S. H. Lee et al., Phys. Rev. B 56, 8091 (1997).
- Grohol et al. (2003) D. Grohol et al., Phys. Rev. B 67, 064401 (2003).
- Harris et al. (1992) A. B. Harris, C. Kallin, and A. J. Berlinsky, Phys. Rev. B 45, 2899 (1992).
- Dzyaloshinkii (1958) I. Dzyaloshinkii, J. Phys. Chem. Solids 4, 241 (1958).
- Moriya (1960) T. Moriya, Phys. Rev. 120, 91 (1960).
- Grohol et al. (2005) D. Grohol, K. Matan, J. H. Cho, S. H. Lee, J. W. Lynn, D. G. Nocera, and Y. S. Lee, Nature Mater. 4, 323 (2005).
- Lee et al. (2000) S. H. Lee et al., Phys. Rev. Lett. 84, 3718 (2000).
- (21) The spin wave spectrum of the jarosites for the most general bilinear Hamiltonian allowed by symmetry is treated in T. Yildirim and A. B Harris, to be published.
- Nishiyama et al. (2003) M. Nishiyama et al., Phys. Rev. B 67, 224435 (2003).
- Elhajal et al. (2002) M. Elhajal et al., Phys. Rev. B 66, 014422 (2002).
- (24) The spin canting angle was determined to be at K in Ref. [19]. The low temperature canting angle is estimated to be by extrapolating the ferromagnetic moment per Fe ion, , to K.