Current localization and Joule self-heating effects in Cr doped Nd0.5Ca0.5MnO3 manganites
Abstract
The effects of dc excitation current on the current-voltage curves of polycrystalline samples of Nd0.5Ca0.5Mn0.96Cr0.04O3 were investigated. The experimental results show that an abrupt jump of the voltage is concomitant with a huge increase in the temperature of the sample. A simple model and estimates for Joule self-heating effects support the experimental data. Moreover, the data strongly suggest that both the current localization in the metallic paths and local Joule self-heating effects are essential ingredients to understand the current-induced phase transition in phase-separated manganites.
pacs:
75.47.Lx, 71.30.+h, 64.60.AkIt has been reported that phase control in manganites can be achieved by both the appropriate chemical substitutions,1 and by application of external stimuli such as pressure ,2 magnetic field ,1 high-power laser irradiation,3 and electric fields .4 However, while both and change the bulk properties of the colossal magnetoresistance (CMR) manganites, the influence of light, X-rays, and electric current may result in a rather localized phase transition.5 In particular, effects induced by applied have been studied in both the charge/orbital-ordered (CO-OO) and the ferromagnetic-metallic (FMM) states in single crystals and polycrystalline samples of CMR manganites.4 ; 5 ; 6 ; 7 ; 8 ; 9 ; 10 In these compounds, a drop in the electrical resistivity above a threshold value of the applied dc (or dc current ) is generally observed.6 ; 7 This -driven (or -driven) insulator to metal transition MI is close related to the occurrence of a nonlinear conductivity.4 ; 6 The nonlinearity of the - curves, observed for , is thus explained by considering a percolation process due to the melting of the CO insulating (COI) phase into the metallic one. This interpretation is based on the opening of metallic-filament paths in a COI matrix.4 ; 5 ; 6
Besides the common observation of nonlinearity in - curves, this scenario is still not clear and other physical mechanisms have been proposed as the depinning of the CO-OO state upon application,7 the change in the orientation of the OO in the insulating state upon application of large ,10 and an -induced switching of the directional order of the OO states of eg electrons.11 Results of - curves under also indicated an increase of the magnetization at the same threshold where rises abruptly.9 It was argued that Joule heating effects were insignificant and the formation of a less-resistive mixed state, but with higher magnetization than the initial CO state, was suggested.9 More recently, the nonlinear conduction was described by considering a model for charge-density-wave (CDW) motion.12
The proposed scenarios for the (or )-induced phase transition usually consider mechanisms related to the interplay between charge and spin degrees of freedom.7 ; 8 ; 9 ; 10 ; 11 ; 12 However, based on magneto-optical imaging of local magnetization and distribution, a different view has been recently proposed.13 It was suggested that application of high density reduces the metallic channels due to local Joule self-heating effects. Increasing changes the metallic paths into insulating regions, further localizing the inhomogeneous current flow, and propagating the Joule self-heating. This process results in a rapid collapse of the metallic channels, which is related to an abrupt jump in the - curves at a well-defined threshold .13
We report the occurrence of abrupt jumps/drops on the across the phase-separated manganite Nd0.5Ca0.5Mn0.96Cr0.04O3 (Cr-NCMO). By using an appropriated experimental setup we have observed that the occurrence of nonlinearity in - curves is a precursor of a drastic rise in the temperature of the sample . A model to account for the increase in on increasing supports the experimental data. Moreover, based on the temperature dependence of the specific heat , an estimate of the energy dissipation of the material further confirms the importance of Joule heating effects. The results allowed us to propose that Joule self-heating effects associated with localized conduction are essential ingredients to understand the abrupt -induced phase transition in phase-separated manganites.
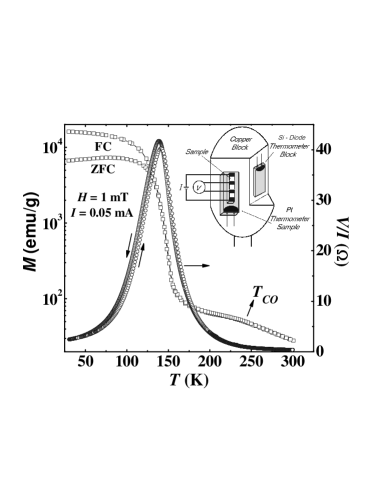
Polycrystalline samples of Cr-NCMO were prepared by solid state reaction.14 Four-wire dc and - measurements were performed between 30 and 300 K. Four gold contact pads were deposited on parallelepiped-shaped (typically of length =0.60 cm, width =0.145 cm, and thickness =0.075 cm) samples to obtain excellent electric contacts by using Ag epoxy. In - measurements, the current sweeps between -100100 mA were carried out in 0.5 mA steps. To avoid any memory effects, after each measurement the sample was heated to 300 K, cooled down to 30 K, and then heated to the desired measuring . The experimental setup for the electrical measurements uses a cold finger connected to a closed-cycle helium refrigerator. The temperature of the system is monitored with a silicon diode, positioned near the sample, and mounted on the copper block. The temperature of the sample is measured by a Pt thermometer placed on the copper block. The sample stands over the Pt thermometer and is fixed to it by using a thin thermal conducting silicon grease layer. The inset in Fig.1 displays a schematic draw of the sample holder setup. Magnetization measurements were performed in a SQUID magnetometer under applied magnetic field of 1 mT in both FC and ZFC modes. measurements in Cr-NCMO crystals were performed in a Quantum Design PPMS apparatus.
The compound Nd0.5Ca0.5MnO3 has a CO antiferromagnetic-insulator (AFI) ground state below 240 K where a partial OO and magnetic correlations of short range are observed.1 ; 15 At low , the OO increases and a long range CE-type AFI state is established below 170 K. Substitutions on the Mn site are an effective way to gradually modify the CO state.1 The material under investigation Nd0.5Ca0.5Mn0.96Cr0.04O3 is well studied and develops a FMM phase at low temperatures, as shown in Fig.1.1 ; 15 The transition to the CO regime is inferred from a subtle change of and a small cusp in the data at 240 K.1 ; 15 With decreasing , a MI transition, closely related to the FM transition, occurs at 140 K when =0.05 mA. The thermal irreversibility in both and data indicate a coexistence of CO/OO and FMM phases at low temperatures.14 ; 16 Indeed, under Cr-doping and for , these compounds are comprised of a fine mixture of 20-30 nm domains of the FMM phase embedded in the CO/OO matrix.16
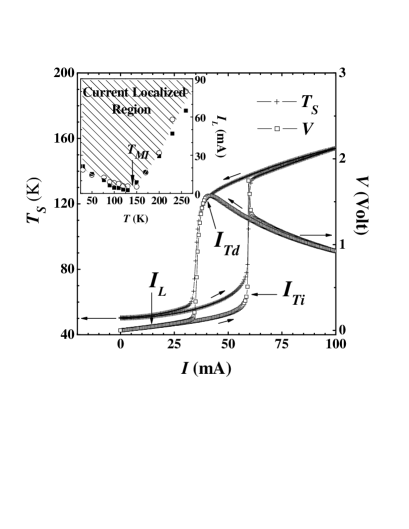
Fig.2 shows a typical - curve (=50 K) and the temperature rise of the sample as increases. The data reveal a clear correspondence of both and curves against . At low , the rising in is smooth and the - data is here considered linear up to an value 14.5 mA. is defined as the current in which the temperature measured by the Pt-thermometer increases 1 K. As evolves, the - data loose the linearity and rises progressively. Further rising in leads to a switch to a much higher / value, as inferred from a steep increase in at 59 mA (5.4 A/cm2). This -induced phase transition is accompanied by a remarkable increase in from 70 to 135 K in a narrow range of while displays a spike-like maximum. With further increasing in , decreases monotonically, i. e., the - curves exhibit a negative differential resistance (0) up to =100 mA.6 This feature is also reproduced in that rises continuously, reaching 155 K for =100 mA, while the temperature of the copper block varied 1.6 K.
The -induced phase transition at is useful to separate two well defined regions in dynamical - curves: below and above , where the material can be considered as a metal or insulator, respectively. The decreasing branch of - curves shows a pronounced irreversibility in , preserving the more insulating state down to a lower value of the threshold current (=50 K)40 mA. At this excitation current, drops rapidly, and the initial - curve is recovered with further decreasing . Again, follows essentially the same trend: it decreases from 150 K but it is kept above 100 K while the more insulating state is preserved. Accordingly, close to (=50 K)40 mA, drops rapidly to 55 K and continuously decreases towards to the initial value (50 K).
Due to a thin conducting grease layer separating the Pt-thermometer and the sample, a temperature gradient in this region is expected to occur. An estimate of is made by comparing values of / in - curves and considering the / vs. data of Fig.1. From Fig.2, the spike-like maximum in /29 (60 mA) corresponds to an average temperature reached by the sample of 152 K (see Fig.1), a value compatible with the transition from metallic to insulating behavior but slightly higher than 135 K measured by the Pt-thermometer. Such a difference 17 K is certainly related to the thermal coupling between sample and the Pt-thermometer but not only. A temperature gradient between the sample surface and the bottom is also expected since the thermal conductance in manganites is rather low.17 In addition, the estimated average sample temperature extracted from the / data of Fig.1, taken at constant and rather low value of =0.05 mA, must be also considered. For such low values of a homogeneous distribution of within the sample is expect, a feature hardly believed to occur at 60 mA.
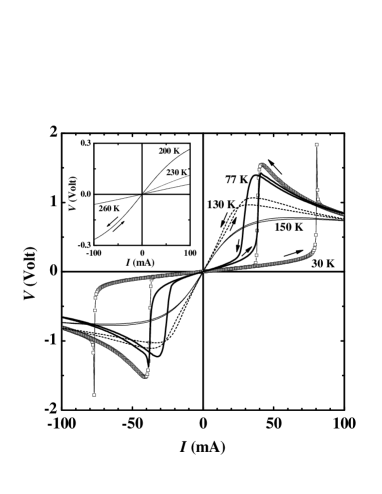
A set of - curves taken at different is displayed in Fig.3. The most prominent feature here is the sharp jump in at , which decreases appreciably with increasing and is barely identified for (inset of Fig.3). Increasing also results in a less pronounced irreversibility of the - curves for and, for , they exhibit a reversible behavior.18 This indicates that the irreversibility in - curves is close related to the phase competition in the phase-separated manganite, being larger when the FMM phase is robust, and further evidences the localized electric conduction in the FMM phase. The sweep to negative values leads to an antisymmetric - behavior of the curves.
From - curves at different , values of were computed and are shown in the inset of Fig.2. Such a diagram is useful for separating regions where current localization takes place in these materials. The decrease of with increasing reflects the reduction of the relative volume fraction (VF) of the FMM phase, which coexist with the CO/AFI.1 ; 14 ; 16 Such a reduction is consistent with a more localized distribution across the material and provides an explanation for the so-called -induced change in .19 ; 20 A considerable increase of for suggests a much more homogenous distribution of across the sample in the insulating phase.13 ; 20 However, the current localization at high applied and is probably related to the inhomogeneous nature of the CO-state, in which different structural phases were found to coexist.15 ; 20a These observations suggest that both the temperature dependence of and the abrupt jump in are intimately related to the VF of the metallic phase within the material which is believed to vanish when the average temperature of the sample is .
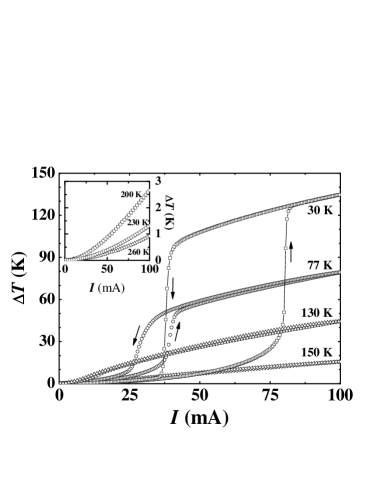
We have carefully checked changes in the temperature of the copper block in all - curves. The data show a maximum temperature rise of the block of 1.9 K at =30 K, when the sample is subjected to =100 mA and 165 K. Thus, the temperature rise of the sample with respect to the copper block has been defined as = - and typical data of vs. are shown in Fig.4. At =30 K, a huge rise of 100 K in , at essentially the same 80 mA where increases drastically, is observed. The average temperature reached by the sample just after the jump was measured to be 155 K, a value higher than 140 K. Such a rise in is certainly caused by Joule self-heating effects, a process that continues up to =100 mA, where 165 K. When the sample was subjected to a power dissipation of 0.1 W (=100 mA), the highest value of 135 K was observed for =30 K. Again, a temperature gradient 15 K, at =100 mA, was estimated, further indicating a current localization, as already mentioned. Such a of the experimental arrangement is more pronounced at high and , indicating that the local temperature of the sample is significantly altered by the current localization.
The behavior of also displays irreversibility in curves taken at low temperatures, a feature that vanishes for . Increasing results in smaller values of , being 2 K for =100 mA at (inset of Fig.4). Therefore, the experimental data suggest that changes in - curves are close related to Joule self-heating effects, to the VF of the FMM phase, and to the localized distribution of in the metallic phase.
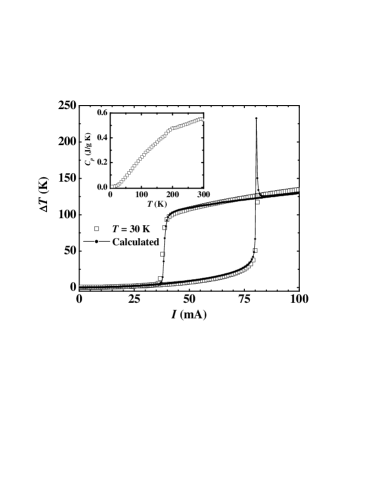
To support the experimental findings, the expected increase in due solely to Joule self-heating effects was calculated by considering the heat dissipation in the sample under applied and the heat conduction by the grease placed between the sample and the Pt thermometer.21 Since was found to be nearly constant during the experiment, the temperature rise of the sample can be approximated by (), where is the power dissipated in the sample, and is the thermal conductivity of the grease with area and thickness . By using the experimental =/ data and =*(), =(+)/*(), where , , and were already defined. Considering that 0.16 Wm-1K-1 is nearly temperature independent in the range investigated (30-160 K),22 an example of the calculated (=30 K,) for a typical sample is shown in Fig.5. The good agreement between the calculated and the measured confirms that Joule self-heating provides an excellent description for the temperature rise of the sample. Small deviations in the high region are mainly related to: (i) the transition to the insulating regime where the VF of the FMM is low; (ii) changes in that is assumed to be constant; (iii) a thermal gradient within the sample; and (iv) a more homogeneous distribution of across the sample (see inset of Fig.2).5 ; 13 Furthermore, the data of a Cr-NCMO single crystal specimen (inset Fig.5) allowed us to estimate the energy required to heat the sample at a given temperature and to compare with the one due to Joule self-heating effects. By using the data, the energy required to heat a Cr-NCMO sample from 30 to 140 K was estimated to be 85 mJ. Accordingly, the energy dissipated by (=30 K) was found to be 80 mJ, corresponding to a 140 K, in excellent agreement with the data shown in Fig.5). This result supports the experimental data, and lends credence to the relationship between Joule self-heating effects and the temperature rise of the sample.
In summary, the combined experimental results indicate that the abrupt increase of can be doubtless ascribed to the heat generated by the flow through localized pathways in the FMM phase. Under relatively low , the weaker metallic regions become insulating, increasing the current density in the remaining FMM paths.5 This is reflected in both the initial rise of and changes in the - behavior. As evolves, the weaker metallic paths are progressively reduced and the Joule self-heating effect increases, culminating in a rapid collapse of the FMM phase.5 This is mirrored in the observed jumps in and the dramatic rise of . The Joule self-heating is strong enough to promote the sample to the insulating phase (), resulting in a less appreciable self-heating due to a much more homogeneous distribution of .13 ; 20 The negative differential resistance at high values (Figs.2 and 3) is a consequence of the decrease in /() as still rises with increasing .
This work was supported by the Brazilian agency FAPESP under Grant No. 99/10798-0, 01/01454-8, and 01/04231-0. R. F. J. and F. C. F. are CNPq (Brazil) fellows under Grant No. 303272/2004-0 and 301661/2004-9, respectively.
References
- (1) T. Kimura et al., Phys. Rev. B 62, 15021 (2000).
- (2) Y. Moritomo et al., Phys. Rev. B 55, 7549 (1997).
- (3) K. Miyano et al., Phys. Rev. Lett. 78, 4257 (1997).
- (4) A. Asamitsu et al., Nature (London) 388, 50 (1997).
- (5) M. Fiebig et al., Science 280, 1925 (1998).
- (6) A. Guha et al., Phys. Rev. B 62, 5320 (2000).
- (7) A. Guha et al., Appl. Phys. Lett. 75, 3381 (1999).
- (8) S. Mercone et al., Phys. Rev. B 65, 214428 (2002).
- (9) J. Stankiewicz et al., Phys. Rev. B 61, 11236 (2000).
- (10) Y. Tokura and N. Nagaosa, Science 288, 462 (2000).
- (11) K. Hatsuda et al., Appl. Phys. Lett. 83, 3329 (2003).
- (12) A. Wahl et al., Phys. Rev. B 68, 094429 (2003).
- (13) M. Tokunaga et al., Phys. Rev. Lett. 93, 037203 (2004).
- (14) A. S. Carneiro et al., J. Appl. Phys. 93, 8074 (2003).
- (15) W. Schuddinck et al., J. Magn. Magn. Mater. 211, 105 (2000).
- (16) S. Mori et al., Phys. Rev. B 67, 012403 (2003).
- (17) J. L. Cohn et al., Phys. Rev. B 56, R8495 (1997).
- (18) The irreversible behavior of both and vs. curves below are further evidence of the phase-separation in this manganite. In this range both and , along with the difference -, decrease with increasing and approach zero at .
- (19) F. X. Hu and J. Gao, Phys. Rev. B 69, 212413 (2004).
- (20) A. Palanisami et al., Phys. Rev. B 71, 094419 (2005).
- (21) See, for example: J. Xu et al., Physica C 357-360, 401 (2001); S. Xu et al., J. Phys. Soc. Jpn. 72, 922 (2003); Y. Moritomo et al., . 71, 1626 (2002).
- (22) P. Padhan et al., Phys. Rev. B 70, 134403 (2004).
- (23) L. C. Sim et al., Thermochim. Acta 430, 155 (2005).