apsrev
Present address: ]Los Alamos National Laboratory, Los Alamos, New Mexico 87545, USA
Magnetic phase transitions in the two-dimensional frustrated quantum antiferromagnet Cs2CuCl4
Abstract
We report magnetization and specific heat measurements in the 2D frustrated spin-1/2 Heisenberg antiferromagnet Cs2CuCl4 at temperatures down to 0.05 K and high magnetic fields up to 11.5 T applied along , and -axes. The low-field susceptibility shows a broad maximum around 2.8 K characteristic of short-range antiferromagnetic correlations and the overall temperature dependence is well described by high temperature series expansion calculations for the partially frustrated triangular lattice with =4.46 K and =1/3. At much lower temperatures ( K) and in in-plane field (along and -axes) several new intermediate-field ordered phases are observed in-between the low-field incommensurate spiral and the high-field saturated ferromagnetic state. The ground state energy extracted from the magnetization curve shows strong zero-point quantum fluctuations in the ground state at low and intermediate fields.
pacs:
75.10.Jm, 75.30.KzI Introduction
Cs2CuCl4 is a quasi-2D Heisenberg antiferromagnet with =1/2 Cu2+ spins arranged in a triangular lattice with spatially-anisotropic couplings.Coldea01 The weak interlayer couplings stabilize magnetic order at temperatures below 0.62 K into an incommensurate spin spiral. The ordering wavevector is largely renormalized from the classical large- value and this is attributed to the presence of strong quantum fluctuations enhanced by the low spin, geometric frustrations and low dimensionality.renormalization ; Veillette The purpose of the thermodynamic measurements reported here is to probe the phase diagrams in applied magnetic field and see how the ground state spin order evolves from the low-field region, dominated by strong quantum fluctuations, up to the saturated ferromagnetic phase, where quantum fluctuations are entirely suppressed by the field. Intermediate fields are particularly interesting as the combination of (still) strong quantum fluctuations, potentially degenerate states due to frustration and an effective “cancelling” of small anisotropies by the applied field may stabilize non-trivial forms of magnetic order.
The Hamiltonian of Cs2CuCl4 has been determined from measurements of the magnon dispersion in the saturated ferromagnetic phase.Coldea02 The exchanges form a triangular lattice with spatially-anisotropic couplings as shown in Fig. 1(b) with exchanges meV (4.34 K) along , along the zig-zag bonds in the plane, and weak interlayer couplings along . In addition there is also a small Dzyaloshinskii-Moriya interaction , which creates an easy-plane anisotropy in the () plane (for details see Ref. Coldea02, ). Neutron diffraction measurements have shown rather different behavior depending on the field direction with respect to the easy-plane. For perpendicular fields (along -axis) incommensurate cone order with spins precessing around the field axis is stable up to ferromagnetic saturation, however for fields applied along the -axis (in-plane) the incommensurate order is suppressed by rather low fields, 2.1 T compared to the saturation field of 8.0 T along this axis.Coldea01 The purpose of the present magnetization and specific heat measurements is to explore in detail the phase diagram in this region of intermediate to high fields. From anomalies in the thermodynamic quantities we observe that for in-plane field several phases occur in-between the low-field spiral and the saturated ferromagnetic states. From the magnetization curve we extract the work required to fully saturate the spins and from this we derive the total ground state energy in magnetic field and the component due to zero-point quantum fluctuations.
II Experimental details
DC-magnetization of a high-quality single crystal of Cs2CuCl4 grown from solution was measured at temperatures down to 0.05 K and high fields up to 11.5 T using a high-resolution capacitive Faraday magnetometerSak94 . A commercial superconducting quantum interference device magnetometer (Quantum Design MPMS) was used to measure the magnetization from 2 K to 300 K. The specific heat measurements were carried out at temperatures down to 0.05 K in magnetic fields up to 11.5 T using the compensated quasi-adiabatic heat pulse method Wil04 .
III Measurements and results
III.1 Temperature-dependence of susceptibility
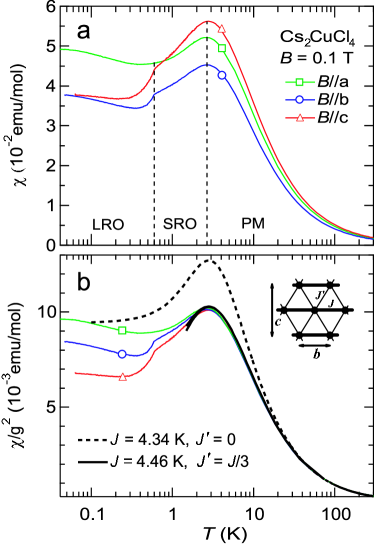
We first discuss the temperature-dependence of the magnetic susceptibility at low field and compare with theoretical predictions for an anisotropic triangular lattice as appropriate for Cs2CuCl4. Figure 1(a) shows the measured susceptibility in a field of 0.1 T. A Curie-Weiss local-moment behavior is observed at high temperatures and a broad maximum, characteristic of short-range antiferromagnetic correlations, occurs around K, in agreement with earlier data.Carlin Upon further cooling the - and -axes susceptibilities show a clear kink at =0.62 K, indicating the transition to long-range magnetic order. No clear anomaly at is observed for . This is because the magnetic structure has ordered moments spiralling in a plane which makes a very small angle () with the plane.Coldea96 In this case the near out-of-plane (-axis) susceptibility is much less sensitive to the onset of magnetic order compared to the in-plane susceptibility (along and ). Fitting the high-temperature data ( K) to a Curie-Weiss form with gives 0.2 K and -factors =2.27, =2.11 and =2.36 for the -, - and -axes, respectively. The -factors are in good agreement with the values obtained by low-temperature ESR measurements =(2.20, 2.08, 2.30)Bailleul94 . When the susceptibility is scaled by the determined -values, , the data along all three crystallographic directions overlap within experimental accuracy onto a common curve for temperatures above the peak, indicating that the small anisotropy term in the Hamiltonian (estimated to 5% ) are only relevant at much lower temperatures. In the temperature range we compare the data with high-temperature series expansion calculationsWeihong04 for a 2D spin-1/2 Hamiltonian on an anisotropic triangular lattice (see Fig. 1(b) inset). Very good agreement is found for exchange couplings and =4.46 K (0.384 meV) (solid line in Fig. 1(b)). In contrast, the data departs significantly from the expected Bonner-Fisher curve for one-dimensional chains ( and K).Weihong04
III.2 Magnetization curve and ground-state energy
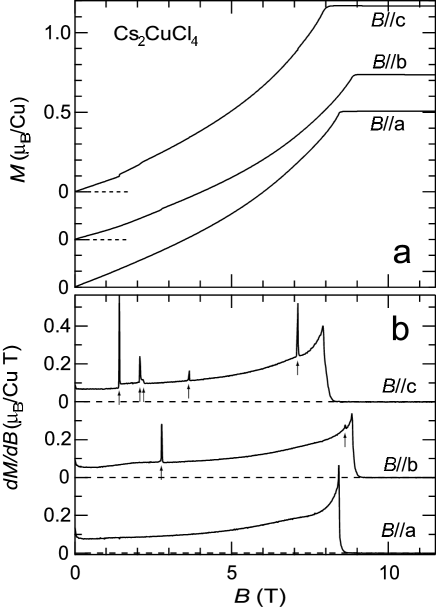
Figure 2 shows the magnetization and its derivative as a function of applied field at a base temperature of 0.05 K for the - and -axes and 0.07 K for the -axis. For all three axes the magnetization increases linearly at low field but has a clear overall convex shape and saturates above a critical field =8.44(2), 8.89(2) and 8.00(2) T along the -, - and -axis, respectively. When normalized by the -values the saturation fields are the same within 2% for the three directions, the difference being the same order of magnitude as the relative strength 5% of the anisotropy terms in the Hamiltonian.Coldea02 The saturation magnetizations are obtained to be only 1-2.5% below the full spin value of 1/2, which might be due to experimental uncertainties in the absolute units conversion or a slight overestimate of the -values by this amount. Including such a small uncertainty in the -values has only a small effect on the normalized susceptibility in Fig. 1(b) and does not change significantly the results of the comparison with the series expansion calculation for the anisotropic triangular lattice.
Before analyzing in detail the various transitions in field identified by anomalies in the susceptibility (vertical arrows in Fig. 2b) we briefly discuss how the ground-state energy varies with the applied field, as this gives important information about the effects of quantum fluctuations. The ground state energy is obtained by direct integration of the magnetization curve, i.e.
| (1) |
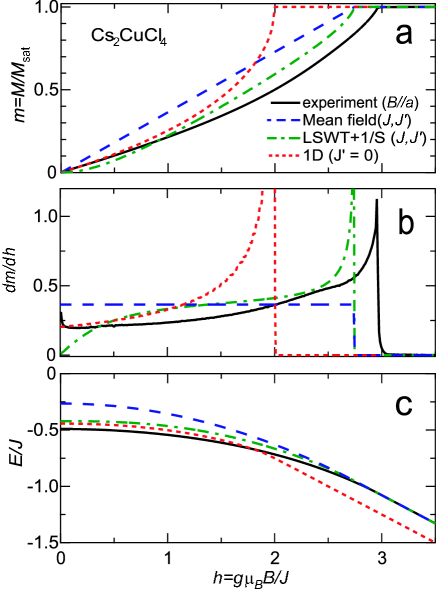
where the energy (per spin) above the saturation field takes the classical value because the ferromagnetic state is an exact eigenstate of the Hamiltonian with no fluctuations.Coldea02 Here is the sum of all exchange interactions equal to for the main Hamiltonian in Cs2CuCl4 [see Fig. 1b) inset]. Figure 3 shows comparisons between the experimental data for (black solid lines, similar results obtained using - or -axis data), a mean field calculation (blue dashed lines), a linear spin-wave theory(LSWT) with 1st order quantum correction (green dash-dotted lines) and Bethe-ansatz prediction for 1D chains (red dotted lines). In magnetic field, a cone structure is predicted by the classical mean field calculation Veillette (blue dashed lines) where is the classical ordering wavevector , , the saturation field is and . Here we use meV and for the main Hamiltonian in Cs2CuCl4. The experimentally-determined ground state energy (black solid line) is lower than the classical value (blue dashed line) due to zero-point quantum fluctuations. The energy difference in zero field is 85% of the expected classical energy , indicating rather strong quantum fluctuations in the ground state. The strongly non-linear (convex) shape of the magnetization curve compared to the classically-expected linear form [see Fig. 3(a)] is a direct indication of the importance of zero-point quantum fluctuations. Including 1st order quantum correction to the classical result in a linear spin-wave approach givesVeillette where is the average magnon energy in the 2D Brillouin zone of the triangular lattice. This improves the agreement with the data (green dash-dotted lines). Particularly at high fields it captures better the divergence of the susceptibility [see Fig. 3(b)] at the transition to saturation. The saturation field is underestimated slightly because we have here neglected the weak inter-layer couplings =4.5% and the DM interaction =5.3%J, both of which increase the field required to ferromagnetically-align the spins. It is also illuminating to contrast the data with a model of non-interacting chains (, red dotted lines). This would largely (by 48%) underestimate the observed saturation field and would predict a rather different functional form for the magnetization and susceptibility compared to the data, indicating that the 2D frustrated couplings are important.
III.3 Phase diagrams in in-plane field
When the magnetic field is applied along the -axis perpendicular to the plane of the zero-field spiral the ordered spins cant towards the field axis and at the same time maintain a spiral rotation in the plane thus forming a cone. The cone angle closes continuously at the transition to saturation and as expected in this case the susceptibility observes a sharp peak followed by a sudden drop as the field crosses the cone to saturated ferromagnet transition, see Fig. 2(b). However for fields applied along the - and -axes several additional anomalies are present in the magnetization curve apart from the sharp drop in susceptibility upon reaching saturation, indicating several different phases stabilized at intermediate field.
Before discussing in detail the experimental phase diagrams we note that for all field directions the magnetization increases in field up to saturation and no intermediate-field plateaus are observed, in contrast to the isostructural material Cs2CuBr4, where a narrow plateau phase occurs for in-plane field when the magnetization is near of saturation.Ono04 Such a plateau phase is expected for the fully-frustrated () triangular antiferromagnet and originates from the formation of the gapped collinear up-up-down state in field. The absence of a plateau in Cs2CuCl4 is probably related to the weaker frustration (=0.34(3)) compared to Cs2CuBr4() Ono04 .
A difference in the phase diagrams in field applied along the -axis and in the plane in Cs2CuCl4 is expected based on the presence of small DM terms in the spin Hamiltonian, which create a weak easy-plane anisotropy in the plane.Coldea02 Semi-classical calculations which take this anisotropy into account predict two phases below saturation:Veillette a distorted spiral at low field separated by a spin-flop like transition from a cone at intermediate field. The data in Fig. 2(b) however observe more complex behavior with several different intermediate-field ordered phases. Also early neutron scattering measurements did not observe the characteristic incommensurate magnetic Bragg peaks expected for a cone structure at 2.1 T -axis Coldea01 , suggesting that the magnetic structure at intermediate field may be quite different from the classical prediction and may be stabilized by quantum fluctuations beyond the mean-field level. To map out the extent of the various phases in in-plane field we have made a detailed survey of the phase diagram using both temperature and field scans in magnetization and specific heat and the resulting phase diagrams are shown in Fig. 10. Below we describe in detail the signature of those transitions in specific heat and magnetization data, first for field along the -axis, then -axis.
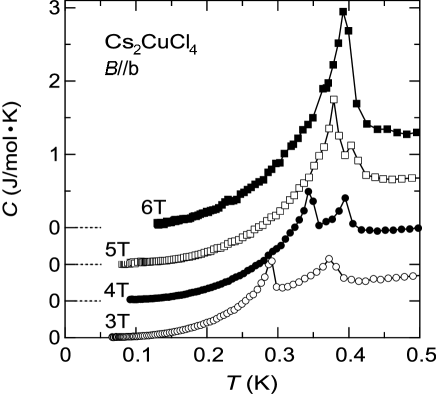
Magnetization and differential susceptibility in field along are shown in Fig. 2. shows a sharp peak at =2.76 T and an additional small peak at =8.57 T and those two anomalies indicate two new phases at base temperature below the saturation field and above the spiral phase. To probe the extent in temperature of those phases we show in Fig. 4 specific heat measurements as a function of temperature at constant magnetic field. At 3 T two peaks are clearly observed indicating two successive phase transitions upon cooling from high temperatures. The lower critical temperature increases rapidly with increasing field and gradually approaches the upper transition at 5 T and the two peaks appear to merge at 6 T.
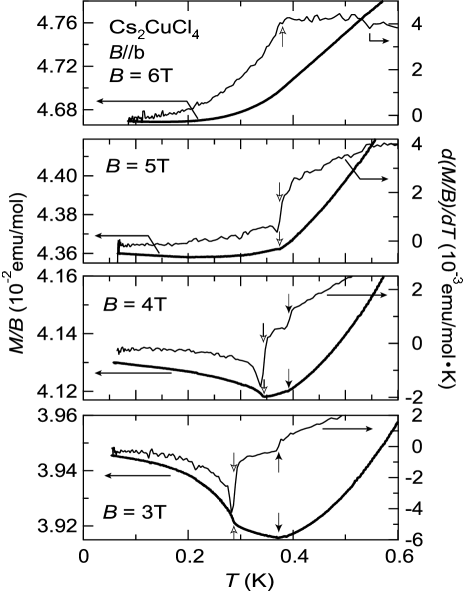
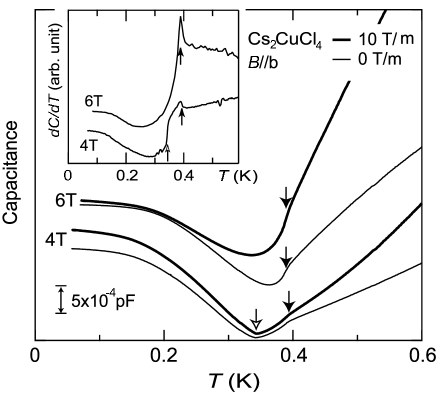
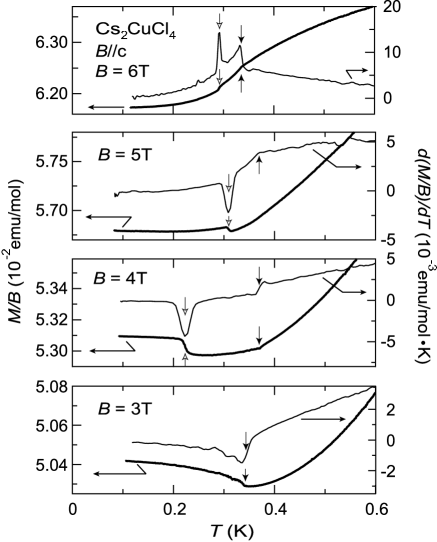
Complementary magnetization data vs. temperature for field along is shown in Fig. 5. At 3 and 4 T two anomalies are observed also in and its derivative , at essentially the same temperatures as the peaks in specific heat, indicating that those two anomalies are associated with magnetic phase transitions. The anomalies appear as kinks in and steps in . At 5 T however the scaled magnetization only observes a clear anomaly at the lower of the two critical temperatures observed in specific heat. At 6 T no anomaly is visible in , but only the derivative shows a kink. The missing anomalies can however be seen in the raw capacitance data, plotted in Fig. 6, which also contain information not only on the (longitudinal) magnetization but also the transverse spin components. At 4 T the capacitance in both zero and non-zero gradient field show two successive transitions indicated by solid and open arrows. Those are in good agreement with the peaks observed in specific heat. Although there is no anomaly visible in the magnetization at 6 T, the raw capacitance shows an anomaly (see derivative of in inset of Fig. 6)) at the same temperature as the peak in specific heat. The capacitance in non-zero gradient field contains information on the torque of the sample in addition to the magnetization, while that in zero gradient field does not depend on magnetization but only on the torque. The torque contribution is subtracted by measuring the capacitance in zero gradient field (details of measurement technique are described in Ref. [5]). The fact that there is no anomaly in magnetization implies that subtraction of torque effect cancels out the anomaly in the raw data. Therefore only the torque (transverse magnetization) has an anomaly and the longitudinal magnetization has no anomaly at the critical temperatures for these missing anomalies.
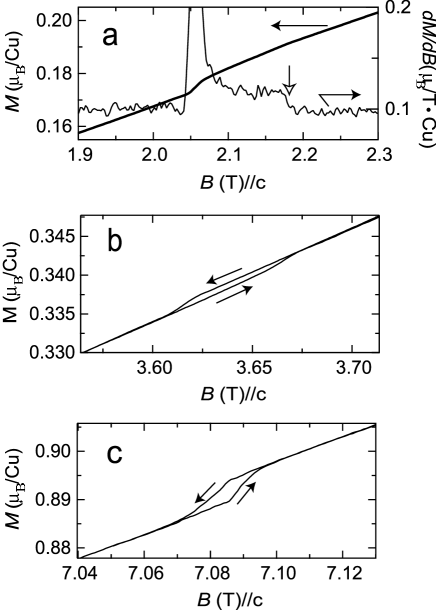
For field along it has been reported from neutron scattering study that the spiral phase at zero field is suppressed by magnetic field of 1.4 T and above this field ordered spins form an incommensurate elliptical structure with elongation along the field direction Coldea01 . The elliptical phase is suppressed at 2.1 T where the intensity of incommensurate magnetic Bragg peaks vanishes and the properties of the phase above 2.1 T are still unknown. As shown in Fig. 2(b), the suppression of the spiral phase is clearly seen as a step in magnetization (a sharp peak in ) at 1.40 T. In Fig. 7 the magnetization at 0.07 K and its derivative are expanded in order to show the four anomalies above the spiral phase. In Fig. 7(a), shows a small step (a peak in ) at 2.05 T, corresponding to the suppression of the elliptical phase. As indicated by an open arrow in Fig. 7(a), a step in susceptibility at 2.18 T is clearly seen, indicating possibly a new phase which may exist only in a very small range of fields from 2.05 to 2.18 T. The next transition occurs at 3.67 T (for increasing field) shown in Fig. 7(b). has a step accompanied by a hysteresis, indicative of a first order transition. Figure 7(c) shows another transition at 7.09 T with a clear hysteresis.
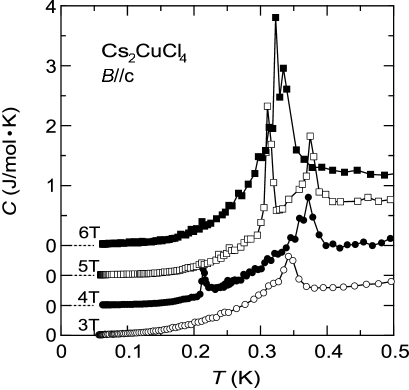
Fig. 8 shows specific heat in magnetic fields along the -axis. At 3 T only one transition is observed upon cooling, whereas at 4 and 5 T two successive transitions are observed. The lower temperature transition is very sharp, related to the first order behavior (hysteresis) on this transition line also observed in magnetization data at 3.67 T shown in Fig. 7(b). The lower temperature transition shifts to higher temperatures with increasing field and almost merges with the upper transition at 6 T.
Fig. 9 shows complementary magnetization data vs. temperature. At 3 T and show a kink and a step at 0.35 K, respectively. At 4 T the position of the kink (step in ) is shifted to slightly higher temperature and another step-like anomaly (a negative peak in ) appears at lower temperatures 0.22 K. At 5 T this lower temperature step shifts to higher temperatures and the upper temperature anomaly (kink) can not be seen in but is manifested as a kink in at 0.38 K. Again the anomaly is missing in , but the raw capacitance data (not shown) exhibits an anomaly at 0.38 K in good agreement with the specific heat result. As shown in the top panel of Fig. 9, and have two anomalies at 6 T. Note that due to the first order character of the lower temperature transition the anomalies of () indicated by open arrows in Fig. 9 are steps (peaks) rather than kinks (steps).
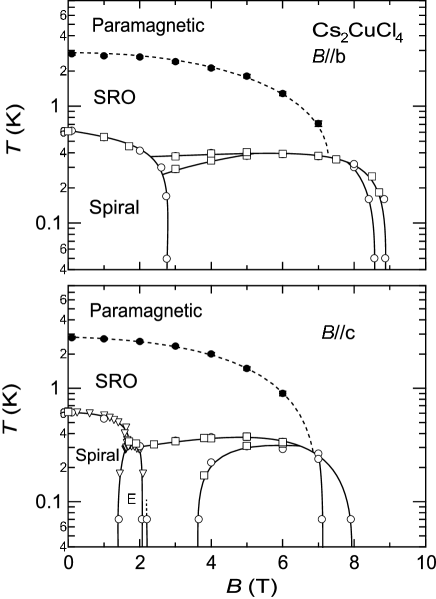
The phase diagrams for - and -axis constructed using the anomalies discussed above are shown in Fig. 10. The new data agree with and complement earlier low-field neutron diffraction results (open triangles).Coldea01 Apart from the phase transition boundaries identified above we have also marked the cross-over line between paramagnetic and antiferromagnetic short-range ordered(SRO) region, determined by the location of the peak in the temperature dependence of the magnetization such as in Fig. 1(a). The peak position decreases with increasing field and disappears above , indicating suppression of antiferromagnetic correlations by magnetic field. For the field along and -axis the phase diagrams are much more complicated than that for which shows only one cone phase up to saturation field Coldea02 ; Rad05 . For three new phases appear above the spiral phase. Two of these phases occupy small areas of the phase diagram. For four new phases are observed in addition to the spiral and elliptical phases.
We note that the absence of an observable anomaly in the temperature dependence of the magnetization upon crossing the phase transitions near certain fields (6 T along and 5 T along ) is consistent with Ehrenfest relation and is related to the fact that the transition boundary is near flat around those points. The relation between the shape of the phase boundary and the anomaly in was discussed by T. Tayama, et. al.Tay01 and is
| (2) |
where is the discontinuity of quantity , is the specific heat and is the field-dependent critical temperature of second order phase transition. This shows that the discontinuity in vanishes when , i.e. when the phase boundary is flat in field. This is indeed the case for 6 T and at 5 T [see Fig. 10], and here only a kink and no discontinuity is seen in .
IV Conclusions
We have studied the magnetic phase diagrams of Cs2CuCl4 by measuring magnetization and specific heat at low temperatures and high magnetic fields. The low-field susceptibility in the temperature range from below the broad maximum to the Curie-Weiss region is well-described by high-order series expansion calculations for the partially frustrated triangular lattice with =1/3 and =0.385 meV. The extracted ground state energy in zero field obtained directly from integrating the magnetization curve is nearly a factor of 2 lower compared to the classical mean-field result. This indicates strong zero-point quantum fluctuations in the ground state, captured in part by including quantum fluctuations to order in a linear spin-wave approach. The obtained phase diagrams for in-plane field ( and -axis) show several new intermediate-field phases. The difference between the phase diagrams for and can not be explained by a semi-classical calculation for the main Hamiltonian in Cs2CuCl4, of a frustrated 2D Heisenberg model on an anisotropic triangular lattice with small DM terms. Further neutron scattering experiments are needed to clarify the magnetic properties of these new phases.
Acknowledgements.
We would like to thank V. Yushankhai, D. Kovrizhin, D.A. Tennant, M. Y. Veillette and J.T. Chalker for fruitful discussions, Z. Weihong for sending the series data, P. Gegenwart and T. Lühmann for technical support.References
- (1) R. Coldea, D. A. Tennant, A. M. Tsvelik and Z. Tylczynski, Phys. Rev. Lett. 86, 1335 (2001).
- (2) Z. Weihong, R.H. McKenzie, and R.R.P. Singh, Phys. Rev. B 59, 14367 (1999); C. H. Chung, J. B. Marston, and R. H. McKenzie,J. Phys. C: Condens. Matter 13, 5159 (2001)
- (3) M. Y. Veillette, J. T. Chalker and R. Coldea, Phys. Rev. B 71 214426 (2005)
- (4) R. Coldea, D. A. Tennant, K. Habicht, P. Smeibidl, C. Wolters, and Z. Tylczynski, Phys. Rev. Lett. 88, 137203 (2002).
- (5) T. Sakakibara, H. Mitamura, T. Tayama, H. Amitsuka, Jpn. J. Appl. Phys. 33 5067 (1994).
- (6) H. Wilhelm, T. Lühmann, T. Rus and F. Steglich, Rev. Sci. Instrum. 75 2700 (2004)
- (7) R. L. Carlin, R. Burriel, F. Palacio, R. A. Carlin, S. F. Keij, and D. W. Carnegie, J. Appl. Phys 57, 3351 (1985).
- (8) R. Coldea, D.A. Tennant, R.A. Cowley, D.F. McMorrow, B. Dorner and Z. Tylczynski, J. Phys.:Condens. Matter 8, 7473 (1996).
- (9) S. Bailleul, J. Holsa, and P. Porcher, Eur. J. Solid State Inorg. Chem. 31, 432 (1994).
- (10) Weihong Zheng, R.R.P. Singh, R.H. McKenzie, and R. Coldea, Phys. Rev. B 71 134422 (2005).
- (11) T. Ono, H Tanaka, O Kolomiyets, H Mitamura, T Goto, K Nakajima, A Oosawa, Y Koike, K Kakurai, J Klenke, P Smeibidle and M Meißner, J. Phys. Condens. Matter 16 S773 (2004)
- (12) T. Radu, H. Wilhelm, V. Yushankhai, D. Kovrizhin, R. Coldea, Z. Tylczynski, T. Lühmann, F. Steglich, Phys. Rev. Lett. 95 127202 (2005)
- (13) T. Tayama, T. Sakakibara, K. Kitami, M. Yokoyama, K. Tenya, H. Amitsuka, D. Aoki, Y. Ōnuki, Z. Kletowski, J. Phys. Soc. Jpn. 70 248 (2001)