Thermodynamic stability of fluid-fluid phase separation in binary athermal mixtures: The role of nonadditivity
Abstract
We study the thermodynamic stability of fluid-fluid phase separation in binary nonadditive mixtures of hard-spheres for moderate size ratios. We are interested in elucidating the role played by small amounts of nonadditivity in determining the stability of fluid-fluid phase separation with respect to the fluid-solid phase transition. The demixing curves are built in the framework of the modified-hypernetted chain and of the Rogers-Young integral equation theories through the calculation of the Gibbs free energy. We also evaluate fluid-fluid phase equilibria within a first-order thermodynamic perturbation theory applied to an effective one-component potential obtained by integrating out the degrees of freedom of the small spheres. A qualitative agreement emerges between the two different approaches. We also address the determination of the freezing line by applying the first-order thermodynamic perturbation theory to the effective interaction between large spheres. Our results suggest that for intermediate size ratios a modest amount of nonadditivity, smaller than earlier thought, can be sufficient to drive the fluid-fluid critical point into the thermodinamically stable region of the phase diagram. These findings could be significant for rare-gas mixtures in extreme pressure and temperature conditions, where nonadditivity is expected to be rather small.
I Introduction
Mixtures of large and small colloidal particles can be modelled with a binary hard-sphere mixture. Depending on the value of the size ratio , where and are the large and small sphere diameters, respectively, and on the packing fractions of the two species and , the small spheres induce effective attractions among large particles. For size ratios very different from one, the strength of these attractions can be such as to originate a fluid-fluid phase separation (FFPS). In fact, several studies show that phase separation switches on for very asymmetric size ratios, i.e. (see Ref. dijk1 and references therein) and that it is always preempted by the freezing transition. The physical origin of this attraction is found in the osmotic depletion effect, i.e., in the gain of free volume available to the small spheres due to the overlap of excluded volumes of approaching larger spheres. On the other hand, a more efficient packing for phases involving a majority of particles of the same species can be obtained also by means of a positive nonadditivity in the cross interaction diameter dijk2 . In real sytems, such as sterically or electrostatically stabilized colloids, nonadditivity is expected to be rather small louis . Nonadditivity should be a persistent feature of colloidal systems associated with the presence of small residual interactions that cannot be modelled through a hard-sphere potential and it is expected to have a very pronounced effect on the phase behavior louis . For instance, assuming that is the radius of gyration of a nonadsorbing polymer, experiments on colloid-polymer mixtures indicate that a fluid-fluid demixing transition develops for lekker , while no fluid-fluid demixing has been reported in literature for additive hard-sphere (AHS) mixtures such size ratios dijk1 . Another class of colloidal systems for which nonadditivity effects can be profitably introduced includes surfactants; in fact, nonadditive interactions between hard-chain models of surfactants and the solvent allow to study more efficiently common self-assembly mechanisms as, for instance, micelle or reverse micelle formation and double layer structures abu . Finally, deviations from the usual Lorentz-Berthelot mixing rules are observed also in rare-gas mixtures rowli , expecially in extreme thermodynamic regimes barrat . For instance, nonadditivities lower than can be used to model -rare gas mixtures, in order to account for the extra-attractive interactions between hydrogen molecules, due to electron exchange at very high pressures vanderberg .
In general, the depletion effect in AHS mixtures is stronger for smaller size ratios while nonadditivity is expected to enhance the homocoordination more efficiently when the two species become more similar. The competition between these two different mechanisms, in the fulfilement of the conditions of maximum entropy, suggests that for intermediate size ratios even a small amount of nonadditivity can lead to a thermodynamically stable phase separation. This picture is confirmed on the microscopic side: in fact, the range of the effective depletion potential for the large spheres becomes very small for large size-asymmetries (being of the order of magnitude of the diameter of the small spheres) and the correlation-induced repulsive barrier becomes wider for small size-asymmetries louis ; louis2 . Obviously, these two effects favour the metastability of liquid-vapor equilibrium, that can be mapped onto the fluid-fluid equilibrium of the mixture as, we shall see later on; if we consider that, on increasing , the attractive well of the effective potential becomes deeper while the repulsive barrier remains roughly the same, we conclude again that the optimal conditions to stabilize a FFPS with a small amount of nonadditivity could be met for intermediate size-asymmetries.
Recently, Lo Verso and coworkers employed the effective potentials previously obtained by other authors to investigate the phase diagram of very asymmetric nonadditive mixture by means of the hierarchical reference theory loverso . However, there is little and definitely not exaustive information about the fluid-fluid phase stability of nonadditive hard-sphere (NAHS) mixtures in the range of relatively small (y ) to intermediate (y ) size-asymmetries. Moreover, there is a strong evidence that a stable FFPS cannot be achieved with a small amount of nonadditivity for large size-asymmetries. For instance, Louis and coworkers louis2 found that should be for y= in order to stabilize the FFPS. This happenstance should persist also for larger size-asymmetries because the gap of packing fractions between the critical point and the freezing line remains almost unchanged up to y= for AHS mixtures dijk1 .
Altough the qualitative phase behavior of hard-sphere mixtures is known, a few investigations have been carried out by means of integral-equation approaches. In this paper we study the phase diagram of NAHS mixtures for size ratios y=,,,, and for nonadditivities . We build the FFPS curves according to the following procedures: We perform extensive modified-hypernetted chain (MHNC) mhnc and Roger-Young (RY) ry Gibbs free energy calculations on the full mixture. We also build the FFPS curve by exploiting a first-order perturbation theory hansen in a crude representation of the effective depletion potential for the larger spheres in contact with a reservoir of small spheres at a packing fraction . The resulting potential was obtained in the framework of the Derjaguin approximation by Gotzelmann and coworkers gotz for AHS mixtures and extended to the nonadditive case by Louis and coworkers louis . Then, we map the liquid-vapor phase diagram of the effective depletion potential onto the fluid-fluid phase diagram of the binary mixture according to an explicit conversion formula, based on Rosenfeld’s fundamental measure density-functional theory (DFT) rosen , between - the packing fraction of the small spheres of the system - and the packing fraction in the reservoir roth . Similarly, the calculation of the freezing line is performed by mapping the freezing line of the effective potential onto the freezing line of the binary mixture.
The paper is organized as follows: In Section II, we present the models and the theoretical procedures, while in Section III we show the results for the phase diagrams for different size ratios. Finally, we give some concluding remarks in Section IV.
II Model and methods
We consider a binary system of particles interacting through the pair potential
| (1) |
where is the diameter of the i-th species, and . The mixture can be described by the size ratio , by the partial and total number density of particles and , respectively, and by the mole fraction of species , .
The Ornstein-Zernike (OZ) equations report for the homogeneous mixture are:
| (2) |
where and are the pair correlation and the direct correlation function, respectively.
We solved the OZ equations under the MHNC closure mhnc , based on the exact relationship obtained through cluster expansion techniques:
| (3) |
We approximated the bridge functions with their Percus-Yevick py counterparts for hard sphere mixtures, . The parameters are used to ensure thermodynamic self-consistency.
We also solved the OZ equation in the RY ry approximation:
| (4) |
where and the quantities are adjusted in such a way so to satisfy the thermodynamic consistency of the theory.
In order to ensure the internal thermodynamic consistency of the theories we equated the two osmotic compressibilities evaluated by differentiating the virial pressure hansen ; report
| (5) |
where and is the Boltzmann costant, and the compressibilities resulting from the fluctuation theory report :
| (6) |
where is the Fourier transform of and .
We considered at least thirty mole fraction values and evaluated the total Gibbs free energy from the excess Helmholtz free energy per particle, that was obtained by integrating the excess part of the virial pressure (Eq. (5)) as a function of the total density of the mixture. We obtained the excess contribution to the Gibbs free energy hansen ; bijor as:
| (7) |
then, we calculated the total Gibbs free energy by adding the ideal part (we omit the kinetic part associated with the de Broglie wavelength)
| (8) |
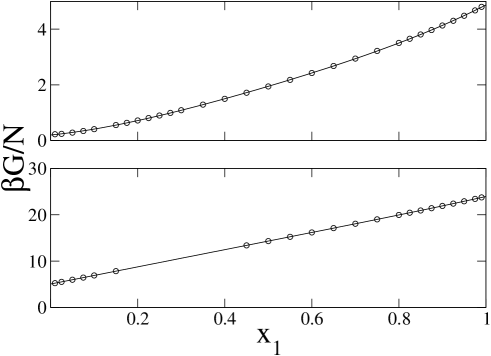
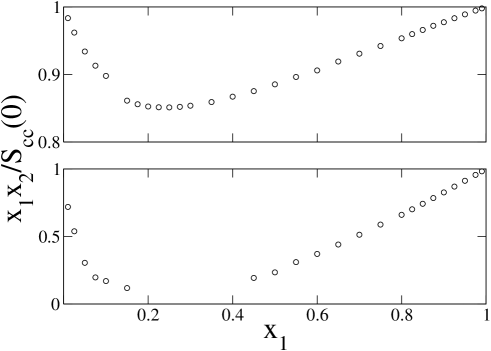
where . The Gibbs free energy was interpolated for each mole fraction with cubic splines, and these fits were used to determine the Gibbs free energy at costant pressure. Finally, the FFPS was obtained by applying the construction of the common tangent to this latter quantity. By numerical inspection we found that the Gibbs free energy plotted as a function of the concentration at constant pressure can be interpolated by a quartic polynomial. On the other hand, for pressures greater than the critical one, the Gibbs free energy turns out to be sampled just on a limited number of state points. This drawback is due to the loss of stability in proximity of the fluid-fluid spinodal of the numerical alghoritm used to solve integral equation theories gillan . Polynomial fits of a small number of data may bias the estimate of the FFPS; however, we noted that the mixture separates into two different equilibrium compositions when the discriminant of the second-order equation (the second derivative of the Gibbs free energy) attains a value greater than zero. Thus, in order to guarantee the safety of the overall procedure, we monitored the trend of the discriminant as a function of the total pressure from negative values (at which the Gibbs free energy is fully sampled on a grid of 30 points because there is no phase coexistence) up to positive values. We trusted the calculation of the coexistence concentrations in the pressure range where the discriminant varies without manifest discontinuities; in fact, jumps of the discriminant plotted as a function of the pressure are trivially related to a bias introduced by the poor sampling of the Gibbs free energy. We show in Figure 1 the typical shape of the Gibbs free energy for and , corresponding to a subcritical pressure (see upper panel) and to a supercritical pressure (see lower panel). In Figure 2 we report, for the same pressures, the inverse ratio between the concentration-concentration structure factor at zero wave vector and the corresponding value for an ideal mixture, a quantity that provides a measure of how much the numerical procedure allows one to to approach the fluid-fluid spinodal.
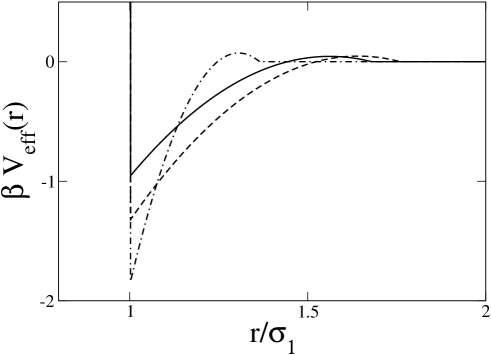
The FFPS was also calculated according to the following procedure: We considered a simple form of the depletion potential for the larger spheres in contact with a reservoir of small spheres with packing fraction louis2 ; gotz :
where the effective size ratio is:
while . The one-component potential of interaction is shown in Figure 3 for some different parameters. Dijkstra and coworkers dijk1 have shown that this simple form for the effective interaction between larger spheres is reliable also on approaching =. We built the liquid-vapor phase diagram of the depletion potential by means of a first-order thermodynamic perturbation theory (see Refs. louis ; costa for details) by equating the chemical potentials of the two phases at the same pressure. Then, the reservoir packing fraction was converted into the packing fraction of the smaller spheres in the real mixture by means of the relation:
| (9) | |||||
so that the liquid-vapor phase coexistence can be mapped onto the FFPS for the mixture. This relation has been successfully tested against simulation results in the grand-canonical ensemble by other authors roth .
As far as the freezing line is concerned, while in the considered range of size-asimmetries ( between and ) no substitutionally disordered crystals are expected to be thermodynamically stable, superlattice structures can be found for additive mixtures with stoichometric compositions (, ) when cottin ; hunt . However, the determination of the phase stability of a binary superlattice depends on three variables, i.e. the size ratio , the total packing fraction , and the mole fraction of one of two species, say . This calculation represents a formidable task. The situation is even worse for NAHS mixtures because of the additional variable . On the other hand, it has been conjectured louis2 that, at least for sufficiently small values of and for moderate densities, the larger spheres might form a face-centered cubic (FCC) lattice permeated by a fluid of small spheres; thus, in the present paper we limited our investigation to the determination of the freezing line to this crystalline simmetry. Again, we resorted to a first-order perturbation theory applied to the effective depletion potential in order to determine the chemical potentials both in the fluid and in the solid phase louis . Once the freezing line for the effective potential is determined, by equating the chemical potentials at costant pressure, the freezing line of the full mixture can be reconstructed by means of Eq. (9).
III Results and discussion
We start our analysis of the results obtained for the largest size ratio considered, i.e., . The FFPS curves calculated from integral equation theories for (see full and dotted line of the left panel of Figure 4) turned out to be in good agreement between each other. The critical points were located in the region between the two branches of coexisting phases, where no curve was reported in the figure because of numerical problems arising from the proximity of the critical point. In general, we found a good agreement between RY and MHNC estimates of the critical parameters of the FFPS also for all the other case-studies considered in this work (see Table 1). Moreover, we found that the locus of points where the residual multi-particle entropy vanishes for saija , resembling the spinodal curve, is congruent with the FFPS curves obtained in this work with Gibbs free energy calculations. The freezing line (see the dash-dotted line) was located below the critical points, so that these FFPSs are thermodynamically metastable. The FFPS calculated from the depletion potential (see dotted line) was in qualitative agreement with the FFPS calculated from integral equation theories; in fact, the FFPS estimated from the depletion potential was metastable with respect to the freezing transition as well, because its critical parameters fall above the freezing line. It is worth noting that Louis and coworkers louis found a good agreement between the first-order perturbation theory and the computer simulation as applied to the description of the fluid-solid equilibrium, with a slight tendency of the theoretical freezing line to underestimate the simulation one; this drawback of the perturbation theory suggests that, in principle, it could be possible to have a stable fluid-fluid critical point even for a value as low as ; this is particularly true for the size ratio because the gap of packing fractions between the FFPS critical point and the freezing line turned out to be lower, as we shall see later on.
A better agreement between the critical parameters calculated through integral equation theories and the perturbation theory was found for the largest nonadditivity (see the right panel reported in Figure 4). Upon doubling the nonadditivity parameter from to , the critical concentration only slightly changed. More interestingly, all the theoretical critical parameters fall below the freezing line (see dash-dotted line), so that all the predicted FFPS were thermodynamically stable with respect to the freezing transition for .
The phase diagrams obtained for size ratios and , which are reported in Figures 5 and 6, respectively, are particularly meaningful for Helium-Xenon mixtures at high pressure. In fact, some authors barrat estimate that the size ratio for such systems could lie between and , depending on the choice of the distance of impenetrability of the atoms. For some discrepancies between the FFPS curves calculated within the two integral equation theories (IETs) emerged, but the critical parameters turned out to be very similar (see Table 1). The FFPS critical parameters calculated from the depletion potential (see dotted line of Figure 5 and 6) were in fairly good agreement with the integral equation results.
For all the theoretical results suggested that the FFPS become thermodynamically stable, as already observed for the case . However, the trend observed starting from up to for , suggested that a size ratio close to could constitute a lower bound for the thermodynamic stability of the fluid-fluid phase separation; in fact, the gap of packing fractions between the FFPS critical point and the freezing line at the critical concentration shrank in passing from to and became very narrow for this latter size ratio. We experienced some difficulties in estimating the FFPS in the framework of the IETs for , , so that the critical parameters are affected by a large error, as illustrated in Table 1.
The smallest size ratio considered in this paper, i.e., , confirmed the observation that the FFPS curves for were thermodynamically stable for intermediate size ratios. We did not succeed in obtaining a satisfactory sampling of the Gibbs free energy within IETs approaches for this size ratio because of convergence problems of the numerical algorithm; thus, we just show the results obtained within the perturbation theory applied to the depletion potential. As shown in Figure 7, the FFPS critical points were located above the freezing line for both (see dotted and dot-dashed line of the left panel) and (see right panel). We concluded that fluid-fluid phase separation is metastable with respect to the freezing transition for nonadditive parameters lower than .
IV Concluding remarks
In this paper we calculated the fluid-fluid phase separation equilibrium conditions of a nonadditive hard sphere mixture for a wide range of size ratios and for two, slightly nonadditive repulsive interactions. To estimate the coexistence lines we evaluated the Gibbs free energy within the frameworks provided by the modified-hypernetted-chain and the Rogers-Young integral-equation closures of the Ornstein-Zernike equations. An alternative approach to the phase diagram may be based on the use of zero-separation theorems to obtain directly the chemical potentials lee . This method to improve the performance of integral equations has been recently shown to be able to reproduce with good accuracy the phase diagram of nonadditive hard sphere mixtures in random pores pellicane . Furthermore, the use of zero-separation theorems considerably lowers the computational effort when integral-equation theories are solved in the framework of constant-pressure calculations pastore . On the other hand, the application of zero-separation theorems turns out to be feasible provided that an appropriate closure of the Ornstein-Zernike equations, such as the modified-Verlet one, is adopted.
The modified-hypernetted-chain and the Rogers-Young coexistence curves have been compared with the coexistence results obtained through a first-order perturbation theory applied to the effective depletion interaction between the larger spheres. The thermodynamic stability of fluid-fluid phase separation with respect to freezing has been tested as well. We found a quantitative matching between the modified-hypernetted-chain and the Rogers-Young estimates for all the case studies considered here. As far as the comparison between the integral equation theories and thermodynamical perturbation theory coexistence curves is concerned, the agreement is only qualitative. However, both methods suggest that an amount of nonadditivity as small as can be enough, for intermediate size ratios, to drive the fluid-fluid critical point into the thermodinamically stable region of the phase diagram. The approach presented in this paper to study the phase diagram of a nonadditive hard-sphere mixture can be easily extended to more realistic, nonadditive models of He–rare-gas mixtures in extreme conditions of temperature and pressure, such as mixtures of particles interacting through modified Buckingam potentials barrat . Calculations in this direction are in progress.
References
- (1) Dijkstra, M.; van Roij, R.; Evans, R. Phys. Rev. E 1999, 59, 5744.
- (2) Dijkstra, M. Phys. Rev. E 1998, 58, 7523.
- (3) Louis, A. A.; Finken R.; Hansen, J. P. Phys. Rev. E 2000, 61, R1028.
- (4) Lekkerkerker, H. N. W.; Stroobants, A. Physica A 1993, 195, 387.
- (5) Abu-Sharkh, B. F.; Hamad, E. Z. Langmuir, 2004, 20, 254.
- (6) Rowlinson, J. S. Liquids and Liquid Mixtures, Butterworth, London 1969.
- (7) Barrat, J. L.; Vos, W. L. J. Chem. Phys., 1992, 97, 5707.
- (8) van den Bergh, L. C.; Schouten, J. A.; Trappeniers, N. J. Physica A 1987, 141, 524.
- (9) Lo Verso, F; Pini, D.; Reatto, L. J. Phys.: Condens. Matter 2005, 17, 771.
- (10) Louis, A. A.; Roth, R. J. Phys.: Condens. Matter 2001, 13, L777.
- (11) Rosenfeld, Y.; Ashcroft, N. W. Phys. Rev. A 1979, 20, 1208.
- (12) Rogers, F. J.; Young, D. A. Phys. Rev. A 1984, 30, 999.
- (13) Hansen, J. P.; McDonald, I. R. Theory of simple liquids Academic Press, London, 1976.
- (14) Gotzelmann, B.; Evans, R.; Dietrich, S. Phys. Rev. E bf 1998, 57, 6785.
- (15) Roth, R; Evans, R.; Louis, A. A. Phys. Rev. E 2001, 64, 051202.
- (16) Rosenfeld, Y. Phys. Rev. Lett. 1989, 63, 980.
- (17) Caccamo, C. Phys. Rep. 1996, 274, 1.
- (18) Lebowitz, J. L. Phys. Rev. 1964, 133, A895.
- (19) Bjorling, M.; Pellicane G.; Caccamo, C. J. Chem. Phys. 1999, 111, 6884
- (20) Gillan, M. J. Mol. Phys. 1979, 38, 1781.
- (21) Costa, D.; Pellicane, G.; Caccamo, C.; Scholl-Paschinger, E.; Kahl, G. Phys. Rev. E 2003, 68, 021104.
- (22) Cottin, X.; Monson, P. A. J. Chem. Phys. 1995, 102, 3254.
- (23) P. Bartlett, P.; R. H. Ottewill, R. H.; P. N. Pusey, P. N. Phys. Rev. Lett. 1992, 68, 3801; Hunt, N.; Jadine, R.; Bartlett, P. Phys. Rev. E 2000, 62, 900.
- (24) Saija, F.; Giaquinta P. V. J. Phys. Chem. B 2002, 106, 2035.
- (25) Lee, L.L. J. Chem. Phys. (1992), 97, 8606.
- (26) Pellicane G., Caccamo C., Wilson D.S. and Lee L.L. Phys. Rev. E (2004), 69, 061202.
- (27) Pastore G., Santin R., Taraphder S. and Colonna F. J. Chem. Phys. (2005), 122, 181104.
| IETs | 0.41 | 0.43 | 0.27 | 0.15 | ||||
| 0.05 | ||||||||
| PT | 0.42 | 0.55 | 0.31 | 0.1 | ||||
| 0.75 | ||||||||
| IETs | 0.30 | 0.44 | 0.20 | 0.10 | ||||
| 0.1 | ||||||||
| PT | 0.30 | 0.52 | 0.22 | 0.09 | ||||
| IETs | 0.43 | 0.39 | 0.33 | 0.11 | ||||
| 0.05 | ||||||||
| PT | 0.42 | 0.43 | 0.35 | 0.08 | ||||
| 0.6 | ||||||||
| IETs | 0.32 | 0.41 | 0.25 | 0.07 | ||||
| 0.1 | ||||||||
| PT | 0.29 | 0.32 | 0.2 | 0.1 | ||||
| IETs | 0.46 | 0.34 | 0.37 | 0.09 | ||||
| 0.05 | ||||||||
| PT | 0.43 | 0.32 | 0.35 | 0.09 | ||||
| 0.5 | ||||||||
| IETs | 0.33 (3) | 0.34 (9) | 0.28 (4) | 0.06 (2) | ||||
| 0.1 | ||||||||
| PT | 0.32 | 0.26 | 0.23 | 0.08 |