Critical microwave-conductivity fluctuations across the phase diagram of superconducting La2-xSrxCuO4 thin films
Abstract
We report a systematic study of the dynamic microwave conductivity near for La2-xSrxCuO4 (LSCO) thin films with =0.07 to 0.16. The strong frequency dependence of the phase stiffness together with scaling analysis of the ac fluctuating conductivity of superconductivity provide direct evidence for the 2D- behavior of nearly decoupled CuO2 planes in underdoped LSCO (=0.07 and 0.12). On the other hand, the critical exponents for slightly overdoped LSCO (=0.16) were found to agree with those for the relaxational 3D- model, indicating that the universality class in LSCO is changed by hole doping. The implication of these results for the phase diagram of high- cuprates is discussed.
pacs:
74.25.Nf, 74.40.+k, 74.72.Dn, 74.78.BzOne of the hallmarks of the high- cuprates is the large thermal fluctuation of the superconducting order enhanced by the short coherence length and the quasi two-dimensionality, which enables the exploration of the fluctuation-dominated critical regime very close to FFH91 . Although numerous measurements, such as the ac conductivity Kamal94etc , the dc magnetization Li , the specific heat specific_heat , and the - curves Strachan01 , have been performed to investigate the critical fluctuation, there has been no consensus among the results. This is surprising because the critical phenomena were considered to be universal, independent of the microscopic details ChakinTextbook . However, if many assumptions were made implicitly to determine the universality class of the phase transition from the data, the obtained results are not convincing unless the validity of such assumptions is confirmed. Thus, one should develop a more reliable method which does not require any extra assumptions. To our knowledge, the most successful method is dynamic scaling analysis of the ac complex conductivity, , as will be discussed later.
Another fascinating hallmark of the high- cuprates is that the physical properties change with hole doping. In particular, an understanding of the phase diagram as a plot of versus the hole concentration has been a central issue in the physics of high- cuprates. Interestingly, some recent models, which start from the quantum criticality for competing orders underlying the phase diagram of high- cuprates, provide another possible explanation for the critical fluctuations in high- cuprates. That is, the critical fluctuations change with hole doping, because of the existence of a quantum critical point (QCP) Sachedev00 . These models suggest that the critical dynamics should be investigated as a function of hole doping. Thus, it can be expected that such a systematic study across the phase diagram will not only resolve the disagreements among earlier studies but will also provide important information to understand the phase diagram of high- cuprates.
In this paper, we report a systematic study of as a function of the swept-frequency (0.1 GHz to 12 GHz) for high-quality La2-xSrxCuO4 (LSCO) thin films with a wide range of hole concentrations (=0.07 to 0.16). For underdoped (UD) LSCO, we show clear evidence for the 2D- critical fluctuation of nearly decoupled CuO2 planes. With increasing hole doping, a dimensional crossover from 2D- behavior to 3D- behavior was observed near =0.16, implying that there are at least two universality classes in the phase diagram of LSCO.
| (nm) | (mcm) | (K) | (K) | (K) | |
|---|---|---|---|---|---|
| 0.07 | 460 | 0.77 | 19.0 | 20.83 | 32 |
| 0.12 | 230 | 0.28 | 33.65 | 36.08 | 38 |
| 0.14 | 270 | 0.14 | 38.92 | 39.29 | 40 |
| 0.16 | 140 | 0.12 | 35.5 | 35.82 | — |
Epitaxial LSCO thin films with =0.07, 0.12 (underdoped), 0.14 (nearly optimally doped), and 0.16 (overdoped) were grown on LaSrAlO4 (001) substrates by a pulsed laser deposition technique using pure ozone Tsukada04 . All the films are highly -axis oriented with a sufficiently narrow rocking curve of the 002 reflection (typically 0.2∘). As shown in Table I, the value of the in-plane dc resistivity, , was found to agree with the reported best value for LSCO thin films Sato97 within a factor of 2, confirming that the films used in this study are of sufficiently high quality to investigate the critical dynamics near .
There are three reasons for using LSCO films on LaSrAlO4 (LSAO) substrates in this study: (1) LSCO is an ideal system with a simple layered structure, where the hole concentration can be widely controlled. (2) The compressive epitaxial strain gives rise to a moderate increase of Sato97 . (3) The tetragonal symmetry of LSAO substrate supports the fabrication of CuO2 planes with ideal flat square lattices, free from disorders due to corrugations and twin boundaries Tsukada04 .
Both the real and imaginary parts of were obtained from the complex reflection coefficient, , using a non-resonant broadband technique Kitano04 . When the film thickness, , is sufficiently less than the skin depth, , one can write , as follows,
| (1) |
where =377 is the impedance of free space. In practice, before applying Eq. (1), systematic errors involved in were carefully removed by calibration measurements using known standards Kitano04 .
In order to obtain reliable data, the effect of the dielectric substrate needs to be considered. Note that the choice of according to values of is important, because a resonance peak attributed to the effect of substrate can be induced for a very small value of Silva96 . In fact, a sharp resonance peak has been observed near 8 GHz for the LSCO film (=0.07) above 100 K Kitano04 . However, in the data presented in Fig. 1, no peak was observed over the whole frequency range measured at lower temperatures near . Thus, we can conclude that the effect of substrate was negligible near .
Moreover, in the vicinity of , we found that was seriously affected by a small unexpected difference (typically, 0.2∘-0.3∘ at 1 GHz) between the phase of for a load standard, , and that for a short standard, . This difficulty was resolved by using the measured of the sample at a temperature far above as the load standard, assuming that at this temperature, and that both were -independent in the vicinity of . The validity of this procedure was also confirmed by the same measurements for NbN thin films as a reference OhashiNbN .
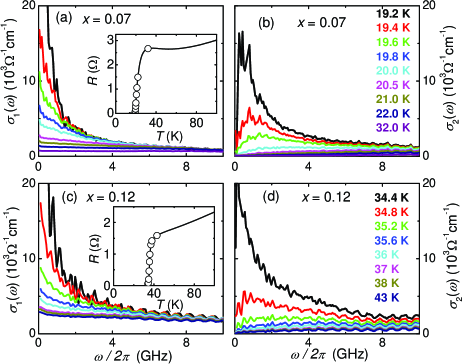
Figure 1 shows the frequency dependence of , obtained by the above procedures, for underdoped LSCO (=0.07 and 0.12) at several temperatures above . It is evident that both and diverge rapidly with decreasing temperature in the low frequency limit, suggesting that the excess conductivity is due to the superconducting fluctuations. A similar divergence in was also observed in the vicinity of for the other LSCO films.
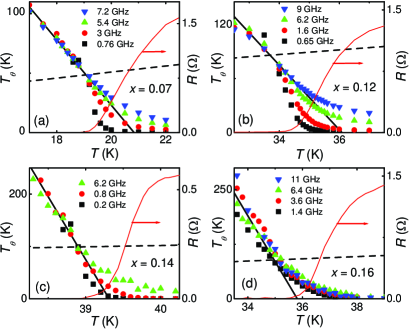
It has been argued EK95 that strong phase fluctuations are important for the determination of in the UD region, because the phase-stiffness energy, , is suppressed largely by the small superfluid density, where is the effective thickness of a superfluid. Figure 2 shows the phase-stiffness temperature estimated from at several frequencies. Surprisingly, we found that for the UD samples (=0.07 and 0.12) started to show frequency dependence above a certain temperature, , while was almost -independent below . In addition, the resistive (), where became zero, was also close to rather than another critical temperature, , where the bare phase stiffness in the model would go to zero. When we assumed to be approximately , we saw that a dashed straight line with a slope of crossed at , indicating that agrees with the Berezinskii-Kosterlitz-Thouless (BKT) transition temperature, , in the 2D- model KT ; KT2 .
As shown in Figs. 2(c) and 2(d), this behavior was observed even for =0.14, while it disappeared almost completely for =0.16. for =0.16 was close to rather than , suggesting that the mean field critical temperature is close to . Thus, our results were qualitatively similar to the prediction of Emery and Kivelson EK95 in the sense that is bounded by (UD region) or (overdoped region), although the estimation of in the UD region was considerably different, as will be discussed later.
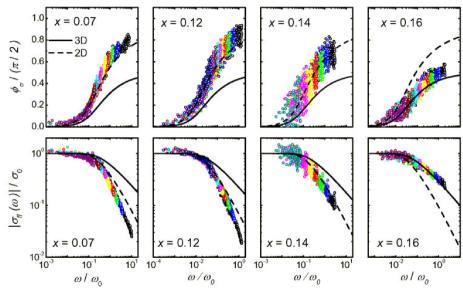
In the dynamic scaling analysis of the fluctuating complex conductivity, , which was pioneered by Booth et al. Kamal94etc , both the magnitude, , and the phase, , of are used as scaled quantities. The advantage of this method is that the data collapse to a single curve as a function of a reduced frequency, , can be achieved without assuming any relationship between two scaling parameters, and , in contrast to other scaling analyses Li ; specific_heat ; Strachan01 . Note that and are obtained independently in our analysis. Thus, we can begin by checking the following hypothesis of the dynamic scaling theory FFH91 ,
| (2) |
where is a complex universal scaling function, is a correlation length which diverges at , is a dynamic critical exponent, and is an effective spatial dimension. Figure 3 shows that both and were scaled successfully over a wide range of frequencies for all the films, confirming that the critical dynamics suggested by Eq. (2) were indeed observed. The comparison of the experimentally obtained scaling functions with the Gaussian forms calculated by Schmidt Schmidt suggested that the 2D Gaussian-like behavior in the UD region changed into the 3D Gaussian-like behavior near =0.16.
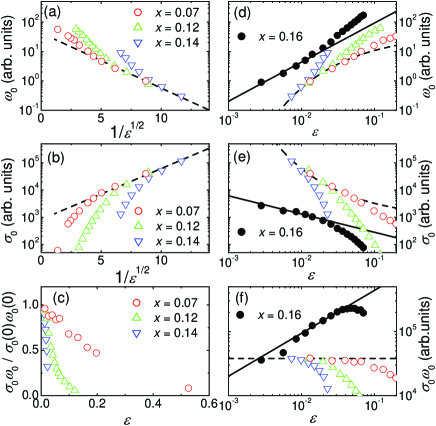
Equation (2) suggests that both and behave as functions of in a critical region, where and . According to the BKT theory KT ; KT2 , diverges with in the critical region, , where and is a numerical constant. Note that for the relaxational 2D system with =2 FFH91 . In fact, we confirmed that both and for =0.07 showed the same exponential singularity as with =0.215 in the range of from 0.01 to 0.1, as shown in Figs. 4(a) and 4(b). With increasing up to 0.14, we found that the range of where (or ) agreed with became narrower and shifted to lower temperatures. Such behaviors were also consistent with the BKT theory KT2 , since (or ) is rather dominated by free vortices than at higher temperatures, due to a screening effect by thermally activated free vortices.
In the BKT theory, gives in the high-frequency limit, , which is sensitive to the surviving bound pairs of vortices above KT2 . As shown in Fig. 4(c), we found that decreased with increasing more quickly at larger . This suggests that the temperature region of the prominent phase fluctuation became narrower with hole doping, in contrast to a recent Nernst experimentNernst which showed a steeper increase of the onset temperature of the Nernst effect than with increasing hole doping. When we roughly estimated , based on an expectation that 0 at , we found that was too small to cover the pseudogap region, as was previously reported by Corson et al. Kamal94etc . These results strongly suggested that most of the anomalous Nernst signal should be attributed to other origins than the superconducting fluctuation, as was suggested by some recent theoretical works Honerkamp .
Moreover, the observed reduction of due to the phase fluctuation ( 0.7, 0.9 for =0.07, 0.12, respectively) corresponded to the superconducting film with a very high sheet resistance (3-5 k) Beasley79 . Using a relation =, we found that 10 Å. Thus, each of the CuO2 planes seemed to be decoupled FFH91 ; Hikami80 . Note that the screening length for each superconducting sheet, , where is a bulk penetration depth, was larger than 10 mm in this case, which satisfied the BKT criterion that , where is the sample size. In addition, is given by a sum of the decoupled superconducting layers with the thickness of . Thus, will be smaller than , as we assumed in the estimation of shown in Fig. 2.
We found that the critical behavior for =0.16 was very different from that for =0.07-0.14, as shown in Figs. 4(d) to 4(f). In particular, the dimensionality of = 0.16 was found to be three, in contrast to the 2D- behavior of = 0.07-0.14, as shown by the plots of ) in Fig. 4(f), where is a static critical exponent. We also confirmed that the critical exponents for =0.16 agreed very well with those for the relaxational 3D- model with 0.67, 2, and =3 Wickham00 . These results clearly suggest that the universality class in the pahse diagram of LSCO changes from 2D- to 3D- with hole doping.
What is the origin of the dimensional crossover from 2D- to 3D- ? One of candidates is the increase of the interlayer coupling (probably Josephson coupling) with hole doping FFH91 ; Hikami80 . However, this effect seems to appear more gradually with hole doping, in contrast to the different behavior between =0.14 and 0.16 shown in Figs. 3 and 4(f). Another candidate is the effect of the quantum critical fluctuation near QCP. In this case, the 2D-3D crossover can be regarded as the classical-to-quantum crossover near QCP Sachedev00 . A detailed study for further overdoped LSCO is needed to settle this issue.
Finally, we emphasize that all the above results rule out the possibility of the distribution of due to disorders in the sample. If there is a broad distribution of in the sample, will be greatly suppressed, leading to a smaller , and the dynamic scaling of and will fail below a certain temperature, suggesting that is higher than . In fact, these features have been observed for NbN films with a non-negligible distribution of OhashiNbN , while all of the four LSCO films used for this study did not show them, as shown in Figs. 2 to 4.
In conclusion, a systematic study of the critical dynamics of for LSCO thin films with =0.07 to 0.16 has been performed for the first time. All the results clearly provide evidence for the BKT transition in the nearly decoupled CuO2 layers of underdoped LSCO. With increasing hole doping, the 2D- behavior in the UD region changes into the 3D- behavior near =0.16, indicating that the universality class in the phase diagram of LSCO is changed by hole doping.
We thank Y. Kato, H. Fukuyama and W. N. Hardy for fruitful discussions and comments, S. Anlage and A. Schwartz for technical advice at the early stages of this study, D. G. Steel and K. Gomez for useful comments on the manuscript. This work was partly supported by the Grant-in-Aid for Scientific Research (13750005, 14340101 and 15760003) from the Ministry of Education, Science, Sports and Culture of Japan.
References
- (1) D. S. Fisher, M. P. A. Fisher, and D. A. Huse, Phys. Rev. B 43, 130 (1991).
- (2) For example, S. Kamal et al., Phys. Rev. Lett. 73, 1845 (1994); S. Anlage et al., Phys. Rev. B 53, 2792 (1996); J. C. Booth et al., Phys. Rev. Lett. 77, 4438 (1996); J. Corson et al., Nature 398, 221 (1999); J. R. Waldram et al., Phys. Rev. B 59, 1528 (1999); K. M. Paget et al., Phys. Rev. B 59, 6545 (1999).
- (3) For a review, Q. Li, in Physical Properties of High Temperature Superconductors V, edited by D. M. Ginsberg, (World Scientific, Singapore, 1996), p.209.
- (4) For example, A. Junod et al., Physica B 280, 214 (2000); M. V. Ramallo and F. Vidal, Phys. Rev. B 59, 4475 (1999), and references therein.
- (5) For example, D. R. Strachan et al., Phys. Rev. B 67, 174517 (2003) and references therein.
- (6) P. M. Chakin and T. C. Lubensky, Principles of condensed matter physics (Cambridge Univ. Press, UK, 1995).
- (7) S. Sachedev, Science 288, 475 (2000); M. Vojta, Rep. Prog. Phys. 66, 2069 (2003).
- (8) I. Tsukada, Phys. Rev. B 70, 174520 (2004).
- (9) H. Sato et al., Phys. Rev. B 61, 12447 (2000).
- (10) H. Kitano et al., Physica C 412-414, 130 (2004).
- (11) E. Silva et al., Supercond. Sci. Technol. 9, 934 (1996).
- (12) T. Ohashi et al., submitted.
- (13) V. J. Emery and S. A. Kivelson, Nature 374, 434 (1995).
- (14) V. L. Berezinskii, Sov. Phys. JETP 32, 493 (1970); J. M. Kosterlitz and D. J. Thouless, J. Phys. C 6, 1181 (1973).
- (15) B. I. Halperin and D. R. Nelson, J. Low Temp. Phys. 36, 599 (1979); V. Ambegaokar et al., Phys. Rev. B 21, 1806 (1980).
- (16) H. Schmidt, Z. Phys. 216, 336 (1968).
- (17) N. P. Ong and Y. Wang, Physica C 408-410, 11 (2004).
- (18) H. Kontani, Phys. Rev. Lett. 89, 237003 (2002); C. Honerkamp and P. A. Lee, Phys. Rev. Lett. 92, 177002 (2004).
- (19) M. R. Beasley et al., Phys. Rev. Lett. 42, 1165 (1979).
- (20) S. Hikami and T. Tsuneto, Prog. Theor. Phys. 63, 387 (1980).
- (21) R. Wickham and A. Dorsey, Phys. Rev. B 61, 6945 (2000).