Mechanisms in the size segregation of a binary granular mixture
Abstract
A granular mixture of particles of two sizes that is shaken vertically will in most cases segregate. If the larger particles accumulate at the top of the sample, this is called the Brazil-nut effect (BNE); if they accumulate at the bottom, the reverse Brazil-nut effect (RBNE). While this process is of great industrial importance in the handling of bulk solids, it is not well understood. In recent years ten different mechanisms have been suggested to explain when each type of segregation is observed. However, the dependence of the mechanisms on driving conditions and material parameters and hence their relative importance is largely unknown. In this paper we present experiments and simulations where both types of particles are made from the same material and shaken under low air pressure, which reduces the number of mechanisms to be considered to seven. We observe both BNE and RBNE by varying systematically the driving frequency and amplitude, diameter ratio, ratio of total volume of small to large particles, and overall sample volume. All our results can be explained by a combination of three mechanisms: a geometrical mechanism called void filling, transport of particles in sidewall-driven convection rolls, and thermal diffusion, a mechanism predicted by kinetic theory.
pacs:
45.70.Mg, 05.20.DdI Introduction
A variety of mechanisms have been proposed to describe the separation of particles of two sizes in a mixture of vertically shaken particles. Section II discusses proposed mechanisms, including void filling, static compressive force, convection, condensation, thermal diffusion, non-equipartition of energy, interstitial gas forcing, friction, and buoyancy. Our aim is to determine which are the important segregation mechanisms for diverse conditions.
We study a mixture of two sizes of brass spheres, using image analysis to count the number of large particles visible at the top and bottom surfaces of the sample after shaking. These results are then compared with molecular dynamics simulations, which yield quantities unaccessible in experiment. Comparing our results for a range of control parameters with various proposed segregation mechanisms reveals which mechanisms are important in our system. The control parameters studied are: frequency and amplitude of the sinusoidal shaking, the diameter ratio of the spheres (the subscripts L and S refer to large and small particles), the total layer depth , and , the ratio of the total volume of large to small particles in the container. The last parameter has not been examined in previous experiments, which were either performed with about equal numbers of particles of each size Olsen and Rippie (1964); Faiman and Rippie (1965); Hsiau and Yu (1997); Brone and Muzzio (1997); Burtally et al. (2002); Breu et al. (2003), or in the case called the intruder limit, where there is one large sphere in a bed of smaller particles Williams (1963); Duran et al. (1993, 1994); Knight et al. (1993, 1996); Cooke et al. (1996); Vanel et al. (1997); Shinbrot and Muzzio (1998); Liffman et al. (2001); Fernando and Wassgren (2003); Nahmad-Molinari et al. (2003); Huerta and Ruiz-Suárez (2004a); Yan et al. (2003); Möbius et al. (2001, 2004, 2005); Huerta et al. (2005).
This paper is organized as follows: different proposed segregation mechanisms are reviewed in Sec. II. Section III discusses the interplay of these mechanisms in two recent models Hong et al. (2001); Trujillo et al. (2003). The experimental setup and the details of our simulation are described in Sec. IV. Section V discusses how the experimental and simulation results depend on the driving parameters, and Sec. VI discusses the dependence on , and . We conclude in Sec. VII.
II Segregation Mechanisms
To reduce the number of segregation mechanisms to be considered we use large and small particles of the same material (brass) and therefore the same density and mechanical properties. This excludes segregation effects due to Archimedean buoyancy Shishodia and Wassgren (2001); Trujillo et al. (2003); Huerta and Ruiz-Suárez (2004a); Bose et al. (2005); Ciamarra et al. (2005); Huerta et al. (2005) or due to different frictional properties Srebro and Levine (2003); Ciamarra et al. (2005). As the interstitial fluid was also found to have a strong effect on segregation Burtally et al. (2002); Biswas et al. (2003); Yan et al. (2003); Möbius et al. (2001, 2004, 2005), we reduced the pressure in our experiment to less than 8 Pa, well below the 130 Pa where the effect of air on the segregation vanishes Möbius et al. (2004). This step also assures comparability with our molecular dynamics simulations where the only interactions between particles are collisions. The remaining seven mechanisms are reviewed below, and their predicted dependence on , and is summarized in Table 1. For a recent review see also Kudrolli (2004).
II.1 Geometrical mechanism
II.1.1 Void filling
Void filling is a local geometric effect that was first clearly identified in Monte Carlo simulations Rosato et al. (1987). During the expansion phase of the shaking cycle all particles move upwards, but during the compaction phase a large particle has a smaller probability of finding a suitable void in the layer below it than a small particle. This leads to the large particles accumulating at the top of the sample.
As pointed out in Kudrolli (2004), void filling works only for weak excitation; for strong driving the voids become larger and the probability that they accommodate a large particle becomes similar to that of a small particle. The void filling effect becomes stronger with increasing diameter ratio , as shown by the increase in the rise velocity of an intruder Vanel et al. (1997). For the intruder seems to undergo a transition from intermittent to continuous ascent, which indicates a change in the microscopic details of the mechanism Duran et al. (1993, 1994). Comparing in a thought experiment the situation of a single large intruder in a bed of small particles with a mixture which contains predominantly large particle hints that increasing will decrease the strength of void filling. In contrast, the overall layer height should not influence this mechanism.
There exists no theoretical model for void filling, but Trujillo et al. Trujillo et al. (2003) identify in their kinetic theory based analysis of the gravitational force a “dynamic tensile” force; for an intruder this upward force increases with . This term vanishes in the limit of a highly expanded mixture. They compare the dynamic tensile force with the void filling mechanism.
II.1.2 Static compressive force
Trujillo et al. Trujillo et al. (2003) find that in the presence of gravity, any size disparity will give rise to another term, which they name static compressive force. The static compressive force will always lead to the RBNE; in the intruder limit it is proportional to .
II.2 Convection
Friction at the container walls can induce convection rolls in vertically shaken mixtures: during the upward acceleration the mixture gets compacted and shear forces induced by the side walls extend through the whole sample. During the subsequent downward motion the mixture is more expanded and consequentially those particles adjacent to the walls experience stronger shear forces than those in the center of the container. Both phases combined give rise to a convection roll going downwards at the sidewalls and upwards in the center.
The relevant geometrical control parameter seems to be the ratio of the size of the downstream layer to the diameter of the large particles. If the large particles are too large to be entrained by the downstream, they become trapped at the top surface and consequently convection leads to BNE Knight et al. (1993, 1996); Cooke et al. (1996). However, if the size of the downward moving regions is big enough to accommodate large particles, these particles perform convective cycles (Knight et al., 1993; Pöschel and Herrmann, 1995; Shinbrot and Muzzio, 1998; Rosato et al., 2002; Nahmad-Molinari et al., 2003), which can lead to mixing Brone and Muzzio (1997).
Magnetic resonance imaging indicates that the size of the downward moving layer is independent of total layer depth and shaking acceleration Knight et al. (1996). However, increasing might reduce the efficiency of both mechanisms as the strength of the convection roll vanishes at the bottom (Pöschel and Herrmann, 1995). Increasing the ratio of large to small particles in a gedanken-experiment Kudrolli (2004) increases the size of the downstream layer and therefore suppresses the BNE and fosters mixing.
II.3 Kinetic energy driven mechanisms
For driven granular media one can define a kinetic granular temperature which corresponds to the average kinetic energy of the random motion of the particles Brilliantov & Pöschel (2004),
| (1) |
where is the particle mass and their velocity. Numerical studies Soto et al. (1999); Bougie et al. (2002); Moon et al. (2004) and experiments Wildman and Parker (2002); Wildman and Huntley (2003); Huan et al. (2004) have shown that in a vertically shaken granular sample depends not only on the position in the sample and the phase of the shaking cycle, but also on the shaking acceleration and the number of particles in the container.
In binary granular mixtures the equipartition of energy breaks down Losert et al. (1999); Wildman and Parker (2002); Wildman and Huntley (2003); Feitosa and Menon (2002); in general the heavier particles have a higher granular temperature than the lighter ones. Non-equipartition increases with decreasing restitution coefficient and increasing mass difference Galvin et al. (2005).
Two different types of segregation mechanisms driven by the granular temperature of the sample have been suggested, based either on a phenomenological model of solid-liquid phase transitions (Hong et al., 2001) or on analyzing momentum balance equations derived from kinetic theory Hsiau and Hunt (1996); Jenkins and Yoon (2002); Garzó and Dufty (2002); Trujillo et al. (2003); Galvin et al. (2005); Brey et al. (2005); Garzó (2006).
II.3.1 Condensation
A mechanism suggested by Hong et al. (Hong et al., 2001) is based on the observation that as the shaking acceleration is increased, a solid-like sample of monodisperse particles will become vibro-fluidized. Assuming that the granular temperature is spatially homogeneous throughout the sample, they postulate the existence of a critical temperature above which all particles are fluidized. For smaller than an increasing fraction of the particles should condense at the bottom of the container. By equating the average kinetic energy of the particles with the potential energy of a particle in the top layer, they find to be proportional to , where is the material density and is the height of the particular layer.
Hong et al. (Hong et al., 2001) argued that in a binary sample the shaking parameters can be adjusted such that is between the critical temperatures of the two species. Then one kind stays fluidized while the other condenses at the bottom. Assuming equipartition and that the values of are not influenced by the presence of the other species, they identify the ratio of the two ’s as the control parameter ,
| (2) |
where the height ratio of the particles filled in separately is equal to in a container of constant width.
For , which corresponds to , the small particles are still condensed and sink to the bottom while the large particles are completely fluidized; the system shows BNE. For the large particles will condense at the bottom and the RBNE takes place. However, these effects will only occur in an intermediate driving regime where is in between the two critical temperatures; otherwise there will be no segregation as a result of condensation.
II.3.2 Mechanisms predicted by kinetic theory
Kinetic theory of binary granular mixtures is an active area of research with competing predictions. As kinetic theory is limited to a regime where binary collisions prevail, these mechanisms are only applicable for dilute mixtures and hence large shaking amplitudes.
Diffusion in a granular temperature gradient. It was first shown by Hsiau and Hunt Hsiau and Hunt (1996) that in a gradient of the granular temperature the heavier particles move to places with lower and thereby expel the lighter particles. Strong vertical temperature gradients in vertically shaken samples have been found in simulation Soto et al. (1999); Bougie et al. (2002); Moon et al. (2004) and experiment Feitosa and Menon (2002); Huan et al. (2004). Due to the complicated spatio-temporal development of the field, it is not possible to decide a priori what type of segregation this effect will lead.
Segregation due to non-equipartition. The derivation in Hsiau and Hunt (1996) assumes equipartition. Recent simulations by Galvin et al. Galvin et al. (2005) have shown that non-equipartition leads to additional driving forces that are comparable in strength to the forces in the calculations assuming equipartition.
An explicit solution for the thermal diffusion coefficients in the case of a single intruder and non-equipartition was given by Brey et al. Brey et al. (2005), who found the ratio of mean square velocities,
| (3) |
to be the control parameter. For particles with same density, they predict , which leads to RBNE; decreases with increasing diameter ratio.
Trujillo et al. Trujillo et al. (2003) identify in their hydrodynamic model a so-called pseudo-thermal buoyancy force, which is proportional to the ratio of the granular temperatures of the two species. They calculate this temperature ratio using the kinetic theory results of Barrat and Trizac Barrat and Trizac (2002), where is always larger than so that the pseudo-thermal buoyancy leads to BNE. Barrat and Trizac also find that non-equipartition increases strongly with and decreases weakly with .
| mechanism | effect | incr. | incr. | incr. |
| void filling | BNE | + | - | 0 |
| static compressive | RBNE | + | ? | ? |
| force | ||||
| convection | BNE | + | - | - |
| mixing | - | + | - | |
| condensation | BNE | - | - | 0 |
| RBNE | + | + | 0 | |
| thermal diffusion | ? | ? | ? | ? |
| non-equipartition | RBNE | + | ? | 0 |
| Brey et al. | ||||
| non-equipartition | BNE | + | - | 0 |
| Trujillo et al. |
III Combination of mechanisms
To predict the state of segregation in an experiment the different mechanisms in Sec. II have to be compared in their relative strength for a given set of control parameters. Here we focus on the phenomenological model from Hong et al. Hong et al. (2001) and the approach based on kinetic theory from Trujillo et al. Trujillo et al. (2003).
We could not compare our results to predictions of hard sphere lattice models (Nicodemi et al., 2002; Coniglio et al., 2004; Tarzia et al., 2004, 2005), which are based on a statistical mechanics approach to granular media Edwards and Oakeshott (1989). Their main control parameter is a configurational temperature, which we were unable to determine in our experiments and simulations.
III.1 The model of Hong, Quinn and Luding
While Hong et al. do not deny the presence of other segregation mechanisms in specific situations, they propose that a theory based on void filling (percolation in their nomenclature, discussed in Sec. II.1.1) and the condensation mechanism (Sec. II.3.1) will provide the general frame work to predict if the BNE or the RBNE is observed. Interpreting the results from Rosato et al. Rosato et al. (1987), they assume void filling to be controlled by
| (4) |
Equating and (Eq. 2) results in an equation for the phase boundary between the two effects which is
| (5) |
with the RBNE if the left hand side is larger than the right hand side and the BNE for the opposite case. Hong et al. study however the more special case where the layer height ratio is chosen to be equal to the diameter ratio . Consequently they obtain for the phase boundary
| (6) |
which is in agreement with their molecular dynamics simulations Hong et al. (2001) and a variational approach minimizing a binary mixture free energy functional Both and Hong (2002).
An experimental test of Eq. 5 or 6 is complicated by the fact that the condensation mechanism can only be observed for an intermediate granular temperature, which is difficult to achieve in experiment. Consequently Breu et al. Breu et al. (2003) did a first study of Eq. 6 by manually preparing binary mixtures in the layer sequence predicted to be unstable for this diameter and density ratio. Then they searched for a combination of the control parameters and where the configuration changed to that predicted. This search succeeded for 82% of the 178 different particle combinations tested. However, they also observed that for the same mixture both BNE and RBNE can occur, depending on the driving parameters. Other experimental Canul-Chay et al. (2002); Möbius et al. (2005) and numerical Ciamarra et al. (2005) studies could not verify the existence of the condensation mechanism.
III.2 The model of Trujillo, Alam and Herrmann
All segregation mechanisms discussed in this paper originate from the presence of a gravitational field parallel to the direction of shaking; in the framework of kinetic theory the influence of this field was first studied by Jenkins and Yoon Jenkins and Yoon (2002). Starting from the same momentum balance equations, Trujillo et al. Trujillo et al. (2003) decompose the net gravitational force into four physical mechanisms. Two of them are geometric in nature: the static compressive force (discussed in Sec. II.1.2) and the dynamic tensile force, which they compare with the void filling mechanism (see Sec. II.1.1). The third term stems from the non-equipartition of energy and is proportional to ; it is called pseudo-thermal buoyancy (Sec. II.3.2). Finally, there is the classical Archimedean buoyancy, which is not relevant for particles of same material densities. The model of Trujillo et al. does not account for convection or spatial inhomogeneities of the kinetic temperature in the sample.
For the two-dimensional case they find that for small the static compressive force, which leads to RBNE, is stronger than the other two terms, which favor BNE. However, the pseudo-thermal buoyancy grows faster with increasing , so there exists a critical diameter ratio above which the system exhibits BNE. They also predict that increasing the fraction of large particles will strongly increase the range of diameter ratios where the RBNE is observed. The same effect should apply for lowering the packing fractions by means of stronger shaking.
IV Methods
IV.1 Experimental setup
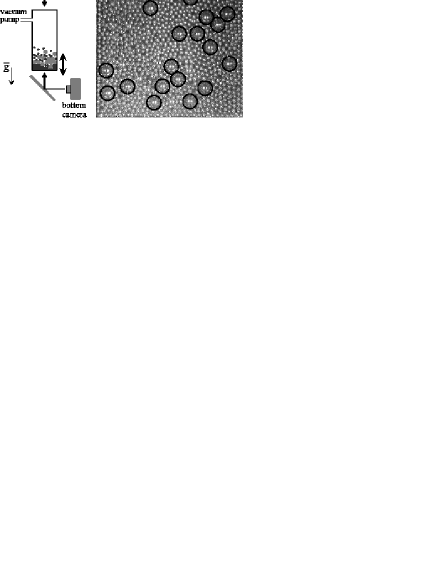
The experimental Setup is shown in Fig. 1. The particles are shaken in a 25 mm x 25 mm square glass tube (Pyrex® Borosilicate) with a height of 360 mm. The bottom plate is made out of sapphire, the top cover of acrylic glass. The cell is mounted on an electromechanical shaker (Vibration Test Systems vg100c) and shaken sinusoidally with an amplitude and frequency . The dimensionless shaking acceleration is , where is the acceleration due to gravity. is controlled by a feedback loop to better than 0.4%.
All particles were made of brass (alloy 260) with a density of 8.4 . The diameter of the large particles was 2.38 mm; the small particle diameters were 0.79 mm, 1.19 mm, and 1.59 mm, corresponding to diameter ratios of 3, 2 and 1.5.
All experiments were performed with the same protocol: after filling with particles, the container was sealed and evacuated to a pressure below 8 Pa. Then a sequence of measurements was performed, each corresponding to a specific set of driving parameters and . Each individual measurement started with the generation of an approximately mixed state by shaking 30 s at Hz and . Then the particles were shaken with the specific and until a steady state was reached. After the shaker was stopped the particles came immediately to rest and images were taken from the top and bottom surface of the sample with a resolution of 40 pixels per . Three more sets of images were taken, each after shaking for another 20 s. The average number of particles counted in the four sets of images was considered one independent measurement.
To identify the position and type of all particles we use two images taken with different illumination. A first image, taken with a single point light source, marks the center of each particle with a light spot. A second image, taken with diffuse illumination, is then used to distinguish between small and large particles. The algorithm makes this decision automatically by comparing the correlation between every found particle and template images of small and large particles. The right side of Fig. 1 shows a result of this image processing. The error rate of the algorithm, as determined by comparing the number of large particles to the results of counting them by eye, is smaller than 6%.
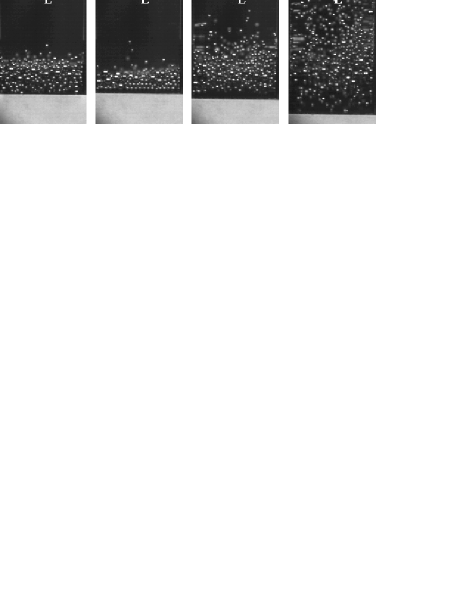
To quantify the amount of convection we took additional images of a sidewall of the sample during the shaking process. Using a Phantom high speed camera we resolve the particle dynamics with a resolution of 24 pixels per at 1077 frames per second. The high frame rate allowed identification of the motion of individual particles. A small depth of field helped to distinguish particles near the sidewalls from particles in the bulk. Figure 2 gives four examples.
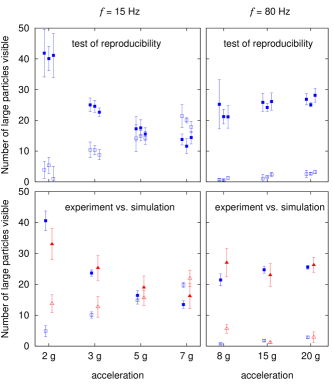
In order to get reproducible results the brass particles had to be treated in two ways. First, all new particles were aged by shaking them for 24 hours at 20 Hz and = 5 to exclude effects due to work hardening. Second, after about every 8 hours of shaking the particles were cleaned for 10 minutes in an ultrasonic bath with a concentrated solution of Alconox powdered cleaner. This removed the fine metal dust which had accumulated in the sample. The resultant reproducibility is illustrated in the top row of Fig. 3
IV.2 Molecular dynamics simulation
A molecular dynamics code described in Bizon et al. (1998) is used for the simulations. In the simulation the container size, number of particles, diameter ratio, mass ratio, and shaking parameters are all identical to those in the experiment. Collisions are assumed to be binary and instantaneous to permit the use of an event driven algorithm to decrease calculation time. The velocities before and after an event are calculated using the collision model proposed by Walton, which does not take into account the details of an interaction but does account for friction and rotation Walton (1993).
For both particle-particle and particle-wall collisions, three constants each (a total of 6) must be defined in this model. First is the coefficient of normal restitution, , which is the ratio of the relative normal velocity () after the collision to the value before the collision. This coefficient in both cases varies with as described in Bizon et al. (1998): the coefficient of restitution is the maximum of and . The changes in relative surface velocity are determined by the coefficient of friction and the minimum coefficient of tangential restitution . The ratio of the value after to before the collision is the maximum of and times the normal impulse. This allows a transition from sliding to rolling contact.
IV.3 Comparison of experiment and Molecular dynamics simulation
The collision parameters were systematically varied until optimal agreement was obtained between simulation and experiment; the results are shown in Fig. 3 lower row. This led to a choice of coefficient of normal restitution, , and friction coefficient, , for both particle-particle and particle-wall collisions.
For particle-particle interactions, the minimum tangential restitution, , was set to 0.5; the results were only weakly dependent on . Critical to the match was , the tangential restitution for particle-wall interactions, which was set to 0.9. This sensitivity to hints towards the importance of sidewall-driven convection in the system. For a detailed discussion of the significance of in this collision model, see Luding and McNamara (1998).
To mimic the experiment, was reduced to after 1000 cycles for simulations at 15 Hz and 40,000 cycles for 80 Hz. In the event drive simulation the particles did not fully come to stop as quickly as they did in the experiment. The simulation continued until the time between collisions with the plate became too small to be handled by the algorithm. For , = 15 Hz and , = 80 Hz, this collapse happened quickly as the layer was dense and close to the plate. The results from these simulations differ from experiment more than for higher shaking amplitudes as some of the dynamics involved in the layer coming to rest are not captured.
The number of particles on top and bottom were determined in simulation from the heights of the particles. If the center a large particle was within of the base, it was considered to be in the reverse state; if more than above the mean height of the small particles, in the Brazil nut state. This measure was determined by making images of the simulation results with the ray-tracing program Povray povray , which were then analyzed in the same fashion as in the experiment. The cutoff values used minimized the difference between the two methods.
V Results I: Influence of driving frequency and amplitude
In this section we will discuss the influence of the driving parameters on the segregation in a “typical” sample consisting of each one monolayer (measured in units of ) of small and large particles with a diameter ratio of two: = 2, = 1, and = 2 . We will first describe our experimental results and then use our molecular dynamics simulations to understand the role of convection and granular temperature inside the sample. In Sec. V.5 we will then explain our findings in terms of the segregation mechanism discussed in Sec. II. Section VI examines how these results change with the diameter ratio, the fraction of large particles and the overall filling height.
V.1 Relaxation into a steady state

An assumption of the measurement protocol described in Sec. IV.1 is that the initial shaking period of 1 min is long enough for the system to reach a steady state. This is demonstrated in Fig. 4 where the shaker was stopped every 30 s to take images and count the number of large particles visible at the bottom and top surface. The time the sample needs to relax to a steady state decreases strongly with increasing acceleration. In experiments with at 15 Hz and at 80 Hz we reach a steady state in less than 1 minute, for lower accelerations we increased the shaking time accordingly. We also find this steady state in agreement with Olsen and Rippie (1964); Faiman and Rippie (1965) to be history independent: Starting from samples prepared in a BNE or RBNE configuration results in the same average number of particles.
V.2 Dependence on the driving amplitude
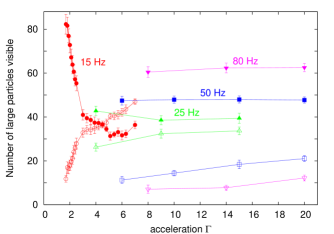
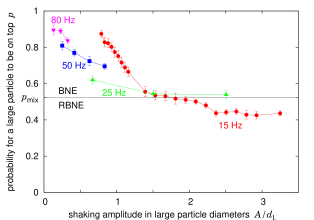
Figure 5 demonstrates that the segregation behavior is relatively complicated when plotted as a function of the shaking acceleration. For = 15 Hz there is a crossover from a strong BNE to a weak RBNE at . In contrast for higher values of we find the steady state always to be BNE and largely independent of .
To characterize the segregation behavior we introduce the probability that an observed large particle is at the top surface, , where and correspond to the average number of large particles detected at the top and bottom surfaces. Consequently identifies a complete BNE, a RBNE state.
The results for the probability as a function of the driving amplitude are shown in Fig. 6: with increasing shaking amplitude the system passes from a strong BNE to a weak RBNE. Qualitatively similar results have been found in the experiments of Breu et al. Breu et al. (2003) and the soft-core molecular dynamics simulations of Pica Ciamarra et al. Ciamarra et al. (2005).
V.3 The role of convection
Convection driven by the sidewalls of the container cannot be switched off in experiment. To estimate the relative importance of this mechanism we therefore rely on the molecular dynamics simulations described in Sec. IV.2, where we can suppress convection by using periodic boundary conditions for the lateral walls of the container Ciamarra et al. (2005). Figure 7 shows again good agreement between experiment and simulations with frictional sidewalls for all but the smallest shaking amplitude at both 15 Hz and 80 Hz. However, the role of convection is different at the two frequencies.
Switching off convection in the simulations at 15 Hz results in a significantly lower probability for a large particle to be on top. For shaking amplitudes smaller than 1.2 , switching off convection makes the system go from BNE to a mixed state. At higher amplitudes another RBNE mechanism eventually becomes stronger than convection so that the overall effect even with convection becomes RBNE.
Simulation results at 80 Hz with frictional sidewalls and periodic boundaries agree quite well, showing that convection is not responsible for the strong BNE observed there. This agrees with the experimental observations: in high-speed movies of the top and bottom surface of the sample the driving mechanism was identified as void filling.
This dependence of the segregation mechanism on agrees with the previous experimental observations: Vanel et al. Vanel et al. (1997) found the motion of an intruder to be governed by convection for frequencies below 40 Hz and by void filling above. Other experiments observing convection were performed with well separated taps Knight et al. (1993, 1996); Möbius et al. (2001, 2004, 2005) or at 10 Hz Cooke et al. (1996).
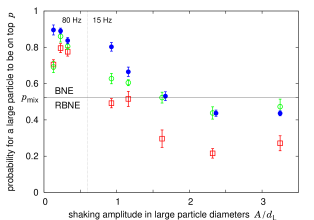
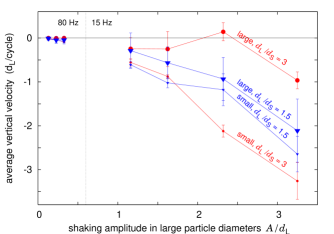
Figure 8 shows the experimentally measured average vertical velocities in the layer adjacent to the sidewalls. For small the observed velocities are comparable in size to the measurement errors. However, for = 15 Hz and , the small particles start to become dragged down significantly, which is in agreement with the findings in Fig. 7. For shaking amplitudes larger than 1.5 , large particles also get entrained in the downward flow. At these amplitudes the system shows a slight RBNE, so we are unable to decide if convection still drives the system towards BNE or if it has become a mixing mechanism.

V.4 The granular temperatures of the two species
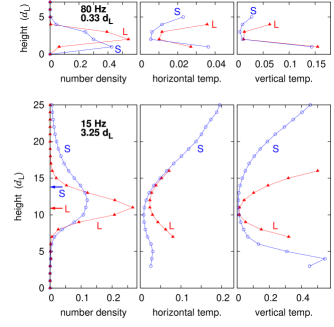
Figure 9 shows the height dependence of the number density and the granular temperature in simulations with periodic boundaries. Because gravity and shaking differentiates between vertical and horizontal motion, we analyze the granular temperature in these two directions separately. The upper frame characterizes the fields at = 80 Hz and = 0.33 ; their behavior is independent of the phase of the driving. The center of mass of the large particles is higher than that of the small particles, corresponding to the BNE found after switching off the shaking. While this BNE is generally attributed to the void-filling mechanism, it is interesting that the center of mass of the large particle has also the same height as the minimum of granular temperature in both horizontal and vertical directions. This hints that the realm of thermal diffusion and therefore kinetic theory might extend to relatively dense samples.
At = 15 Hz and = 3.25 the results do depend on the phase of the shaking cycle. However, after the initial shock wave induced by the plate hitting the sample has traveled upwards Bougie et al. (2002), the remaining 5/6 of the shaking cycle is well represented by the data in Fig. 9. Two features are characteristic for this “free flight” phase: first the center of mass of the large particles is always below that of the small particles; this agrees with the RBNE found in experiment and simulation. Second, the center of mass of the large particles is at approximately the same height as the minimum of granular temperature in both horizontal and vertical directions.
These two features point clearly to the thermal diffusion mechanism suggested by Hsiau and Hunt Hsiau and Hunt (1996) to be the cause for the observed RBNE. Minima of granular temperature are a generic feature of vertically vibrated granular samples Soto et al. (1999); Moon et al. (2004); Feitosa and Menon (2002); Huan et al. (2004), so thermal diffusion can be expected to be a relevant segregation mechanism in many systems.
Characterizing the degree of non-equipartition is difficult due to the strong spatio-temporal dependencies of the granular temperatures of both species. For a first estimate we have computed a weighted ratio:
| (7) |
where is the height dependent number density of large particles. Averaged over the whole cycle, the simulations at = 15 Hz and = 3.25 yield a temperature ratio of 5.4 2.2 in vertical direction and 2.8 0.6 in horizontal direction. The larger standard deviation in vertical direction results from a threefold increase of during the initial shock wave. At = 80 Hz and = 0.33 the temperature ratio is 2.2 in vertical direction and 1.7 in horizontal direction.
Predictions of from kinetic theory assume a dilute granular gas either driven by a stochastic thermostat (Barrat and Trizac Barrat and Trizac (2002)) or shaken at high frequencies and high amplitudes (Brey et al. Brey et al. (2005)). Figure 2 demonstrates that a granular gas is most closely realized by shaking with = 15 Hz and = 3.25 . With our diameter ratio, coefficient of restitution, and number of particles, the polynomial equation given by Barrat and Trizac predicts = 2.62, which is in good agreement with our result of 2.8 0.6 for the horizontal temperature ratio (which depends less on the phase of the shaking cycle). The cubic equation for the ratio of the mean square velocities given by Brey et al. Brey et al. (2005) results in = 1.28; however, their result was derived for the case of a single large intruder, not equal volumes of small and large particles. We will return to this question in Sec. VI.1.
V.5 Relevance of the different mechanisms
The following overall picture emerges: at high frequencies and small shaking amplitudes the sample shows a strong BNE due to void filling. At low frequencies and small shaking amplitudes, sidewall driven convection also leads to a BNE. However, with increasing shaking amplitude, thermal diffusion becomes relevant: because the minimum of granular temperature is lower than the center of mass of the whole sample, thermal diffusion results in a RBNE that eventually becomes stronger than the BNE due to convection.
By Eqs. 2 and 4, the control parameters for both condensation and void filling have the same numerical value of 8. Therefore, the theory of Hong et al. predicts a strong BNE except for some intermediate driving range where condensation takes place and is of equal strength as void filling, which should lead to a mixed state. Figure 2 shows that a condensation of large particles is only conceivable for shaking amplitudes smaller than 1.16 . Neither the experimental data in Fig. 6 nor the simulations in Fig. 7 show signs of condensation taking place at any frequency and amplitude.
The effect of non-equipartition and static compressive force on the RBNE at high shaking amplitudes can be more appropriately studied by their dependence on the diameter ratio, as described in the next section.
VI Results II: Influence of diameter ratio, volume ratio, and total layer height
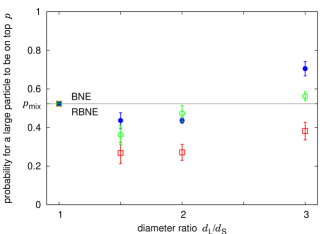
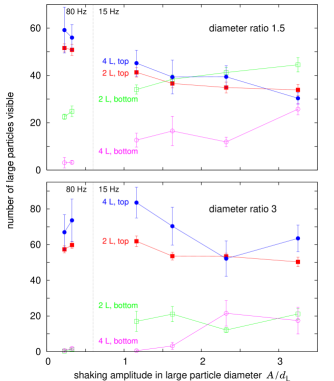
VI.1 Dependence on diameter ratio
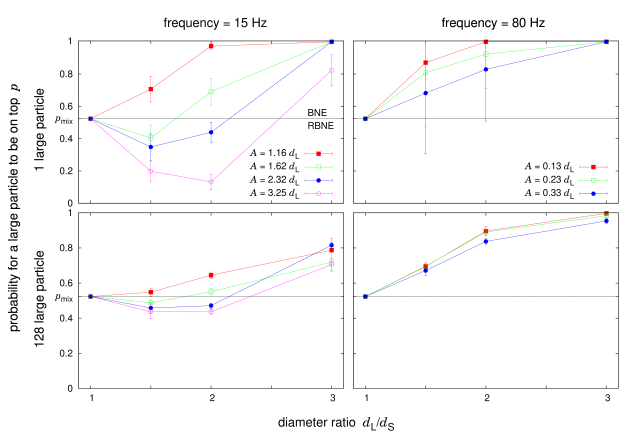
The dependence of the experimental segregation results on the diameter ratio is shown in Fig. 10. At = 80 Hz a change of the diameter ratio from 1.5 to 3 always increases the BNE, which is in agreement with our interpretation of void filling as the relevant mechanism.
At = 15 Hz the situation is more complex: for = 1.16 , the system exhibits BNE; its strength increases with diameter ratio. At larger shaking amplitudes we observe RBNE at small and BNE at larger diameter ratios. This general behavior is the same for a single large intruder and equal volumes of large and small particles; however, the effects are more pronounced for the single intruder.
We know from Fig. 7 and 9 that the results at = 15 Hz involve at least two mechanisms: convection and thermal diffusion. Since we want to use the dependence on the diameter ratio to study the role of non-equipartition and static compressive force, we first try to isolate the contribution of convection. In analogy to Fig. 7, we do this by comparing the experimental results with simulations with rigid and periodic boundaries, as shown in Fig. 11. We consider only the case of the largest shaking amplitude because it can be expected to resemble best the driving assumed in Trujillo et al. (2003); Brey et al. (2005).
The agreement in Fig. 11 between the experimental results and the simulations with rigid boundaries decreases for diameter ratios of 1.5 and 3. This is probably due to two reasons: First we kept the collision parameters in the simulation at the values obtained from the fit with data for a diameter ratio of two; however, the coefficient of restitution is known to change with the particle diameter Brilliantov & Pöschel (2004). Second, the large size discrepancy leads to increased probability of multi-particle collisions, thus the model of Luding and McNamara was implemented for the simulations with a diameter ratio of 3 Luding and McNamara (1998). In this scheme, the restitution coefficient was set to 1 if a particle encountered a second collision within a short time frame. Still only a subset of the simulations ran successfully.
| 1.5 | 2 | 3 | |
|---|---|---|---|
| Barrat and Trizac | 1.51 | 2.62 | 9.11 |
| MD simulation | 1.3 0.1 | 2.9 0.6 | 8.9 3.8 |
Despite these caveats Fig. 11 shows that the BNE for a diameter ratio of 3 is due to an increase in convection. This effect can also be seen in the average particle velocity measured at the sidewall of the container in Fig. 12. At small shaking amplitudes the convection is again negligible as in Fig. 8. For the difference in the downward velocity for small and large particles increases significantly with the diameter ratio.
Aside from the effect of convection, the main result in Fig. 11 is that the slight RBNE in strongly shaken mixtures is relatively independent of the diameter ratio. Yet non-equipartition increases by a factor of six for the diameter ratios studied, as shown in Table 2, which also shows that is in good agreement with the kinetic theory based predictions of Barrat and Trizac Barrat and Trizac (2002).
Together this relative independence of on and the strong dependence of on indicates that non-equipartition has only a weak influence on our results. This is in contrast to the predictions of Trujillo et al. Trujillo et al. (2003), who expect the static compressive force which leads to RBNE to be dominant at small diameter ratios. However, non-equipartition grows faster with increasing diameter ratio than the static compressive force, so the system should show a crossover to BNE.
For the reasons given above, we were unable to gather meaningful statistics for simulations of a single intruder in a container with periodic boundaries. Therefore, we cannot comment on the predictions of Brey et al. Brey et al. (2005), who found for an intruder that non-equipartition leads to a RBNE that increases in strength with increasing diameter ratio.
VI.2 Dependence on the volume ratio
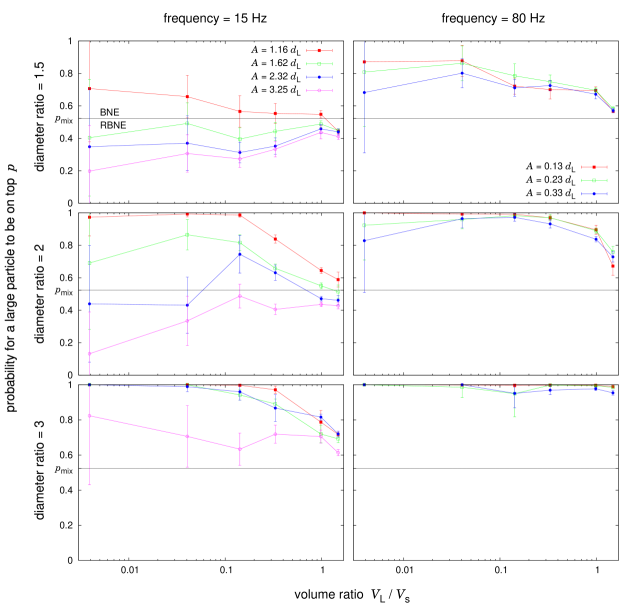
The dependence of the segregation results on the composition of the sample measured as the ratio between the volumes of the large and small particle is shown in Fig. 13. For each volume ratio the same behavior as in Fig. 6 can be observed: the probability of a large particle to be at the top of the sample decreases with increasing . For volume ratios in the range from a single intruder up to 20% large particles, depends only weakly on .
At higher volume ratios, shows a trend from BNE towards a mixed state with increasing . This effect is in agreement with the suggested segregation mechanism: at = 15 Hz the size of the convective downstream layer increases and more large particles can get entrained Kudrolli (2004), while at = 80 Hz an increase of results in larger voids in the sample and therefore the void-filling mechanism becomes less effective. A comparison of the two frequencies shows that convection is more impaired by an increase in than void filling.
An increasing RBNE with increasing diameter ratio was not found for any of the combinations of volume ratios and driving parameters in Fig. 13. Therefore, a static compressive force is not needed to explain our results.
Figure 13 provides another test of the theory of Hong et al. Hong et al. (2001). According to Eq. 5 the condensation mechanism leading to RBNE will become stronger than the void filling mechanism for volume ratios larger than 1. The right-most points in Fig. 13 have = 1.5; therefore, we should see here at some intermediate driving regime a clear drop of from a BNE to RBNE and back to BNE for a further increase in .
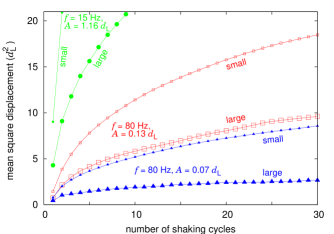
While no condensation was found at an intermediate driving range, this leaves open the possibility of condensation at even smaller driving amplitudes. Hong et al. consider a particle as being fluidized if it has the ability to exchange its position with its neighbors. Therefore, the mean square displacement of particles in a condensed phase should show a plateau at a small distance. Figure 14 shows the development of the mean square displacement of large and small particles in simulations with periodic boundary conditions. Only at a frequency of 80 Hz and an amplitude of 0.07 (which pushes the limits of our simulation technique as discussed in Sec. IV.3) do the large particles seem to be caged by their neighbors, while the small particles are still mobile. According to the condensation mechanism, this should result in a RBNE. However, in experiment we find a clear BNE with = 0.67 (at a of 1.5). This steady state is reached after approximately 20 minutes (corresponding to shaking cycles) and therefore unlikely to be found in simulations. Similar experiments at = 15 Hz and shaking amplitudes down to 0.61 do not yield any signature of the condensation mechanism.
VI.3 Dependence on the total layer height
The dependence of the segregation on the layer depth is shown in Fig. 15. For a diameter ratio of 1.5 the number of large particles at the top is mostly independent of while the number at the bottom drops significantly with increasing . At a diameter ratio of 3 there is a slight increase of the number at the top while the number at the bottom stays relatively constant at low levels.
The absence of the RBNE in deeper layers was also noted by Breu et al. Breu et al. (2003). It is compatible with thermal diffusion as the responsible mechanism for the RBNE in shallow layers, assuming that the relative height of the temperature minimum stays constant when is increased. Then in deeper samples the accumulation of large particles would no longer be visible at the bottom. The condensation mechanism does not explain the vanishing of the RBNE in deeper layers as the condensed fraction of large particles is assumed to accumulate at the bottom independent of . At a diameter ratio of 3, void filling and convection are much stronger contributions to the final result; therefore, the relative influence of is smaller.
Note that the transition from two to four layers increases the relaxation times. Though we increased the initial shaking time from 1 to 3 minutes, experiments with = 80 Hz, = 0.13 still had not reached their steady state and were therefore not included.
VII Conclusions
We have studied the segregation of vertically shaken binary mixtures of brass spheres in experiment and event-driven simulation. By using the same material for small and large particles and evacuating the sample container, we eliminated Archimedean buoyancy, friction, and pressure effects from the list of potential segregation mechanisms. We have found that three mechanisms are sufficient to explain our results:
(1) At a shaking frequency of 80 Hz all samples exhibited a strong Brazil nut effect due to the geometrical mechanism called void filling. The strength of the segregation increases with diameter ratio and decreases weakly with the shaking amplitude. Increasing the number of large particles from a single intruder up to a mixture of equal volumes of large and small particles results only in a slight decrease of the strength of the effect.
(2) At a shaking frequency of 15 Hz and shaking amplitudes up to 1.5 large particle diameters, a strong Brazil nut effect is induced by side wall driven convection. The strength of the effect increases strongly with diameter ratio and decreases with the relative amount of large particles.
(3) If the shaking amplitude is increased above 1.5 large particle diameters, the sample starts to resemble a granular gas and the thermal diffusion mechanism becomes significant. Thermal diffusion describes the tendency of large particles to accumulate in the minimum of the granular temperature profile. In a shallow layer of height two large particle diameters and for diameter ratios smaller than three, thermal diffusion eventually becomes stronger than convection, which leads to the reverse Brazil nut effect. Thermal diffusion seems to be only weakly dependent on the diameter ratio. If the total layer height is increased to four large particle diameters, the temperature minimum is within the sample and no increased number of large particles at the bottom is observed.
While we probed the parameter regimes where the static compressive force and the condensation mechanisms were expected to be relevant, we did not find any signature of these two segregation mechanisms. The apparent agreement between the condensation-based model in Hong et al. (2001) and the experimental phase diagram separating BNE and RBNE in Breu et al. (2003) can be explained by the fact that they changed both frequency and amplitude of the driving deliberately. Then both BNE and RBNE can occur in the same sample, as shown above and also in Breu et al. (2003).
We also find non-equipartition to have no discernible influence on our results. However, this might be due to either the relatively high coefficient of restitution (0.7) or to the fact that we are not shaking vigorously enough for those effects to be observed.
The theories presented in (Hong et al., 2001; Trujillo et al., 2003) lack two of the important mechanisms (convection, thermal diffusion) and at the same time they include mechanisms which are not relevant (static compressive force, non-equipartition, condensation); hence these theories can not explain our experimental and numerical results.
In the limit of strong shaking, we believe that kinetic theory-based approaches have the potential to explain segregation, though the inclusion of convection might prove daunting. A good starting point for a microscopic theory of void filling might be the “random fluctuating sieve“ theory of inclined chute flow Savage and Lun (1988), as pointed out in Kudrolli (2004).
Note added in proof. The assumption in VI C that the relative height of the temperature minimum is independent of the total number of spheres is supported by the analysis in Ref serero:06 .
Acknowledgments: We thank Christine Hrenya, Javier Brey, Massimo Pica Ciamarra, and Vicente Garzó for helpful discussions, the organizers of the KITP program on Granular Physics 2005, and Sibylle Nägle for her help with Povray. This work was supported by the Robert A Welch Foundation and by the Engineering Research Program of the Office of Basic Energy Sciences of the U.S. Department of Energy (Grant No. DE-FG03-93ER14312).
References
- Olsen and Rippie (1964) J. L. Olsen and E. G. Rippie, J. Pharm. Sci. 53, 147 (1964).
- Faiman and Rippie (1965) M. D. Faiman and E. G. Rippie, J. Pharm. Sci. 54, 719 (1965).
- Hsiau and Yu (1997) S. S. Hsiau and H. Y. Yu, Powder Techn. 93, 83 (1997).
- Brone and Muzzio (1997) D. Brone and F. J. Muzzio, Phys. Rev. E 56, 1059 (1997).
- Burtally et al. (2002) N. Burtally, P. J. King, and M. R. Swift, Science 295, 1877 (2002).
- Breu et al. (2003) A. P. J. Breu, H.-M. Ensner, C. A. Kruelle, and I. Rehberg, Phys. Rev. Lett. 90, 014302 (2003).
- Williams (1963) J. C. Williams, Fuel Soc. J. 14, 29 (1963).
- Duran et al. (1993) J. Duran, J. Rajchenbach, and E. Clément, Phys. Rev. Lett. 70, 2431 (1993).
- Duran et al. (1994) J. Duran, T. Mazozi, E. Clément, and J. Rajchenbach, Phys. Rev. E 50, 5138 (1994).
- Knight et al. (1993) J. B. Knight, H. M. Jaeger, and S. R. Nagel, Phys. Rev. Lett. 70, 3728 (1993).
- Knight et al. (1996) J. B. Knight, E. E. Ehrichs, V. Y. Kuperman, J. K. Flint, H. M. Jaeger, and S. R. Nagel, Phys. Rev. E 54, 5726 (1996).
- Cooke et al. (1996) W. Cooke, S. Warr, J. M. Huntley, and R. C. Ball, Phys. Rev. E 53, 2812 (1996).
- Vanel et al. (1997) L. Vanel, A. D. Rosato, and R. N. Dave, Phys. Rev. Lett. 78, 1255 (1997).
- Shinbrot and Muzzio (1998) T. Shinbrot and F. J. Muzzio, Phys. Rev. Lett. 81, 4365 (1998).
- Liffman et al. (2001) K. Liffman, K. Muniandy, M. Rhodes, D. Gutteridge, and G. Metcalfe, Granular Matter 3, 205 (2001).
- Fernando and Wassgren (2003) D. N. Fernando and C. R. Wassgren, Phys. Fluids 15, 3458 (2003).
- Nahmad-Molinari et al. (2003) Y. Nahmad-Molinari, G. Canul-Chay, and J. C. Ruiz-Suárez, Phys. Rev. E 68, 041301 (2003).
- Huerta and Ruiz-Suárez (2004a) D. A. Huerta and J. C. Ruiz-Suárez, Phys. Rev. Lett. 92, 114301 (2004a); D. A. Huerta and J. C. Ruiz-Suárez, Phys. Rev. Lett. 93, 069901(E) (2004b).
- Yan et al. (2003) X. Yan, Q. Shi, M. Hou, K. Lu, and C. K. Chan, Phys. Rev. Lett. 91, 014302 (2003).
- Möbius et al. (2001) M. E. Möbius, B. E. Lauderdale, S. R. Nagel, and H. M. Jaeger, Nature 414, 270 (2001).
- Möbius et al. (2004) M. E. Möbius, X. Cheng, G. S. Karczmar, S. R. Nagel, and H. M. Jaeger, Phys. Rev. Lett. 93, 198001 (2004).
- Möbius et al. (2005) M. E. Möbius, X. Cheng, P. Eshuis, G. S. Karczmar, S. R. Nagel, and H. M. Jaeger, Phys. Rev. E 72, 011304 (2005).
- Huerta et al. (2005) D. A. Huerta, V. Sosa, M. C. Vargas, and J. C. Ruiz-Suárez, Phys. Rev. E 72, 031307 (2005).
- Hong et al. (2001) D. C. Hong, P. V. Quinn, and S. Luding, Phys. Rev. Lett. 86, 3423 (2001).
- Trujillo et al. (2003) L. Trujillo, M. Alam, and H. J. Herrmann, Europhys. Lett. 64, 190 (2003).
- Shishodia and Wassgren (2001) N. Shishodia and C. R. Wassgren, Phys. Rev. Lett. 87, 084302 (2001).
- Bose et al. (2005) M. Bose, U. U. Kumar, P. R. Nott, and V. Kumaran, Phys. Rev. E 72, 021305 (2005).
- Ciamarra et al. (2005) M. Pica Ciamarra, M. D. De Vizia, A. Fierro, M. Tarzia, A. Coniglio, and M. Nicodemi Phys. Rev. Lett. 96, 058001 (2006).
- Srebro and Levine (2003) Y. Srebro and D. Levine, Phys. Rev. E 68, 061301 (2003).
- Biswas et al. (2003) P. Biswas, P. Sánchez, M. R. Swift, and P. J. King, Phys. Rev. E. 68, 050301(R) (2003).
- Kudrolli (2004) A. Kudrolli, Rep. Prog. Phys. 67, 209 (2004).
- Rosato et al. (1987) A. Rosato, K. J. Strandburg, F. Prinz, and R. H. Swendsen, Phys. Rev. Lett. 58, 1038 (1987).
- Pöschel and Herrmann (1995) T. Pöschel and H. J. Herrmann, Europhys. Lett. 29, 123 (1995).
- Rosato et al. (2002) A. D. Rosato, D. L. Blackmore, N. Zhang, and Y. Lan, Chem. Eng. Sci. 57, 265 (2002).
- Brilliantov & Pöschel (2004) N. V. Brilliantov, T. Pöschel, Kinetic Theory of Granular Gases, Oxford University Press (2004).
- Bougie et al. (2002) J. Bougie, S. J. Moon, J. B. Swift, and H. L. Swinney, Phys. Rev. E 66, 051301 (2002).
- Soto et al. (1999) R. Soto, M. Mareschal, and D. Risso, Phys. Rev. Lett. 83, 5003 (1999).
- Moon et al. (2004) S. J. Moon, J. B. Swift, and H. L. Swinney, Phys. Rev. E 69, 011301 (2004).
- Huan et al. (2004) C. Huan, X. Yang, D. Candela, R. W. Mair, and R. L. Walsworth, Phys. Rev. E 69, 041302 (2004).
- Wildman and Parker (2002) R. D. Wildman and D. J. Parker, Phys. Rev. Lett. 88, 064301 (2002).
- Wildman and Huntley (2003) R. D. Wildman and J. M. Huntley, Phys. Fluids 15, 3090 (2003).
- Losert et al. (1999) W. Losert, D. G. W. Cooper, J. Delou, A. Kudrolli, and J. P. Gollub, Chaos 9, 682 (1999).
- Feitosa and Menon (2002) K. Feitosa and N. Menon, Phys. Rev. Lett. 88, 198301 (2002).
- Galvin et al. (2005) J. E. Galvin, S. R. Dahl, and C. M. Hrenya, J. Fluid Mech. 528, 207 (2005).
- Hsiau and Hunt (1996) S. S. Hsiau and M. L. Hunt, Acta Mech. 114, 121 (1996).
- Jenkins and Yoon (2002) J. T. Jenkins and D. K. Yoon, Phys. Rev. Lett. 88, 194301 (2002).
- Garzó and Dufty (2002) V. Garzó and J. W. Dufty, Phys. Fluids 14, 1476 (2002).
- Brey et al. (2005) J. J. Brey, M. J. Ruiz-Montero, and F. Moreno, Phys. Rev. Lett 95, 098001 (2005).
- Garzó (2006) V. Garzó, cond-mat 0603232 (2006).
- Barrat and Trizac (2002) A. Barrat and E. Trizac, Granular Matter 4, 57 (2002).
- Nicodemi et al. (2002) M. Nicodemi, A. Fierro, and A. Coniglio, Europhys. Lett. 60, 684 (2002).
- Tarzia et al. (2004) M. Tarzia, A. Fierro, M. Nicodemi, and A. Coniglio, Phys. Rev. Lett. 93, 198002 (2004).
- Coniglio et al. (2004) A. Coniglio, A. Fierro, and M. Nicodemi, Physica D 193, 292 (2004).
- Tarzia et al. (2005) M. Tarzia, A. Fierro, M. Nicodemi, M. Pica Ciamarra, and A. Coniglio, Phys. Rev. Lett. 95, 078001 (2005).
- Edwards and Oakeshott (1989) S. F. Edwards and R. B. S. Oakeshott, Physica A 157, 1080 (1989).
- Both and Hong (2002) J. A. Both and D. C. Hong, Phys. Rev. Lett. 88 124301 (2002).
- Canul-Chay et al. (2002) G. A. Canul-Chay, P. A. Belmont, Y. Nahmad-Molinari, and J. C. Ruiz-Suárez, Phys. Rev. Lett. 89, 189601 (2002).
- Bizon et al. (1998) C. Bizon, M. D. Shattuck, J. B. Swift, W. D. McCormick, and H. L. Swinney, Phys. Rev. Lett. 80, 57 (1998).
- Walton (1993) O. Walton, in Particulate Two-Phase Flow, edited by M. Roco (Butterworth-Heinemann, Boston, 1993), p. 884.
- Luding and McNamara (1998) S. Luding and S. McNamara, Granular Matter 1, 113 (1998).
- (61) http://www.povray.org
- (62) Because the top surface is not flat and can therefore accommodate more particles, the probability of a perfectly mixed state corresponds to 0.523, as determined from images of samples only consisting of big particles.
- Savage and Lun (1988) S. B. Savage and C. K. K. Lun, J. Fluid Mech. 189, 311 (1988).
- (64) D. Serero, I. Goldhirsch, S. H. Noskowicz and M. -L. Tan, J. Fluid Mech. 554, 237 (2006).