Hysteresis effects in the phase diagram of multiferroic GdMnO3
Abstract
We present high-resolution thermal expansion and magnetostriction measurements of GdMnO3, which develops an incommensurate antiferromagnetic order (ICAFM) below 42 K and transforms into a canted A-type antiferromagnet (cAFM) below K. In addition, a ferroelectric polarization is observed below for finite magnetic fields applied along the direction. In zero magnetic field we find a strongly anisotropic thermal expansion with certain, rather broad anomalous features. In finite magnetic fields, however, very strong anomalies arise at for fields applied along each of the orthorhombic axes and at for fields along the axis. Both phase transitions are of first-order type and strongly hysteretic. We observe a down-bending of the ICAFM-to-cAFM phase boundary for low magnetic fields and our data give evidence for coexisting phases in the low-field low-temperature range.
pacs:
75.47.Lx,64.70.Rh,65.40.De,75.80.+qThe recent discovery of very large magnetoelectric effects in the rare-earth manganites RMnO3 has reopened the field of the so-called multiferroic materials.Kimura et al. (2003a); Goto et al. (2004) Multiferroic means, that several ferro-type orders like ferromagnetism, ferroelectricity or ferroelastivity coexist. The rare-earth manganites RMnO3 may be grouped into the hexagonal ones (R= Ho,, Lu) and those with orthorhombically distorted perovskite structures (R= La,, Dy). The hexagonal RMnO3 show both, ferroelectric and magnetic order, but the respective ordering temperatures differ by an order of magnitude, K and K.Fiebig et al. (2002) In contrast, RMnO3 with R = Gd, Tb, and Dy possess comparable transition temperatures for the magnetic and the ferroelectric ordering.Kimura et al. (2003a); Goto et al. (2004) Both, TbMnO3 and DyMnO3 develop an incommensurate antiferromagnetic order (ICAFM) below about 40 K. The incommensurability continuously changes upon cooling and becomes almost constant below K and K for and Dy, respectively. The transition to this long-wavelength incommensurate antiferromagnetic (LT-ICAFM) phase is accompanied by ferroelectric (FE) ordering with a polarization , which flops to above a critical magnetic field applied along the or direction, while it is suppressed for large fields along .Kimura et al. (2005) GdMnO3 also shows an ICAFM order below K and a second transition at K. Based on the observed weak ferromagnetismKimura et al. (2003b); Hemberger et al. (2004) and on X-ray diffraction studiesArima et al. (2005) a canted A-type antiferromagnetic ordering (cAFM) has been proposed for , but a direct magnetic structure determination has not yet been published. Both transition temperatures weakly increase in a magnetic field.Kimura et al. (2005) Concerning the FE polarization, contradictory results have been reported. Kuwahara et al.Kuwahara et al. (2005) find a finite polarization below 13 K, while Kimura et al.Kimura et al. (2005) observe FE order only between 5 K and 8 K. The magnitude of P is much smaller than in TbMnO3 and DyMnO3 and the direction is . Moreover, there are no magnetic-field-induced polarization flops. Instead the polarization is stabilized by a magnetic field along , while it is immediately suppressed for fields along and .Kimura et al. (2005); Kuwahara et al. (2005)
In order to study the coupling of the various phase boundaries to lattice degrees of freedom we have conducted high-resolution measurements of thermal expansion and magnetostriction on GdMnO3. We find pronounced anomalies at all transitions, i.e. all transitions strongly couple to the lattice. Thus, our data allow for a precise determination of the magnetic-field temperature phase diagram and clearly reveal that the ICAFM-to-cAFM as well as the FE transition are of first oder with strong hysteresis. For low magnetic fields we find a down-bending of the ICAFM-to-cAFM phase boundary and evidence for a coexistence of both phases in this low-field range. This should be taken into account for further experiments, in particular for zero magnetic field. Probably, this may also explain the contradictory results reported for GdMnO3.Kimura et al. (2005); Kuwahara et al. (2005); rem
The GdMnO3 single crystal used in this study is a cuboid of dimensions mm3 along the , , and direction (Pbnm setting), respectively. It was cut from a larger crystal grown by floating-zone melting. Phase purity was checked by x-ray powder diffraction.Kadomtseva et al. (2005) Magnetization, resistivity and specific heat data of the same crystal are reported in Ref. Hemberger et al., 2004. The linear thermal expansion and magnetostriction have been measured by a home-built high-resolution capacitance dilatometer.Lorenz et al. (1997) Here, denote the lengths parallel to the different crystal axes , , and . In general, we studied the length changes in longitudinal magnetic fields up to 14 T, i.e. , and, in addition, we measured for .
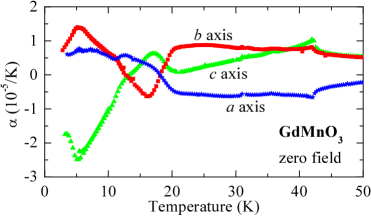
Fig. 1 shows the zero-field of GdMnO3 for , , and , which are strongly anisotropic and show several anomalies. The sharp anomalies around 41 K signal the Néel transition of the Mn ions and their shape is typical for a second-order phase transition. According to previous publications further anomalies are expected at lower : (i) at the ICAFM-to-cAFM transition around K, (ii) around K, where the FE ordering sets in, and (iii) around 6 K due to the ordering of the Gd moments. Indeed, there are pronounced anomalies around 6 K, small ones around 10 K, and intermediate ones around 20 K with different signs and magnitudes for the different . However, all these anomalies are rather broad making a clear identification of transition temperatures difficult. This drastically changes for finite magnetic fields.
In Fig. 2 we show for . With increasing magnetic field a broad anomaly shows up around 10 K, changes sign and smears out above 2 T. The origin of this anomaly is unclear, it may be related to the complex interplay of the magnetism of the Mn and Gd ions.Hemberger et al. (2004) The most drastic change occurs, however, around 18 K, where a huge anomaly emerges between 0 and 1 T. This anomaly is close to the observed ICAFM-to-cAFM transition at and systematically shifts to higher with further increasing field, in agreement with the observed field dependence .Kimura et al. (2003a, 2005); Arima et al. (2005) The negative sign of the anomaly means that the transition from the cAFM to the ICAFM phase, with increasing , is accompanied by a pronounced contraction of the axis (see also Fig. 3). The curves of Fig. 2a have been recorded with increasing in the so-called field-cooled (FC) mode, i.e. the field has been applied at K. We have also recorded the data during the cooling runs. Fig. 2b compares obtained with increasing and decreasing for T. Obviously, there is a strong hysteresis at the ICAFM-to-cAFM transition identifying this transition as first-order type.
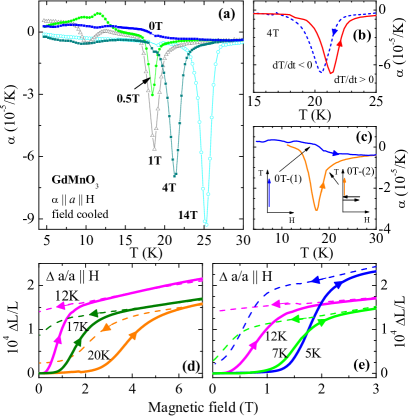
The lower panels of Fig. 2 present the magnetostriction for at constant . At 20 K an anomalous expansion of the axis occurs around 4 T, which is related to a transition from the ICAFM to the cAFM phase as a function of increasing . Both, the position of the anomaly in the plane and its magnitude fit to the position and magnitude of the corresponding anomaly due to the ICAFM-to-cAFM transition as a function of decreasing . The curves obtained with increasing and decreasing also show a hysteresis at the ICAFM-to-cAFM transition. With decreasing the anomaly of shifts towards lower field. Around 12 K an anomalous expansion of the axis is observed with increasing , however, this expansion is not reversed upon decreasing the field. Due to the large hysteresis GdMnO3 remains in the cAFM phase after the magnetic field is switched off. With further decreasing , the anomaly of again shifts to higher field and at 5 K the anomalous expansion occurring with increasing is reversed again with decreasing field. Apparently, we have traced the field-induced transition to the cAFM phase down to our lowest . This means that the ICAFM-to-cAFM phase boundary shows a clear down-bending in the low-field range (see Fig. 5). In order to verify this, we have carried out the following zero-field measurement: after cooling the sample to 12 K in zero field we have applied a magnetic field of 8 T in order to enter the cAFM phase and due to the hysteresis of the ICAFM-to-cAFM transition the sample should remain in the cAFM phase after removing the field again. Fig. 2c shows a comparison of this zero-field [labeled as 0T-(2)] with the conventional FC [0T-(1)]. In contrast to the 0T-(1) curve, the 0T-(2) measurement shows a sharp peak around , which is comparable to the anomaly of the finite-field curves. This clearly confirms the down bending of the ICAFM-to-cAFM phase boundary. Thus, the (pure) cAFM phase of GdMnO3 cannot be reached by cooling the crystal in zero field. The broad anomalies in the zero-field curves (see Fig. 1) probably arise from a partial ICAFM-to-cAFM transition and suggest that both phases coexist in the low-field region.
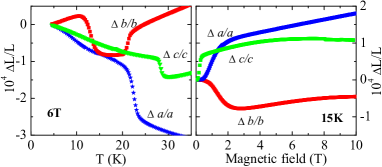
In Fig. 3 we compare the relative length changes as a function of field and temperature for all three axes. The axis behaves similar to the axis. The anomalies of have the same signs but smaller magnitudes as compared to those of and, moreover, their position for the same field (temperature) is located at higher (lower ). Since in all cases we applied , the latter difference signals the anisotropy with respect to the field direction. Our results (not shown) for and for other fields and temperatures, respectively, are very similar to those obtained for the axis. In particular, the distinct expansion at the ICAFM-to-cAFM transition as a function of field or temperature is only present for T. The hysteresis is also strong for , but less pronounced than for (see Fig. 5). A different phenomenology is observed for for . Firstly, the anomalies at the ICAFM-to-cAFM transition are of opposite signs and, secondly, an additional anomaly occurs at a lower temperature.
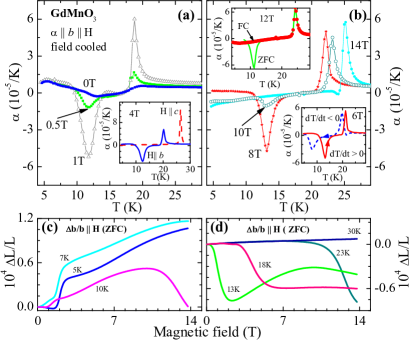
In Fig. 4 we present for different . Again, a very pronounced anomaly evolves around K in small fields and shifts to higher with further increasing field. The behavior of is analogous to our results on and , only the signs of the anomalies are different. In contrast to and , however, an additional, very pronounced anomaly develops around 12 K in finite fields. Based on the polarization data of Ref. Kimura et al., 2005, we attribute this anomaly to the FE ordering at . As a further verification we have also measured in a transverse magnetic field and did not find such an additional anomaly (see inset of Fig. 4a). As shown in the lower inset of Fig. 4b the transition to the FE phase is also of first-order type with a broad hysteresis. With further increase of the magnetic field above 8 T the magnitude of the anomaly decreases again and vanishes around 12 T. This disappearance is a consequence of the strong hysteresis of the FE transition and occurs only in the FC measurements of . The upper inset of Fig. 4b compares the FC and zero-field-cooled (ZFC) measurements of for T . The ZFC curve displays a large anomaly at , which is absent in the FC curve. This difference arises from a decreasing with increasing field. When the lower is smaller than our lowest measurement temperature of K the FE phase cannot be reached in a FC run and, consequently, there is no anomaly in the subsequent measured with increasing . The FE phase can, however, be entered by cooling the sample in a lower field, e.g. 6 T (see lower inset of Fig. 4b), or in a ZFC run when the field is applied at the lowest temperature. Due to the large hysteresis the sample remains in the FE phase up to high fields and therefore the ZFC curves show anomalies at the upper when the FE phase is left upon heating.
The lower panels (c) and (d) of Fig. 4 show the magnetostriction. In agreement with the negative signs of the anomalies we observe a pronounced contraction at the field-induced ICAFM-to-cAFM transition for K. At lower we still find clear anomalies, however, of opposite sign. This sign change results from the fact that below about 10 K the FE phase is entered, which has a significantly longer axis than both, the cAFM phase and a low- extrapolation of the ICAFM phase (see Fig. 3). The strong decrease of at 10 K for T signals a field-induced FE-to-cAFM transition due to the above-mentioned negative slope of the boundary.
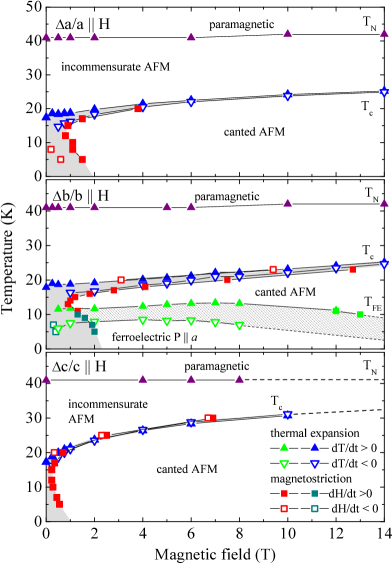
Based on our measurements of and with for all three crystallographic axes we derive the phase diagrams presented in Fig. 5. The weak field dependence of K well agrees with previous results.Kimura et al. (2005) The new feature of our phase diagram is the down-bending of the ICAFM-to-cAFM phase boundary at low magnetic field. This transition exhibits a strong hysteresis and we conclude that the ICAFM and the cAFM phases coexist in the low-field low-temperature region. Such a coexistence can naturally explain why the zero-field curves only show some broad anomalous features around 18 K instead of the distinct anomalies which signal the transition from the cAFM to the ICAFM phase for larger fields. This conclusion is also supported by measurements of the polarization showing that the magnitude of in this hysteretic region is much smaller than both, for larger and of MnO3 with and Dy.Kimura et al. (2005)
As shown in Fig. 4a the magnitudes of the anomalies at and simultaneously evolve between 0 and 1 T. This correlation suggests that the ICAFM-to-cAFM transition is a precondition for the FE ordering. As mentioned above the notation ’cAFM’ should be treated with some caution, because the magnetic structure of GdMnO3 has not yet been unambiguously determined. In a simplified picture, the proposed structure can be described as follows: the Mn moments are oriented approximately along with some canting towards , along the () direction neighboring moments are essentially parallel (antiparallel) with respect to each other, and along an incommensurate modulation of the moments is present above and vanishes below . This view is supported by the phase diagram, since the stabilization of the cAFM phase is most pronounced for as it is expected for a cAFM phase with a weak ferromagnetic moment pointing along already in zero field. A field along also points approximately perpendicular to the Mn moments, and one can therefore expect that the Mn moments (and also the weak ferromagnetic moment) are slightly canted towards . However, a more drastic change is expected for , since 50% of the Mn moments are oriented roughly antiparallel to . In simple antiferromagnets this configuration usually leads to a spin-flop transition, i.e. the Mn moment would jump to the plane and cant towards . Such a configuration would be analogous to those for or and according to Ref. Mostovoy, 2005 none of these configurations would lead to a finite polarization via a coupling of the magnetic and ferroelectric order parameters. However, in view of the more complex magnetic structures observed in neighboring MnO3, one may speculate that a similar complex structure could be induced in GdMnO3 for , and this might explain the finite FE polarization via a coupling between AFM and FE order parameters.Mostovoy (2005); Kenzelmann et al. (2005) Hence, there is need for a detailed determination of the magnetic structure of GdMnO3.
In summary, we have presented a study of the magnetic-field temperature phase diagram of GdMnO3 via thermal expansion and magnetostriction measurements. We find that both, the ICAFM-to-cAFM as well as the FE transition are of first-order type and strongly hysteretic. The hysteresis is most pronounced in the low-field range. We find a down-bending of the ICAFM-to-cAFM phase boundary and evidence for coexisting ICAFM and cAFM phases in this low-field range.
We acknowledge fruitful discussions with D. Khomskii. This work was supported by the Deutsche Forschungsgemeinschaft through SFB 608. JAM is supported by the Alexander von Humboldt Stiftung.
References
- Kimura et al. (2003a) T. Kimura et al., Nature 426, 55 (2003a).
- Goto et al. (2004) T. Goto et al., Phys. Rev. Lett. 92, 257201 (2004).
- Fiebig et al. (2002) M. Fiebig et al., Nature 419, 818 (2002).
- Kimura et al. (2005) T. Kimura et al., Phys. Rev. B 71, 224425 (2005).
- Kimura et al. (2003b) T. Kimura et al., Phys. Rev. B 68, 060403(R) (2003b).
- Hemberger et al. (2004) J. Hemberger et al., Phys. Rev. B 70, 024414 (2004b).
- Arima et al. (2005) T. Arima et al., Phys. Rev. B 72, 100102(R) (2005).
- Kuwahara et al. (2005) H. Kuwahara et al., Physica B 359, 1279 (2005).
- (9) According to Ref. Goto et al., 2005 this discrepancy could also arise from weak oxygen off-stoichiometries in different crystals.
- Kadomtseva et al. (2005) A. Kadomtseva et al., Sov. Phys. JETP Lett. 81, 22 (2005).
- Lorenz et al. (1997) T. Lorenz et al., Phys. Rev. B 55, 5914 (1997).
- Mostovoy (2005) M. Mostovoy, Phys. Rev. Lett. 96, 067601 (2006).
- Kenzelmann et al. (2005) M. Kenzelmann et al., Phys. Rev. Lett. 95, 087206 (2005).
- Goto et al. (2005) T. Goto et al., Phys. Rev. B 72, 220403(R) (2005).