Nematic-Isotropic Spinodal Decomposition Kinetics of Rod-like Viruses.
Abstract
We investigate spinodal decomposition kinetics of an initially nematic dispersion of rod-like viruses (fd virus). Quench experiments are performed from a flow-stabilized homogeneous nematic state at high shear rate into the two-phase isotropic-nematic coexistence region at zero shear rate. We present experimental evidence that spinodal decomposition is driven by orientational diffusion, in accordance with a very recent theory.
pacs:
82.60.Lf,82.70.Dd,64.70.Md,83.80.XzI Introduction
Systems that are quenched into a state where at least one order parameter is unstable undergo spinodal phase separation. Here, the initially homogeneous system is unstable against fluctuations of arbitrary small amplitude, and phase separation sets in immediately after a quench. In the initial stage of phase separation an interconnected ”labyrinth structure” of regions with somewhat higher and lower values of the order parameter is observed. For systems containing spherical particles the relevant order parameter is the concentration. As Onsager showed in 1949[1], the situation is different when the particles are not spherical in shape, i.e. disk-like or elongated particles. Here the system can become unstable or meta-stable with respect to fluctuations in orientation. These orientational fluctuations drive concentrations differences, resulting in a phase with high concentration and orientational order, the nematic phase, and a phase with low concentration and no orientational order, the isotropic phase. For very long and thin rods with short-ranged repulsive interactions, the binodal concentrations, i.e. the concentrations of the isotropic and nematic phases in equilibrium after phase separation is completed, have been determined using different approximations in minimizing Onsager’s functional for the free energy (see ref. [2] and references therein), while for shorter rods computer simulations have been performed to obtain binodal concentrations [3, 4]. The spinodal concentration, where the isotropic phase becomes unstable has been obtained [1, 5].
Recently, a microscopic theory was developed by one of the authors, describing the initial stage of the kinetics of spinodal decomposition (SD) [6]. It is shown there that demixing is dominated by rotational diffusion and not by translational diffusion as suggested in earlier work [7, 8]. This is in line with results based on Ginzburg-Landau equations of motion, where the importance of the coupling between concentration and orientation was studied [9, 10] for rod-polymer mixtures.
Signatures of SD have been observed for suspensions of boehmite rods, by homogenizing a phase separated system and sequential polarization microscopy and Small Angle Light Scattering (SALS) measurements [11]. For such experiments, however, there is always an experimental lapse time between homogenization and the first moment of observation. In these experiments the initial state is not well defined. Ideally one would like to perform a concentration quench from low or high concentration into the two-phase region, where the initial state is isotropic or nematic, respectively. In a recent paper such a kind of ’quench’ was performed by inducing polymerization of short actin chains [12]. Alternatively, external fields like shear flow [13] or magnetic fields [14] can be used to achieve well-defined quenches. Switching on or turning off such an external field can take the initially homogeneous system into either an unstable or meta-stable state.
In this paper we induce a nematic phase with a well defined director by imposing shear flow to a dispersion of colloidal rods. At a sufficiently high shear rate, the fully nematic, homogeneous state is stable. The shear flow is then suddenly switched off, after which the system becomes either unstable or meta-stable. As a system we use suspensions of fd-viruses, which are mono-disperse and very long and thin somewhat flexible particles. The equilibrium phase behavior for these semi-flexible rods as far as the binodal points are concerned, is well understood on the basis of Onsager theory, extended to include charge and flexibility [15, 16]. Polymer is added to the dispersion in order to widen the region of isotropic-nematic phase coexistence, which renders phase separation experiments feasible [17]. In a previous study we obtained the spinodal point that separates the unstable and meta-stable region relevant for the initial state in the experiments described in the present paper [18]. In the present paper, experiments are performed at concentrations such that the cessation of shear will render the system unstable. We interpret our data on the basis of the recent microscopic theory [6] mentioned above. Experimental evidence is given that phase separation is indeed driven by orientational ordering, which enslaves the concentration. We use confocal microscopy to confirm that demixing is indeed proceeding via spinodal decomposition, rather than nucleation and growth, through the observation of an initial interconnected structure of inhomogeneities. In addition we also use SALS experiments because these have a better time resolution and a better statistics. The present experiments are qualitative in the sense that only the specific wave vector dependence of the unstable eigen mode is discussed, without systematically varying the amount of added dextran which leads to attraction between the rods.
This paper is organized as follows. First we give a brief overview of the microscopic theory on SD of rod dispersions [6], leading to predictions that will be tested experimentally. After the section on materials and methods, experimental results are presented for both techniques. In the discussion we analyze our results using the predictions of the microscopic theory.
II Theory
The time-evolution of the probability density function (pdf) of the orientations and positions of an assembly of rods is described by the so-called Smoluchowski equation. From this microscopic equation of motion, an equation of motion for the number density of rods at with orientation at time can be derived by integration [6],
| (1) | |||||
Here, and are the orientationaly averaged translational diffusion coefficient and rotational diffusion coefficient of a non-interacting rod, respectively. The orientational dependence of the translational diffusion coefficient of a non-interacting rod is described by the tensor . Furthermore, is the rotational operator with respect to , where is the gradient operator with respect to the cartesian coordinates of . For very long and thin rods with hard-core interactions, the average force and torque on a rod with position and orientation due to interactions with other rods are given by,
| (2) |
where the ”effective potential”,
| (3) |
has been introduced earlier by Doi and Edwards [19].
In order to describe initial decomposition kinetics, the density is written as,
| (4) |
where is the small deviation with respect to the initial probability density function , with the average number density of rods. Note that is generally a function of time, which reflects the temporal evolution of alignment of the otherwise homogeneous system. Although we treat in this paper a quench from the nematic state, we will now proceed by assuming that the initial state is isotropic. Non-isotropic initial states require numerical analysis, since an appropriate (non-linear) equation of motion for should be solved simultaneously to the equation of motion for [6]. The general features of demixing are probably not very different for the different initial states.
During the initial stage of demixing, can be expanded up to second order in spherical harmonics as,
| (5) |
The scalar is proportional to the local number density of rods, while the tensor describes the development of orientational order during demixing. As will turn out, the number density is enslaved by the orientational contribution .
Using these definitions in the equation of motion Eq.(1), the corresponding equations of motion for and can be derived. These equations can be solved, leading to,
| (6) |
where is the volume fraction of rods, and and are their length and thickness, respectively. Furthermore, is the unit vector along the wave vector , and is the eigen value related to the unstable mode, which is equal to,
| (7) |
Note that for , this eigen value is negative for sufficiently small wave vectors, so that, according to eq.(II), inhomogeneities with the corresponding wave length will grow in time without any time delay. This concentration marks the location of the isotropic-to-nematic spinodal and is in accordance with Onsager’s prediction [1].
The proportionality of the density to the orientational contribution in Eq.(II) reflects the enslavement of density to orientational order during demixing. That is, the transition is driven by orientational diffusion rather than translational diffusion.
Although Eq.(7) has been derived for an initial isotropic distribution, we think that the main conclusion, i.e. orientational fluctuations dominate the phase separation, is also valid for phase separation starting from the nematic state.
In a scattering experiment the total scattered intensity is related to the quantities and as,
| (8) |
As for gas-liquid spinodal demixing suspensions of spheres, the scattered intensity during isotropic-nematic demixing suspensions of rods exhibits a ring-like pattern where a particular finite wavevevector grows most rapidly. The occurrence of a maximum in the scattered intensity at finite wavevectors during demixing has a fundamentally different origin for demixing rods as compared to spheres. For gas-liquid demixing of suspensions of spheres, the eigenvalue (here referred to as ) itself exhibits an extremum at a finite wavevector. For spheres is of the form , where and are wavevector-independent, positive coefficients [20, 21]. The prefactor signifies the fact that diffusion of spheres over long distances takes longer times, while signifies the stabilization of large concentrations gradients. It is easily verified that an eigenvalue of this form exhibits an extremum at a finite wavevector. For gas-liquid demixing of suspensions of spheres this maximum in the growth rate results in the maximum in the scattering pattern. For the isotropic-nematic demixing of suspensions of rods, the eigenvalue is of the form (see eq.(7), that is, the prefactor as compared to spheres is missing here. As a consequence remains finite at zero wavevectors. This difference in wavevector dependence of the eigenvalue for gas-liquid and isotropic-nematic demixing is due to the fact that gas-liquid demixing is governed by translational diffusion while isotropic-nematic demixing is (predominantly) governed by rotational diffusion. The maximum in the scattering pattern is now due to the combination of the wavevector dependence of the eigenvalue and the wavevector dependent prefactors to the time-exponent. Note that according to eq.(8), the prefactor of the time-exponent is indeed , rendering the scattered intensity equal to zero at zero wavevector, which expresses conservation of the number of rods. The -dependence of can be tested experimentally using the fact that, according to Eqs.(II,8), the scattered intensity is . Hence,
| (9) |
The slope of a plot of as a function of for a given wave vector is thus equal to for that particular wave vector. Repeating this for various wave vectors allows to construct the wave vector dependence of .
In addition, the critical wave vector above which the system becomes stable, that is, where becomes positive, is equal to,
| (10) |
For shallow quenches, that is, for concentrations where the is close to , the critical wave vector is thus relatively small. That is, shallow quenches result in relatively large scale inhomogeneities while deeper quenches give rise to relatively small scale inhomogeneities.
In this paper we prepare an initial nematic state, by shearing a suspension at large enough shear rate such that the induced nematic phase is stable against phase separation (see ref.[22] for a discussion of the bifurcation diagram for sheared systems), and then quench to zero shear rate. Since the orientation of the rods dominates the phase separation, it is expected that phase separation takes place anisotropically for an initial nematic state. In the following we will test this assumption and also the predictions made above for the isotropic-nematic SD, which we believe to hold true also for the nematic-isotropic SD.
III Materials and Methods
As model colloidal rods we use fd-virus particles which were grown as described in ref.[17]. The physical characteristics of the bacteriophage fd are: length ; diameter ; persistence length . A homogeneous solution of fd-virus and of dextran (507 kd, Sigma-Aldrich, radius of gyration of ) in tris buffer at with NaCl is allowed to macroscopically phase separate. Without dextran the binodal concentrations are and for the isotropic and nematic phase, respectively. Due to the added dextran, the binodal points shift to and , respectively. The lower spinodal point for this sample was found to be equal to 24.71.1 , as determined in a previous paper [18]. We prepared three dispersions by mixing a known volume of coexisting isotropic and nematic bulk phases of the quiescent dispersion. In this way, the osmotic pressure is independent of the varying ratio of dextran to fd-virus concentration. The mixing ratios of isotropic and nematic phases are chosen such that a quench from the nematic phase under flow will always render the aligned system unstable without flow, that is, the fd concentration is larger than the lower binodal concentration and smaller than the lower spinodal concentration [18]. The fd concentrations are denoted here after as , where relates to the fraction of the concentration between the lower binodal and spinodal. The concentrations used in the present study are : , and . For the SALS measurements the concentration of fd and dextran were and , respectively. Due to the fact that we used different concentrations of dextran for the different experiments, we cannot directly compare SALS data to the microscopy data.
For the microscopy experiments we used a home-built counter rotating cone-plate shear cell, placed on top of a Leica TCS-SP2 inverted confocal microscope. This cell has a plane of zero velocity in which objects remain stationary with respect to the microscope while shearing. For details of the setup we refer to ref.[23]. For the measurements described here we used confocal reflection mode at a wavelength of . Quench experiments were done as follows. Samples were first sheared at a high rate of for several minutes. The shear was then suddenly stopped, after which images were recorded at regular time intervals. For the SALS measurements we used a home made cylindrical optical shear cell. The rotating hollow inner cylinder has a radius of , the gap width is . The shear cell is placed in a cylindrical toluene bath with the second gap of the cell exactly in the middle of the bath. A He-Ne laser (Melles-Griott) with a wavelength of was used as a light source. The laser beam is directed along the gradient direction through one single gap using a periscope system, which is inserted into a silicon oil filled inner cylinder at a fixed position. In this way the flow-vorticity plane is probed. Scattered intensities are projected on a white screen, with a beam-stop in the middle . The size of the beam-stop corresponds to a scattering angle of and a wave vector of . Images were taken in transmission with a peltier cooled 12 bit CCD camera, with 582x782 pixels (Princeton Instruments, microMAX). The maximum scattering angle was , which corresponds to a wave vector of .
IV Experimental Results
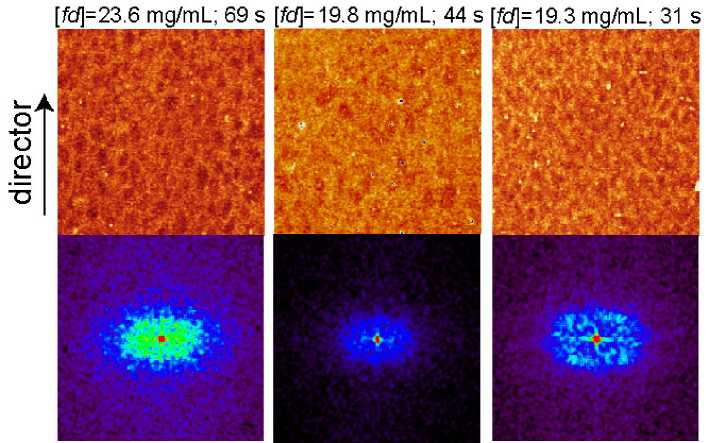
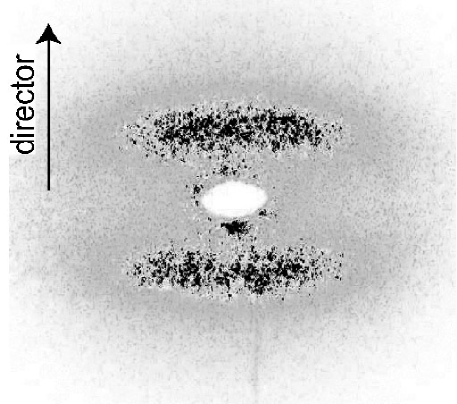
Confocal images of the morphology during spinodal decomposition in the early stage after a shear rate quench for different concentrations are given in the top row in Fig.1 while in the bottom the corresponding Fourier transforms are plotted. The observed ring-like scattering patterns, typical for spinodal decomposition, are anisotropic with symmetry around the nematic director which is along the flow direction. The same anisotropy is observed in the SALS measurements, where such Fourier space images are directly probed (see Fig.2).
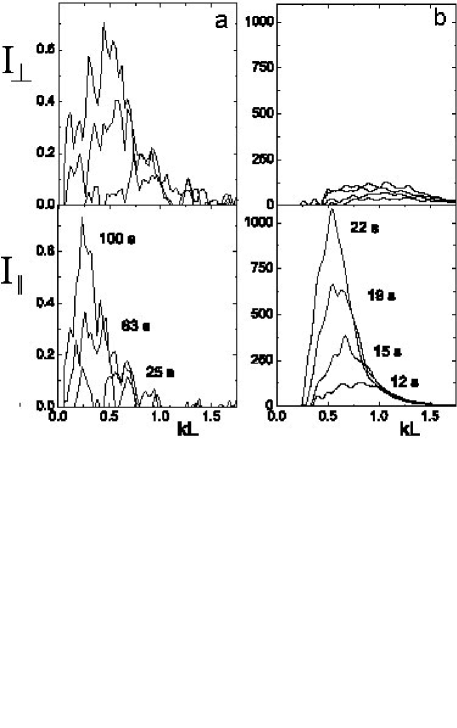
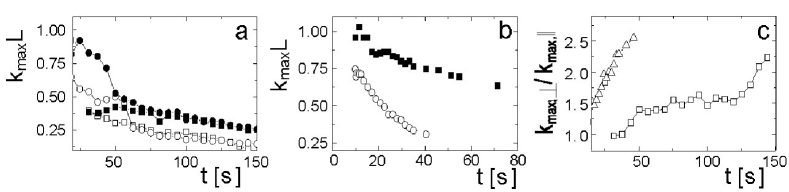
Cross sections of the Fourier transforms and scattering patterns parallel and perpendicular to the director are given in Fig.3 a and b, respectively. From these profiles we obtain the wave vector at which the Fourier transform exhibits its maximum, , quantifying the wavelength of the fastest growing Fourier component of the inhomogeneous morphology. The values for for directions parallel and perpendicular to the director as obtained from such cross sections of the Fourier transform of the confocal images and the SALS patterns are plotted as a function of time in Fig.4a and b, respectively. The ratio of perpendicular and parallel to the director is plotted in Fig.4c. This figure thus characterizes the anisotropy in the morphology. Since this ratio is larger than one, the typical size of inhomogeneities perpendicular to the director is smaller than the size of inhomogeneities in the direction parallel to the director.
Comparing the profiles obtained from microscopy and from SALS, it is obvious that the SALS signal is less noisy. This is due to the fact that the volume that is being probed by microscopy is much smaller than the volume probed by SALS. On the other hand, due to the beam stop the profile starts at higher k-values than the profiles obtained from microscopy. The large difference in the scattered intensity parallel and perpendicular to the flow direction is also observed under identical conditions for isotropic systems, and is caused by the experimental set-up[24].
V Discussion
The main result of the theoretical treatment in section II for SD of a dispersion of rods is expressed by Eq.(II). This equation shows that changes in the concentration of rods are enslaved by changes in the orientation of the rods. Although the treatment was done for an initially isotropic state we believe that this result is valid independent of the initial condition. This relation between concentration and orientation has a few consequences, which can be tested experimentally:
1) as for spheres there is no demixing for ;
2) but the driving force of phase separation given by goes to a constant value for and not to zero as would have been the case when translational diffusion dominates phase separation kinetics (see the exponent in Eq.(II)). As a result shifts in time also in the initial stage of demixing;
3) shallow quenches result in relatively large scale inhomogeneities while deeper quenches give rise to relatively small scale inhomogeneities, see Eq.(10).
All micrographs in images Fig.1 show interconnected structures typical for spinodal decomposition. The resulting Fourier transforms in Fig.1 as well as the SALS pattern in Fig.2 are slightly elongated in the direction of the director. The observation of a ring structure confirms the prediction that the scattered intensity is zero for , i.e. that there is no demixing for (see also the cross sections in Fig.3). As pointed out in the theory section this is a general feature of SD, and it is a consequence of the conservation of the number of rods. The anisotropy in the morphology as well as in the growth rates, see Fig.4c, show that the formation of inhomogeneities is affected by the initial orientation of the rods. The anisotropy in the phase separation is also seen in the case of nucleation-and-growth, where we observed that the nucleating tactoids of isotropic phase are oriented along the director of the nematic background phase [18]. This anisotropy is due to residual alignment after the quench of the initially strongly sheared suspension.
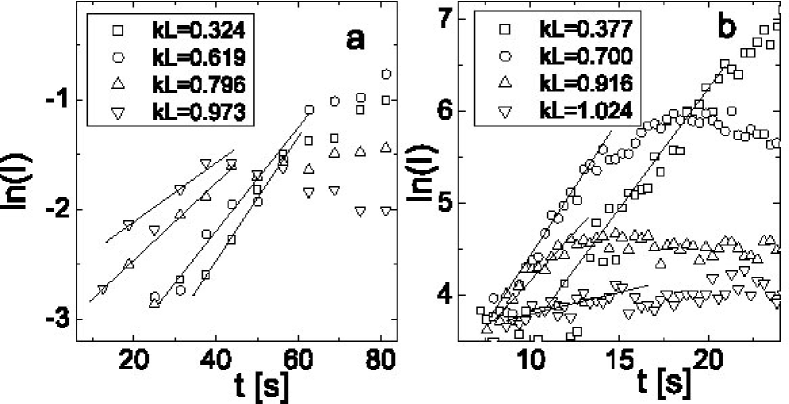
When plotting the wave vector where the intensity ring exhibits its maximum, i.e. , as a function of time, it is readily seen that this maximum shifts to smaller values also during the initial stage of demixing right after the quench (see Fig. 4). That the initial stage of demixing is probed follows from Fig.5, where the logarithm of the intensity is plotted versus time. In the initial stage this relation should be linear (see Eq.(9)), which is indeed seen to be the case for all values of . The initial stage of the SD ends where this curve starts to deviate from linearity. For more shallow quenches closer to the spinodal, at higher concentrations, the initial stage extends up to 100 seconds.
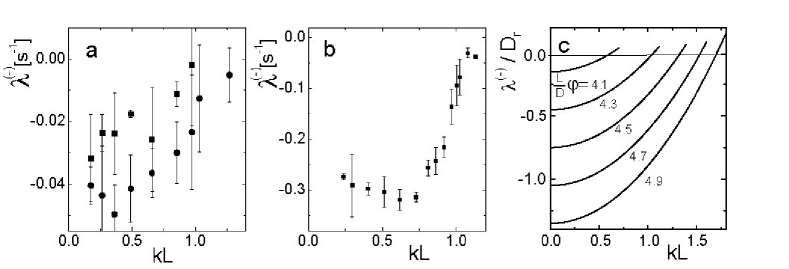
More importantly, for each value of we obtain the phase separation rate from the slope of the curve (see Eq.(9)). The resulting curves of vs. are plotted in Fig.6 for two different confocal microscopy samples (a) and the SALS sample (b). Clearly, approaches a finite value for , as was predicted by theory, see Fig.6c. This shows that the demixing kinetics is dominated by rotational diffusion. The absolute value for is about a factor ten higher for the SALS experiment than for the microscopy experiments, which is probably due to the lower dextran concentration that has been used in the microscopy experiment as compared to the SALS experiment. The analysis we used for our data could in principle also be applied to the measurements of van Bruggen et al. [11], where a similar behavior of the SALS patterns is observed.
Fig.4a also confirms the theoretical prediction in Eq.(10) that the initial inhomogeneities are larger for shallow quenches than for deep quenches. The length scale of the initially formed structures for the deep quench (circles,) is 11 times the rod length in the direction parallel to the initial director and 7.1 times the rod length in the direction perpendicular to the initial director. For the shallow quench (squares, ) the initial structure is barely anisotropic and has a typical size of 17 times the rod length. After about one minute the typical sizes for both concentrations start to overlap.
Finally we would like to remind that the theory presented in section II is valid for repulsive rods. In our experimental system, however, depletion attractions between rods are induced by adding dextran. On adding more dextran, translational diffusion could play a more important role during phase separation. Rod-polymer mixtures has been treated on the basis of Ginzburg-Landau equations of motion with a thermodynamics input, amongst others, by Liu and Fredrickson [9], Matsuyama et al.[10], and by Fukuda [25]. In these papers it is shown that translational diffusion indeed becomes more important on increasing the polymer concentration. This results in a minimum in as a function of the wave vector at sufficiently high polymer concentration. We therefore believe that the pronounced minimum that is observed for the SALS measurement, see Fig.6b, is related to attractions between the rods as induced by the added dextran. The two microscopy measurements depicted in Fig.6a are done at a lower overall dextran concentration. The sample with the somewhat lower fd concentration, i.e. higher polymer concentration, shows a less pronounced minimum as compared to the SALS sample, while for the sample with the lowest polymer concentration no minimum is present. These observations confirm the theoretical prediction on the polymer dependence of the phase separation kinetics. In future studies we will systematically vary the polymer concentration for a fixed concentration of fd.
VI Conclusion
We studied the nematic-isotropic SD of dispersions of fd-virus particles with added polymer after shear quenches into the two-phase region for varying concentrations. We exemplified the fundamental difference between spinodal decomposition of dispersions of rods and spheres using a recently developed theory. The main difference is that in the case of rods the phase separation is dominated by rotational diffusion. As a result the eigen value , which quantifies the rate of the phase separation, approaches a non-zero constant value for , contrary to gas-liquid demixing of spheres where the corresponding eigen value becomes zero for . This is due to the fact that for rods a local reorientation is sufficient to start the phase separation, whereas for spheres translational diffusion over finite distances is needed. We found experimentally the same -dependence of as predicted by theory [6, 9, 10]. Our experiments thus confirm that demixing is dominated by rotational diffusion and not by translational diffusion as suggested in earlier work [7, 8]. In addition, we found a possible effect of translational diffusion through the minimum of the wave vector dependence of the unstable eigen mode, due to attractions between the rods as induced by the added dextran refs. [9, 10]. This will be subject of further investigations.
Acknowledgement
This work was performed within the framework of the Transregio SFB TR6 ”Physics of colloidal dispersions in external fields” and the European Network of Excellence Soft Matter Composites (SoftComp).
References
- [1] L. Onsager. The effect of shape on the interaction of colloidal particles. Annals of the New York academy of science, 51:62–659, 1949.
- [2] G. J. Vroege and H. N. W. Lekkerkerker. Phase transitions in lyotropic colloidal and polymer liquid crystals. Rep. Prog. Phys., 55:1241–1309, 1992.
- [3] P. Bolhuis and D. Frenkel. Tracing the phase boundaries of hard spherocylinders. J. Chem. Phys., 106(2):666–687, 1997.
- [4] H. Graf and H. Löwen. Phase diagram of tobacco mosaic virus solutions. Phys. Rev. E, 59(2):1932–1942, 1999.
- [5] R. F. Kayser Jr. and H. J. Raveché. Bifurcation in onsager’s model of the isotropic-nematic transition. Phys. Rev. A, 17:2067–2072, 1978.
- [6] J. K. G. Dhont and W. J. Briels. Isotropic-nematic spinodal decomposition kinetics. Phys. Rev. E, 72:031404, 2005.
- [7] J. W. Winters, Th. Odijk, and P. van der Schoot. Spinodal decomposition in a semidilute suspension of rodlike macromolecules. Phys. Rev. E, 63:011501–1, 2000.
- [8] T. Maeda. Matrix representation of the dynamical structure factor of a solution of rodlike polymers in the isotropic phase. Macromolecules, 22:1881–1891, 1998.
- [9] A. J. Liu and G. H. Fredrickson. Phase separation kinetics of rod/coil mixtures. Macromolecules, 29:8000–8009, 1996.
- [10] A. Matsuyama, R. M. L. Evans, and M. E. Cates. Orientation fluctuation-induced spinodal decomposition in polymer liquid-crystal mixtures. Phys. Rev. E, 61(3):2977–2986, 2000.
- [11] M. P. B. van Bruggen, J. K. G. Dhont, and H. N. W. Lekkerkerker. Morphology and kinetics of the isotropic-nematic phase transition in dispersions of hard rods. Macromolecules, 32:2256–2264, 1999.
- [12] J. Viamontes and J. X. Tang. Formation of nematic liquid crystalline phase of f-actin varies from continuous to biphasic transition. http://arxiv.org/abs/cond-mat/0506813, 2005.
- [13] T. A. J. Lenstra, Z. Dogic, and J. K. G. Dhont. Shear-induced displacement of isotropic-nematic spinodals. J. Chem. Phys., 114(22):10151–10162, 2001.
- [14] J. Tang and S. Fraden. Magnetic-field-induced phase transition in a colloidal suspension. Phys. Rev. Lett., 71(21):3509–3512, 1993.
- [15] J. Tang and S. Fraden. Isotropic-cholesteric phase transition in colloidal dispersions of filamentous bacteriophage fd. Liquid Crystals, 19(4):459–467, 1995.
- [16] Z. Y. Chen. Nematic ordering in semiflexible polymer chains. Macromolecules, 26:3419–3423, 1993.
- [17] Z. Dogic, K. R. Purdy, E. Grelet, M. Adams, and S. Fraden. Isotropic-nematic phase transition in suspensions of filamentous virus and dextran. Phys. Rev. E, 69:051702, 2004.
- [18] M.P. Lettinga, K. Kang, A. Imhof, D. Derks, and J.K.G. Dhont. Kinetic pathways of the nematic-isotropic phase transition of rod-like viruses. J. Phys.: Condens. Matter, 17:S3609 S3618, 2005. The dextran concentration given in this paper was for hydrated dextran. Dehydrated dextran had a concentration of .
- [19] M. Doi and S. F. Edwards. The Theory of Polymer Dynamics. Oxford, 1986.
- [20] J. W. Cahn. Phase separation by spinodal decomposition in isotropic systems. J. Chem. Phys., 42(1):93–99, 1965.
- [21] J. Kojima, M. Takenaka, Y. Nakayama, and T. Hashimoto. Early stage spinodal decomposition in polymer solution under high pressure. Macromolecules, 32:1809–1815, 1999.
- [22] J. K. G. Dhont and W. J. Briels. Viscoelasticity of suspensions of long, rigid rods. Colloid Surface A, 213(2-3):131–156, 2003.
- [23] D. Derks, H. Wisman, A. van Blaaderen, and A. Imhof. Confocal microscopy of colloidal dispersions in shear flow using a counter-rotating cone plate shear cell. J. Phys.: Condens. Matter, 16:S3917–S3927, 2004.
- [24] P. Holmqvist, M. P. Lettinga, J. Buitenhuis, and J. K. G. Dhont. Crystallization Kinetics of Colloidal Spheres under Stationary Shear Flow. Langmuir, 21:10976-10982, 2005.
- [25] J. Fukuda. Phase separation kinetics of liquid crystalline polymers: Effect of orientational order. Phys. Rev. E, 59(3):3275–3288, 1999.