Thermally-activated charge reversibility of gallium vacancies in GaAs
Abstract
The dominant charge state for the Ga vacancy in GaAs has been the subject of a long debate, with experiments proposing 1, 2 or 3 as the best answer. We revisit this problem using ab initio calculations to compute the effects of temperature on the Gibbs free energy of formation, and we find that the thermal dependence of the Fermi level and of the ionization levels lead to a reversal of the preferred charge state as the temperature increases. Calculating the concentrations of gallium vacancies based on these results, we reproduce two conflicting experimental measurements, showing that these can be understood from a single set of coherent LDA results when thermal effects are included.
pacs:
65.40.Gr, 61.72.Ji, 71.15.MbI Introduction
There has been a long-standing controversy about the nature of the charge state of the gallium vacancy () mediating self-diffusion in GaAs. While experiments have deduced a preferred charge state ranging from 1 and 2 4Bra99_2 to 3 4Geb03 ; 4Tan93 under N-type or intrinsic conditions, most (zero temperature) ab-initio calculations favor the 3 charge state for , see Ref. 4Elm05 ; 4Zha91 ; 4Laa92 ; 4Che94 ; 4Seo95 ; 4Nor93 ; 4Poy96 ; 4Sch02 ; 4Jan03 ; 4Jan89 ; 4Bar85 . Extracting the charge state from experiments is challenging: these are usually performed at high temperature, in a regime where the formation entropy becomes a significant part of the Gibbs free energy. These entropic contributions can therefore alter the charge of the dominant species as calculated at , leading to a strong competition between the charge states. Moreover, the separate ionization energy for each state is not directly accessible experimentally; only the sum over the ionization free energies can be obtained by fitting the experimental data over a range of temperatures, using a number of assumptions typically inspired from ab-initio data 4Geb03 ; 4Tan93 or set as free parameters in the fit 4Bra99_2 .
Since the ionization free energies are key for fitting experimental data, it is important to evaluate them from ab-initio calculations. Because of the high computational cost associated with computing vibrational spectra 4Raul04 , however, various assumptions are made typically to simplify the problem. For example, it is usually assumed that the free energy of ionization is independent of temperature and that ionization levels are constant with respect to the valence band edge so that the formation entropy of all charge defects is taken as equal to that of 4Boc96 . Often, it is also supposed that ionization energies follow the thermal behavior of band gap (or the conduction band minimum) 4Van76 , which results typically into shallower ionization levels with increasing temperature (within this approximation, for example, heavily charged defects in Si become favored at high T 4Dev03 ).
In this article, we revisit the question of the dominant charge state of in GaAs, calculating directly, using LDA, the ionization Gibbs free energies () for all possible charge state transitions, using an approach applied to SiC 4Raul04 and Si 4San05 . We show that, in spite of well known LDA limitations, apparently conflicting data coming from two experiments performed under different conditions 4Bra99_2 ; 4Geb03 are well fitted. This satisfactory fit is obtained for both experimental data by using the same set of inputs like the concentration model, the Fermi level effect and the computed temperature dependence of .
This article is organized as follows: calculation details are presented in section II, next we analyze the source of conflict that arose between different experiments in section III, presenting at the same time the common concentration and diffusion models used. Section IV contains a discussion of phonon calculation results followed by our fitting procedure and its application on two experimental data. The main conclusions are presented in section V.
II Computational details
From the computational point of view, the stability of is determined by comparing total energies of supercells with and without defects. In a previous ground state ab-initio calculation using SIESTA, a local-basis LDA code 4Elm05 , we computed the ionization levels of gallium vacancies for 0, 1, 2, 3 charges.
Here, we include the thermal contributions by computing the Gibbs free energies in the harmonic limit. Note that entropy changes in bulk Ga and As metals is accounted for (see Refs. 4Raul03 ; 4Raul04 as well as Ref. 4Elm05 for more details):
| (1) |
where, at constant number of particles and volume, the vibrational energy and entropy are given, respectively, by
| (2) |
and
| (3) |
To obtain the Gibbs free energy, the phonon spectrum () is computed for all stable charge states of using a numerical derivative to construct the dynamical matrix.
The calculation of the dynamical matrix of cells with 215 sites is a very time-consuming task. Since many atomic shells around the vacancy are distorted it is not possible to reduce the number of calculations by symmetry operations. We thus use the full dynamical matrix for the complete supercell. A mesh cutoff of 120 Ry is used and the Brillouin zone of the 215-atom cubic supercell is sampled at the -point. The eigen frequencies are then extracted at 146 k-points in the Brillouin zone 4San05 .
Except for the splitting of the optical branches at the -point, which cannot be obtained in the harmonic approximation, the total phonon density of states and the dispersion curve obtained by this procedure for the GaAs crystal are in good agreement with experiment and calculations 4Pet97 ; 4Str90 . Since we are interested here in the entropy difference and not its absolute value, these discrepancies should not play an important role.
III Analysis of the experimental results
Before discussing our analysis, we first focus on the source of discrepancy that exists in explaining different experiments. Although the diffusion model and the experimental Fermi level dependence used in different experiments 4Bra99_2 ; 4Geb03 are the same, conclusions about the dominant charge state of are contradictory. This contradiction can therefore be due to experimental errors or the additional assumptions about the temperature dependence of the ionization levels used in the experimental fits. The following analysis shows that the choice of the ionization levels is an important factor that suffices to explain the conflict. Some calculation details are skipped in the manuscript, we refer the reader to Refs. 4Bra99_2 ; 4Tan93 for further details on the model used.
III.1 Concentration model
Both fitting procedures used by Gebauer et al. 4Geb03 and Bracht et al. 4Bra99_2 are based on the concentration model used previously by Tan and coworkers 4Tan93 . The Ga self-diffusion coefficient is given by the sum of the transport coefficients of vacancies in various charge states :
| (4) |
where, represents the Ga atom density in GaAs (), is the diffusion correlation factor that contains information about the microscopic jump mechanism, is the thermal equilibrium concentration and is the diffusion coefficient of the vacancy for .
The thermal equilibrium concentration of in GaAs is defined as
| (5) |
where is a pre-exponential factor, is the Gibbs free energy of formation of , is temperature and and is the Boltzmann constant. This equation takes into account the influence of over-pressure (), often used in experiments, on vacancy concentrations. If the arsenic over-pressure increases, it affects the stoichiometry of gallium arsenide by introducing an excess of As atoms. With this excess of As atoms, GaAs sample can become As-rich and the concentrations of Ga vacancies in GaAs are enhanced.
Different vacancies can introduce energy levels within the energy band gap of GaAs. The occupation of these energy states depends on the position of the Fermi level. Under extrinsic conditions, when the hole or the electron concentration introduced by doping exceeds the intrinsic carrier concentration, the Fermi level deviates from its intrinsic position. As a consequence, the ratio of the charged to neutral vacancy concentrations is changed. Vacancies can introduce acceptor levels, i.e., introduces one level located at above the valence band edge, introduces one at and introduces one at above the valence band edge.
The concentration profiles measured experimentally contain contributions from all active vacancy charge states that cannot be separated. We take advantage of the fact that the Gibbs free energy of formation — and thus the equilibrium concentration — of neutral vacancies do not depend on the position of the extrinsic Fermi level. Therefore, we can express the total concentration as function of the ratio of the charged to neutral vacancy concentrations:
| (6) |
The ratios are given by:
| (7) | |||||
| (8) | |||||
| (9) |
where is approximated to unity (further explanations and intermediate steps used in this work can be found in Ref. 4Bra99_2 ).
The concentration of negatively charged vacancies can be deduced if we know the position of the Fermi level and the ionization energies . Ionization levels do not cause much problems as they are derived from available ab-initio calculation or included in the fit. However, the Fermi level depends strongly on intrinsic () and extrinsic carrier concentrations () by the relation:
| (10) |
Intrinsic properties of GaAs as function of temperature are taken from empirical data 4Bla82 , like intrinsic band gap , electron and hole concentrations ( and ) and intrinsic Fermi level . The band gap of GaAs is supposed to vary with temperature 4Thu75 , following Varshni’s 4Var67 empirical expression for GaAs deduced from optical experiments 4Bla82 . The Fermi energy is the important quantity governing the equilibrium concentrations of defects. However, it changes if any electrically active impurities or dopants are present in the material as well as under the presence of charged vacancies. The concentrations of these impurities or dopants () and vacancy concentration in all charge states () must therefore be taken into account. The charge balance equation, requiring that the free electron and hole concentrations and (which also depend on the Fermi level) must cancel out any net charge resulting from the concentrations of all positively and negatively charged defects and impurities:
| (11) | |||||
| (12) | |||||
The extrinsic Fermi level, for its part, is obtained by solving simultaneously Equations 10, 11, 7, 8 and 9 self-consistently using the Newton Raphson method 4NR . Once the Fermi level is known, it is used to determine the final Gibbs free energy of formation and the corresponding equilibrium concentrations of all the defects present in the structure. Up to this point, the procedure is sufficient to reproduce the fit of Gebauer et al. and Bracht et al. shown in Fig. 7 of Ref. 4Geb03 and Fig. 9 of Ref. 4Bra99_2 , respectively.
III.2 Diffusion model
Few steps are left to fit the measured diffusion coefficients of Bracht et al. (see the detailed discussion in Section 5.2 of Ref. 4Bra99_2 ). Based on the theoretical work of Bockstedte and Scheffler 4Boc96 , they assume that the entropy change associated with the migration and the correlation factor are similar for all charge states, i.e., and ( ). In this approximation, Eq. 4 simplifies to:
| (13) |
While the extrinsic diffusion coefficient () is unknown, it is, however, related to the intrinsic diffusion coefficient by the relation:
| (14) |
The missing quantity in this equation is . Bracht et al. use the Ga diffusion coefficient they measured in intrinsic GaAs and find , using Eqns 13, 14 and :
| (15) |
III.3 Fits of positron-annihilation measurements
From positron-annihilation experiments, Gebauer et al. 4Geb03 deduce the Gibbs free energy of formation and the dominant charge state of by measuring directly vacancy concentrations. Measures were done at different high temperatures (900-1450K) by changing dopants concentrations and the chemical potential (stoichiometry).
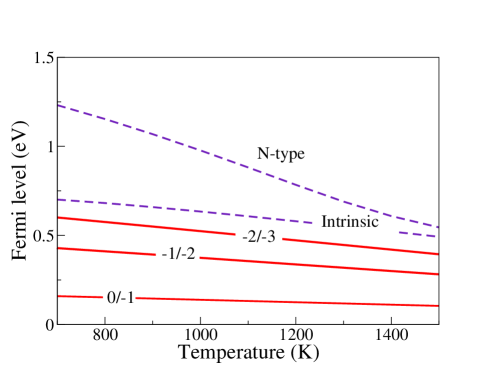
The resulting concentration profiles were fitted using the model presented above 4Tan93 using ab-initio ionization levels calculated by Baraff et Schlüter 4Bar85 at 0K corresponding to = 0.13 , = 0.35 and = 0.49. These ionization levels are supposed to vary with temperature like the band gap following Varshni’s 4Var67 empirical relation.
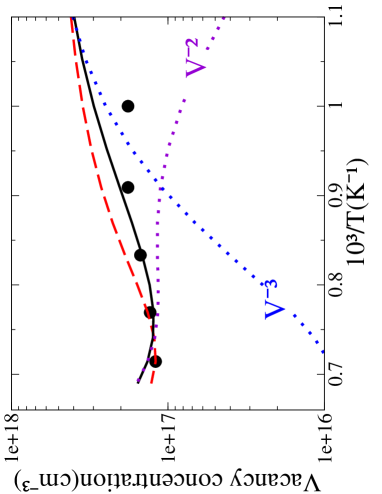
Gebauer et al. 4Geb03 fitted the concentration profiles for N-GaAs with at arsenic over pressure of = 5.6 atm for temperature ranging between 900 and 1450K. The resulting fit (corresponding to Fig. 7 of their article) is in reasonable agreement with measured concentration profiles especially at high temperature. It shows a negative temperature dependence that cannot be reproduced unless the 3 charge state dominates all other charge states.
Fig. 1 shows the variation of ionization levels used as function of temperature, the extrinsic Fermi level corresponding to the the dopant concentration used in this experiment is also shown. We can see that this choice of the ionization levels favors the stability of the charge state for N-type and intrinsic GaAs over a broad temperature range.
III.4 Fits of interdiffusion measurements
For their part, Bracht et al. 4Bra99_2 , measured interdiffusion in isotope heterostructure exposed to arsenic over pressure of atm under intrinsic and extrinsic conditions (N-type with and P-type with ). They measured the temperature dependence of the Ga self-diffusion coefficient () at high temperature ranging between 1032K and 1350K.
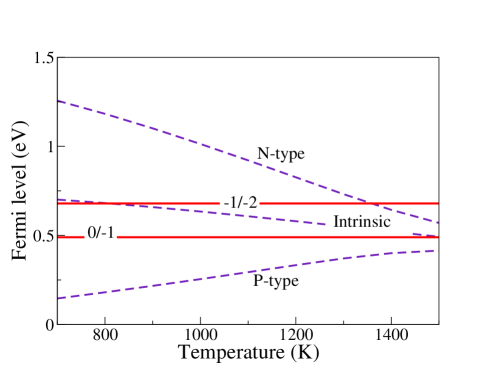
The simultaneous fit of the three curves (N-type, P-type and intrinsic curves in Fig. 10 of Ref. 4Bra99_2 ) is complicated and lengthy, especially that the ionization levels of Baraff and Schlüter did not give a satisfactory fit. Therefore they include the ionization levels in the fitting procedure. The best fit obtained corresponds to eV and includes two ionization levels only ( and ) located at = 0.42 eV and = 0.6 eV from the VBM that must remain unchanged with temperature.
Figure 2 shows the variation of ionization levels used as function of temperature. The Fermi level corresponding to intrinsic, N-type and P-type GaAs is also shown. By analyzing this figure, one can notice that the charge state dominates at low temperature, in intrinsic and N-type GaAs, then it is reversed to and as temperature increases. In this temperature range there is a competition between different charge states for intrinsic and N-type GaAs with no contribution coming from the charge state. This choice of ionization level favors the stability of less charged vacancies as temperature increases. For P-type GaAs, the neutral vacancy dominates self-diffusion over the entire temperature range.
In both experiments the dominant part of the temperature dependence is due to the change of the chemical potential (i.e., the Fermi-level effect), treated extensively by Tan and coworkers 4Tan93 . However, the above analysis shows unequivocally that only including the experimentally-measured thermal dependence of the Fermi level alone is not sufficient to explain the two conflicting experiments at the same time. Figures 1 and 2 show the crucial role played by the ionization level behaviour for determining the charge state of the vacancy and that they are the main source of conflict.
IV Results and discussion
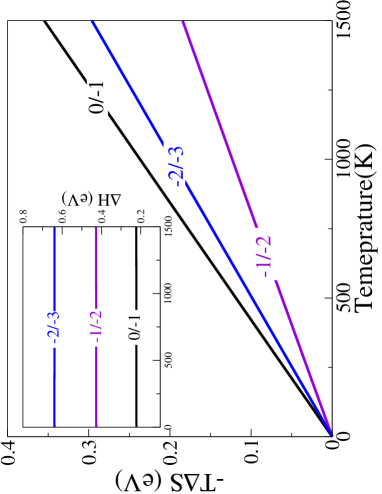
The calculated thermal effect on the enthalpy and the entropy differences between the relevant sequential charge states are shown in Fig. 3. For all differences, the ionization enthalpy is independent of the temperature. In contrast, since the entropy difference between these states is finite and mostly independent of T, the ionization entropy term increases linearly with temperature. Moreover, contrary to what could be expected, the neutral vacancy has the highest entropy so that the formation entropy of should decrease with an increase in the number of electrons. Important changes with temperature occur in the band gap, and, depending on the doping type, in the Fermi level. This temperature dependance of the Fermi level affects the relative energy of neighboring charge states by the same amount. It is this effect that is responsible for the interesting effect of negative temperature dependance of the concentration discussed in Refs. 4Geb03 ; 4Tan93 .
While the change in the charge transition level due to entropy term is smaller than the shift in the Fermi level — the (2/3) transition is moved by about 0.3 eV — its effect is charge dependant, affecting the relation between the various levels. At 0K, ionization levels in GaAs are located in the lower part of the band gap and distant by 0.10.2 eV from each other. Hence, an increase of 0.3 eV coupled with the Fermi level effect cause important changes in the dominant vacancy charge.
Similar entropic effects are known to affect the properties of defects in semiconductors. For example, the entropy term of amplitude similar to ours appears to be responsible for the lowering the migration barrier in SiC with increasing temperature 4Raul04 . It is also associated with the destabilization of a metastable configuration in GaAs 4Ham88 ; 4Fan01 and the thermal behaviour of the binding free energy of acceptor-oxygen complexes in Si 4San05 .
These entropic effects are directly associated with changes in the phonon density of states (DOS) as electrons are added to the system, modifying the bonding strength in the region surrounding the defect. In the case of , the phonon DOS for the neutral vacancy shows the highest deviation from the crystalline value. The effective impact of the vacancy on the lattice is equivalent to the application of a local negative pressure: the transverse acoustic (TA) modes move from the crystalline value by 3 cm-1 to higher frequencies (mode hardening), while the LA, LO, TO modes move to lower frequency (mode softening) by 2 cm-1. As the defect is progressively charged, the DOS tends to recover the frequencies of the crystal DOS: TA modes move to lower frequencies while LA, LO and TO move to higher frequencies leading to an overall decrease in the entropy with the charge state.
Structurally, this behaviour is associated with the relaxation of the arsenic atoms surrounding the empty site. In an unrelaxed model, As atoms form a tetrahedron around the empty site with an interatomic distance of 3.95 Å. As electron are added to the relaxed system, the symmetry is conserved but volume of the vacancy decreases. A detailed structural analysis reveals that the addition of the first electron does not affect considerably the bond length around . As-As bonds decrease progressively to 3.37Å for 0 and 1 charges and 3.36Å and 3.35Å for 2 and 3 charge states. To compensate, since the simulation is performed at fixed volume, the Ga-As bonds, for the atoms surrounding the vacancy, stretch out with the charge; this effect propagates in the direction of the link until the borders of the supercell especially on the high symmetry axes. The pressure increases locally around the vacancy but it is released farthest away from it. The phonon density of states suffers from a strong competition between the compression and the expansion of bonds, and the electron-phonon interaction.
Finally, it appears that the DOS is under the effects of a small progressive compression as electrons are added (TA softening and LA, LO, TO hardening) that clearly overcomes the proposed phonon mode softening induced by electron-phonon interaction studied earlier for GaAs in Ref. 4Hei76 . Instead, our data show a brutal decrease of the phonon vibrational modes as a neutral vacancy is introduced in a perfect crystal and a progressive strengthening as electrons are added to the defect, agreeing with the experimental observation 4Ish95 that LO() phonon peak is shifted toward the low frequency side (mode softening) and broadens its width depending on the concentration of vacancies.
Results for our calculated formation entropies and enthalpies are summarized in Table 1. Formation entropy for the neutral state, the only one available in the literature, compare well with the ab-initio values using anharmonic approximation by Bockstedte and Scheffler 4Boc96 and a recent fit of experimental data by Gebauer et al. 4Geb03 (further comparisons with earlier works can be found in these two references). The formation enthalpy we calculated in a previous work 4Elm05 is in good agreement with recent LDA calculation by Zollo et al. 4Zol04 using 64 and 216 supercells, differences do not exceed 0.2 eV for . We relaxed in different charge states using spin-polarized LDA calculation but no Jahn-Teller distortion has been observed. This confirms that the symmetry conservation of of is not a drawback of LDA but a behaviour proper to cation vacancies 4Cha03 . To our knowledge no calculation using GGA has been performed on this defect at this point.
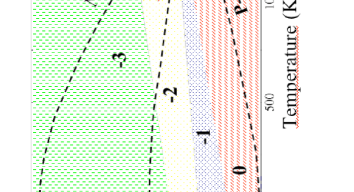
Combining the results presented above, we obtain the free energies difference between the various charge states: = 0.22 + 2.74, = 0.42 + 1.42 and = 0.63 + 2.28. While the formation entropies are known to suffer from finite-size effects, entropy differences should be much more reliable. Formation entropy errors due to the finite-size of the supercell are expected to be of similar magnitude for all charge states and thus cancel out when only differences are considered 4Raul04 . Contrary to earlier assumptions 4Van76 , the actual temperature dependence of the ionization energies favors the formation of less charged point defects at high temperature. Figure 4 shows the stability domains within the experimental band gap for the dominant charge states as function of temperature.
The transition from a charge state to another takes place as soon as the Fermi level (under certain doping conditions) crosses the ionization energy line, falling into a new stability domain. For P-type, the 0/1 level is always higher than the extrinsic Fermi energy suggesting that the neutral vacancy remains stable at all temperatures. For intrinsic and N-type conditions, however, the charge state of the vacancy is lowered as the temperature increases. The critical temperature associated with these changes is located in the range of 520-1500K where , and start to compete with .
IV.1 Uncertainties on the calculated Gibbs free energy
The formation enthalpies and transition levels calculated with LDA involve uncertainties that can exceed the vibrational effects, but that are more likely to cancel out. Thus, one must be aware of possible source of errors affecting the Gibbs free energy of formation. Formation entropies suffers from errors associated with the calculation of vibrational density of states 4Mat04 . For example, the microscopic structure of the defect itself, which is possibly not obtained accurately. This may be a result of the defect-defect interaction of the supercells, but also errors from the construction of the pseudopotentials or the LDA may contribute. In general, these errors only affect slightly the total energy calculation but are more significant for vibrational modes. Moreover, uncertainty in the lattice constant which causes the defect to exerts pressure on its environment and can modify the equilibrium lattice constant of the defective supercell compared to the LDA bulk value. Since we are only interested in Gibbs free energy differences we may expect a significant amount of error cancellation. Recent tests on phonon frequencies of silicon vacancy in bulk silicon 4Alm03 showed that a cancellation of errors does tend to occur because free energy differences depend only weakly on the choice of lattice constant.
Uncertainties on formation enthalpy can come mostly from two sources. First, the LDA band gap problem, since it is well-known that LDA usually underestimates the band gap of materials. The simplest way, used here, for dealing with the band gap problem 4Elm05 is to shift the conduction band states up uniformly by the amount needed to reproduce the experimental gap 4Bar84 (align the conduction band maximum (CBM) with the experimental value, at 1.52 eV from the valence band maximum (VBM)). Since the LDA can produce similarly large errors in the energies of the deep defect states, it is also important to correct these errors. Therefore, defect states with predominantly conduction band character experience the same upward shift as the the conduction band states themselves, while leaving the defect states with predominantly valence band character fixed relative to the valence band edge. In our case, ionization levels are calculated by total-energy energy differences, the correction we use here leaves these ionization levels unchanged since they have a valence band character. Many other correction schemes can be used with good efficiency as discussed in the work of Castleton and coworkers 4Cas06 , we discuss below the impact of such corrections on the fitting procedure. With current computational power limitations, a full GW calculation, which would correct LDA errors, is unfortunately not possible for the large supercells needed for defect studies. Therefore, LDA calculation is the best choice currently since it provides a good estimate of the electronic ionisation levels that enables us to fit efficiently experimental data. Second, supercell corrections could also introduce additional errors on the calculated formation enthalpy. In this work, total energies of charged defect are corrected using the first order Makov-Payne method 4Mak96 . Many articles 4Cas06 ; 4Shi05 ; 4Ger03 have recently shown that Makov and Payne correction can be overestimated for highly charged defects.
IV.2 Fitting experimental measurements
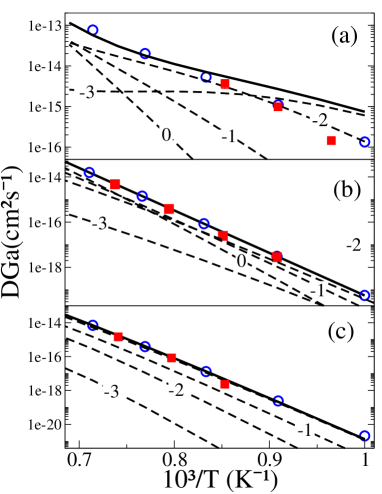
We revisit the analysis of two apparently conflicting results by looking at diffusion data of Bracht et al. and concentration profiles of Gebauer et al. We first reproduce exactly the fits of Gebauer et al. and Bracht et al. using exactly the same conditions described in the respective original papers (dash lines in Fig. 5 and squares in Fig. 6) and explained above. We then use the Gibbs free energy of formation and all resulting ionisation levels calculated by LDA to generate our fits. The contributions coming from each charge state is shown and the total concentration and diffusion coefficient are plotted with solid lines in Figs. 5 and 6.
Using our calculated values, with only one free parameter to adjust the prefactor ( in equation 5), and 2 and 3 charges, we reproduce the experimental data of Gebauer et al. with a good accuracy (Fig. 5) showing that the 2 charge state is the main contributor to self-diffusion at high T.
Self-diffusion coefficient measured by of Bracht et al. are also efficiently fitted. Comparing our calculated Ga self-diffusion parameters with experimental data and the corresponding fits 4Bra99_2 , with an adjustable prefactor we notice (see Fig. 6(b)) a strong competition between 2, 1 and 0 charge states for intrinsic GaAs while 3 does not contribute to the total concentration. Moreover, a progressive charge reversibility occurs: dominates at high temperature until = 1230K, then dominates until = 1345K. Even if details about the location of transition temperatures are different, the total diffusion coefficient is very well reproduced with our model too. Contrary to what was proposed by Tan et al. 4Tan93 , our results support the experiment, indicating that under intrinsic conditions plays very little role.
For Si-doped GaAs, while Bracht et al. find that the concentration decreases with temperature for but shows no contribution from the 3 charge states, we see a more complex situation (Fig. 6(a)): self-diffusion is mediated by at temperature below = 1150K, while above this transition temperature 2 charge state is dominant until = 1450K. Finally, for P-type GaAs (Fig. 6(c)), we obtain results that are very similar to Bracht: the neutral vacancy is dominant over the whole temperature range.
As is seen in Figs. 5 and 6, our model reproduces very well all data at high temperature for different doping condition. The agreement is weaker for N-type GaAs below 1100K, however. In this regime both experimental data sets lie below our predictions. This is likely due to the formation of vacancy complexes and slow Ga-self-diffusion which appear to delay the establishement of equilibrium condition, as noted by Gebauer et al. 4Geb03 . Thus, the measured concentration is a lower limit of the calculated equilibrium concentration.
A gap or supercell correction that applies the same rigid shift to the ionization levels would not change the observed sequential charge reversibility, caused by entropic effects, but only the location of transition temperature. In this particular case, if the ionization levels are shifted upwards, the contribution of charge state increases. Thus, the remaining discrepancies that appears between experiment and theory visible in Fig. 6(a) for the low temperature limit can be significantly attenuated. At a first insight, we propose to use the simplest LDA corrections, if entropy effects alone give unsatisfactory results, one can go beyond by using more advanced gap correction schemes.
V Conclusion
The present work shows that the deformation potential and the electron-phonon interaction induced by charged vacancies affect the phonon spectrum in a much more complicated way than was thought previously 4Boc96 ; 4Van76 . Consequently, the picture about ionization levels obtained at 0K 4Elm05 is not applicable in the experimental range as ionization free energies are temperature dependent. We have found that the entropy of formation calculated with LDA contributes to lower the free energy of formation at high temperature when associated with empirical thermal effects on the Fermi level. Thus, the formation of less charged Ga vacancies mediating self-diffusion in GaAs becomes much more favored at high temperature. In spite of LDA limitations, the resulting coherent Gibbs free energies of formation are a possible solution to the apparently contradictory experimental results about the dominant charge state for vacancy diffusion in GaAs. In addition to resolving this controversy, our results underline the need to include thermal effects on the Fermi level together with ionization entropies and ionization enthalpies. Even though the Fermi level effect dominates the correction term, the smaller contribution coming from ionization entropy is crucial for a correct interpretation of experimental data.
Acknowledgements. We are thankful to Dr Hartmut Bracht for sending us his data and a number of discussions. NM acknowledges partial support from FQRNT (Québec), NSERC (Canada) and the Canada Research Chair program. We thank the RQCHP for generous allocation of computer time.
References
- (1) B. Bracht, M. Norseng, E. E. Haller, K. Eberl, and M. Cardona, Sol. Stat. com. 112, 301 (1999).
- (2) J. Gebauer, M. Lausmann, F. Redmann, R. Krause-Rehberg, H. S. Leipner, E. R. Weber, and P. Ebert, Phys. Rev. B 67, 235207 (2003).
- (3) T. Y. Tan, H. M. You, and U. M. Gösle, Appl. Phys. A 56, 249 (1993).
- (4) F. El-Mellouhi and N. Mousseau, Phys. Rev. B 71, 125207 (2005).
- (5) S. B. Zhang and J. E. Northrup, Phys. Rev. Lett. 67, 2339 (1991).
- (6) K. Laasonen, R. M. Nieminen, and M. J. Puska, Phys. Rev. B 45, 4122 (1992).
- (7) B.-H. Cheong and K. J. Chang, Phys. Rev. B 49, 17436 (1994).
- (8) H. Seong and L. J. Lewis, Phys. Rev. B 52, 5675 (1995).
- (9) J. E. Northrup and S. B. Zhang, Phys. Rev. B 47, 6791 (1993).
- (10) S. Pöykkö, M. J. Puska, and R. M. Nieminen, Phys. Rev. B 53, 3813 (1996).
- (11) J. T. Schick, C. G. Morgan, and P. Papoulias, Phys. Rev. B 66, 195302 (2002).
- (12) A. Janotti, S.-H. Wei, S. B. Zhang, and S. Kurtz, Phys. Rev. B 67, 161201 (2003).
- (13) R. W. Jansen and O. F. Sankey, Phys. Rev. B 39, 3192 (1989).
- (14) G. A. Baraff and M. Schlüter, Phys. Rev. Lett. 55, 1327 (1985).
- (15) E. Rauls and T. Frauenheim, Phys. Rev. B 69, 155213 (2004).
- (16) M. Bockstedte and M. Scheffler, Z. Phy. Chem. (munich) 200, 195 (1997).
- (17) J. A. Van Vechten and C. D. Thurmond, Phys. Rev. B 14, 3539 (1976).
- (18) K. Dev and E. G. Seebauer, Phys. Rev. B 67, 035312 (2003).
- (19) M. Sanati and S. K. Estreicher, Phys. Rev. B 72, 165206 (2005).
- (20) E. Rauls, T. Frauenheim, A. Gali, and P. Deák, Phys. Rev. B 68, 155208 (2003).
- (21) K. Petzke, C. Göbel, C. Schrepel, and U. Scherz, Mater. Sci. Forum 258-263, 861 (1997).
- (22) D. Strauch and B. Dorner, J. Phys. Chem. 2, 1457 (1990).
- (23) J. S. Blakemore, J. Appl. Phys. 53, R123 (1982).
- (24) C. D. Thurmond, J. Electrochem. Soc. 122, 1133 (1975).
- (25) Y. P. Varshni, Physica 34, 149 (1967).
- (26) Numerical Recipes F77, section 9.4 http ://www.library.cornell.edu/nr/cbookfpdf.html.
- (27) B. Hamilton, A. R. Peaker, and S. T. Pantelides, Phys. Rev. Lett. 61, 1627 (1988).
- (28) J. W. Fang, Z Q an Kim and P. W. Yu, Appl. Phys. Lett. 78, 2506 (2001).
- (29) V. Heine and J. A. Van Vechten, Phys. Rev. B 13, 1622 (1976).
- (30) K. Ishioka, K. G. Nakamura, and M. Kitajima, Phys. Rev. B 52, 2539 (1995).
- (31) G. Zollo, J. Tarus, and R. M. Nieminen, J. Phys. Cond. Matt. 16, 3923 3932 (2004).
- (32) D. J. Chadi, Materials Science in Semiconductors Processing 6, 281 (2003).
- (33) A. Mattausch, M. Bockstedte, and O. Pankratov, Phys. Rev. B 70, 235211 (2004).
- (34) O. K. Al-Murshadani and R. J. Needs, Phys. Rev. B 68, 235205 (2003).
- (35) A. Baraff and M. Schlüter, Phys. Rev. B 30, 1853 (1984).
- (36) C. W. M. Castleton, A. Höglund, and S. Mirbt, Phys. Rev. B 73, 035215 (2006).
- (37) G. Makov and M. C. Payne, Phys. Rev. B 51, 4014 (1995).
- (38) J. Shim, E.-K. Lee, J. Lee, Y, and R. M. Nieminen, Phys. Rev. B 71, 035206 (2005).
- (39) U. Gerstmann, P. Deák, R. Rurali, B. Aradi, T. Frauenheim, and H. Overhof, Physica B cond. Matter 340, 190 (2003).