Experimental study of the correlation length of critical-current fluctuations in the presence of surface disorder: Probing vortex long-range interactions.
Abstract
We report on critical currents and voltage noise measurements in Niobium strips in the superconducting state, in the presence of a bulk vortex lattice () and in the surface superconducting state (). For homogeneous surfaces, the correlation length of the current fluctuations can be associated with the electromagnetic skin depth of vortex superficial instabilities. The modification of the surface state by means of low energy irradiation induces a strong modification of the critical current and of the noise. The appearance of a corner frequency in the spectral domain can be linked with the low wave-vectors of the artificial corrugation. Since this latter occurs only for , we propose that the long-range interactions allow the correlation length to extend up to values imposed by the surface topography.
pacs:
71.27.+a,72.70.+m,72.20.MyNoise measurements are powerful tools to go inside the origin of the vortex pinning, and of the dynamical interactions between the vortex lattice and the sample disorder. This noise, generated during the lattice flow, is called the flux-flow noise clem . It is generally characterized by the shape of its spectral density, and by its power. As it is often proposed in noise analysis, it is convenient to define a correlation length, within which the fluctuations are correlated. This defines the fluctuator of the system. To the extent that the fluctuators are independent and that the system is large enough, the correlation length can be calculated from the noise power via an usual statistical averaging (the central limit theorem) mike1 . Recently, it was shown that no difference can be observed between the flux-flow noise in the mixed state and in the surface superconducting state of a Niobium slab jo2 . In other words, the same fluctuator is present with or without a bulk vortex lattice, showing clearly its superficial origin. The coupling to the bulk was shown to be due to the conservation of the total current. This confirms previous auto and cross correlation experiments of both flux and voltage noises bernard , and explains the insensivity of the low frequency noise to bulk perturbations jo1 , in Pb-In alloys. In these experiments, two parameters, the normalized spectrum of the fluctuator and its correlation length, are experimentally justified but are not explained bernard ; jo2 . If the fluctuator is of superficial origin, it should be possible to induce notable changes in the noise characteristics after some surface treatments. A following change in the noise spectral density, the noise power, or eventually in the underlying statistics, would give some clues to understand the spectrum and the fluctuator origins. Wherever it takes place, it has been made clear for years that the existence of flux-flow noise is intimately linked to the nature of the relevant disorder, i.e. to the vortex pinning. In the conclusion of his review article, Clem states that such a flux-flow noise theory “ should be intimately related to an appropriate theory of critical current density ” clem . This implies that any noise analysis would be notably improved if some characterization of the vortex pinning is proposed beforehand.
In this paper, we are thus interested in the modification of the flux-flow noise by a tuning of the relevant disorder. For that, we will first discuss the nature of the pinning in our samples and bring some experimental arguments on the way that the critical current can be substantially modified by a surface treatment. In a second approach, the noise mechanism proposed in previous papers bernard ; jo1 , will be discussed and specified by some recent results concerning the physical origin of the fluctuator. In the last part of the paper, the effect of surface irradiation on the noise power and the noise spectrum will be shown and discussed. For sake of generality, these measurements are made in Niobium, a well documented and conventional type II superconductor.
I Experimental
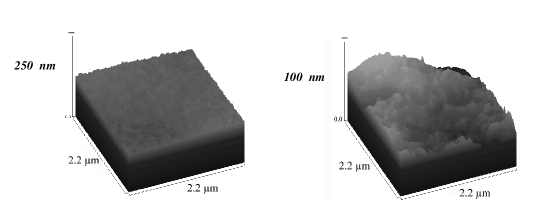
All measured samples are parts of the same piece of bulk Nb (initially 2 thick and 12 long). The thickness was first roughly reduced to 0.23 , and the surfaces were progressively polished with 27 , 15 then 7 rough papers. Then, three samples of different widths were cut by a wire. However, the roughness obtained after the finest mechanical polishing was still too large to reduce sufficiently the critical current. In order to reduce efficiently this surface roughness, and to eliminate the oxide sheath which naturally develops on the niobium surface, a buffer chemical polishing (BCP) was performed. Each sample was plunged into an equivolume solution of during eight minutes. Previous reports of the rms roughness after such a BCP give values close to 1 in the m scale rugosite , in agreement with our AFM measurements. From the analysis of the AFM pictures (see fig. 2), we find 0.7 rms. This value is the mean values of 10 different line scans taken in an area of 1010 m2. After this step, all samples have similar surface state and their bulk properties are unchanged. In the following, the samples (1) and (2) will correspond to the samples with respectively =0.25 and = 1.24 (= 0.22 for each). The sample (3) will refer to the irradiated sample. Each large face of this sample was irradiated by an argon beam for 30 minutes (acceleration voltage = 600 , and argon pressure 2.10-4 ). The sample holder was inclined at 45 degrees and continuously rotated in order to make the etching very uniform in a 10 10 area. Such low energy irradiation causes only superficial damages (about 10 of depth), which will be discussed in the text.
The superconducting parameters of each samples were measured by DC transport, magnetization (SQUID) and specific heat measurements. The following parameters were measured: 9.2 0.1 , 2900 50 and 0.5 . Comparing with the data of the ref. niobium , a Ginzburg-Landau parameter 0.84 can be inferred. The critical currents have been measured by voltage-current characteristics.
In addition, we have measured the voltage noise induced during the vortex lattice motion. Voltage signals were recorded with the four probes method, amplified by ultra low noise preamplifier (, 0.7 ). This signal source is then plugged into the analog inputs of a dynamic signal analyzer (), converted into digital signals and mathematically processed. All the experimental set-up was electromagnetically shielded to avoid much of the external disruption. Such noise measurements are extremely sensitive to the temperature stability: a special care has been taken to avoid any excess of heating responsible of low frequency noise (contact noise or flicker noise due to the Helium boiling). Since Niobium is a very good conductor ( 10 for our samples), the contacts resistances are the major limiting problem. Making good electrical contacts on the bulk Niobium samples is difficult. The best solution was to mechanically strip the end of the slabs of its oxide sheath, to deposit a thin metallic layer and to press between small copper pieces. Finally, this was good enough to apply 8 with no spurious noise. But in practice, in our macroscopic samples, this restricts the experimental region relatively close to .
II Results and discussion
II.1 Critical currents and vortex pinning: width and surface roughness effects
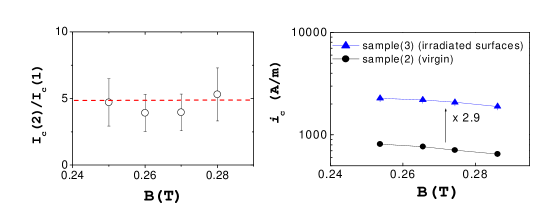
In fig.1 are shown the critical currents versus the magnetic field close to for the Niobium samples. Recent works have attributed much of the irreversible properties of type II superconductors, including the vortex noise, to the edges of the samples (geometrical barriers or Bean-Livingston barriers) zeldov . In order to quantify this effect in our samples, we have measured the critical current of the samples (1) and (2), which have a very contrasted width. If the critical current is principally concentrated near the sample edges, its value should not significantly depend on the sample width. In contrast, since we measure a simple linear relation between and W (fig. 1), can be considered as macroscopically homogeneous all over the width of the surface. Note that, a priori, it does not exclude small inhomogeneities and local variations near the lateral edges, but those effects turn out to be on average negligible in our samples. We will show hereafter that the noise measurements will be a more precise probe. Finally, macroscopic homogeneity of the critical current means that a critical current per unit of width (A/m) = /(2) is a relevant description of the critical properties.
For conventional soft type II superconductor, except the irreversible edges effects, the vortex pinning has been shown to arise from pinning of the tips of the vortices on the top and bottom surfaces. This is quantified by the following expression (fib and references herein):
| (1) |
where stands for the overall equilibrium magnetization, and is the characteristic surface roughness angle.
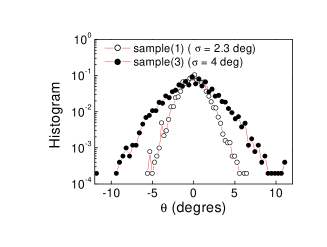
The topography of the surfaces was analyzed using atomic force microscopy (AFM) in the tapping mode. The roughness of the virgin surfaces exhibits a random disorder, with no characteristic scale. The fig.2 is a 3D representation of the surface roughness. In terms of vortex surface pinning potential, the relevant parameter is equivalent to a contact angle . In order to calculate it, we first take a statistical representative cross section (the average of several cross sections), then calculate its derivative = tan (). The spectral density is then . The main roughness angle accessible for the vortices is given by fib :
| (2) |
where 33 is the coherence length.
In order to calculate the critical current with the equation (1), the overall equilibrium magnetization should be known. Close to , in the Abrikosov limit, with = 1.16 for the hexagonal symmetry of the vortex lattice. Using 0.29 and = 0.84 in the equation (1), one finds, at = 0.25 , = 2.1 0.1 . The surface topography analysis of the samples (1) leads to = 2.3 0.2 (equation (2)), in a close agreement. The equation (1) appears thus to describe the critical current data, with as a reasonable average parameter describing the surface pinning potential. We note that the same analysis was successfully applied in Niobium films fib . This confirms the previous assumption fib that the difference of 2 between bulk and thin films Nb (with different thickness ) does not mean a stronger pinning in films. This simply proves that is not the good parameter, but that is.
We now focus on the consequence of the surface irradiation on the vortex pinning. The measured critical current has been increased by a factor 2.9 in the sample (3) (fig.1). As evidenced in the fig.2, the irradiation results in a strong degradation of the surface, with both an increase of the overall roughness and the appearance of large craters. Using the surface analysis and the equation (2), 4 0.2 is deduced (fig.3). The roughness angle has thus been increased by a factor 1.7 by the irradiation. Note that the important parameter is not directly the roughness but the roughness angle which is a derivative. As a consequence, the increase of this latter is not as strong as a visual impression could give (see fig. 2). Finally, the increase of the critical current is qualitatively explained, but some difference appears in the comparison of the critical angles. In fact, in the equation (1) stands strictly for the surface value, whereas we use the only known bulk parameters for the calculation of the Abrikosov expression. If this approximation seems well justified in the case of homogeneous samples, it becomes questionable when the surfaces have been irradiated, because the concentration of impurities near the surfaces should locally modify the thermodynamic parameters. In general, the most important change is in the coherence length which has to be replaced by in the dirty limit, with the mean free path (see for example ulmaier ). This leads to a local increase of , here restricted close to the surfaces. We will show below that the noise measurements confirm this slight increase, providing an attractive explanation of the underestimation of the critical current after the irradiation in the mixed state.
II.2 On the noise for the smooth surfaces
When the applied current is over-critical, the voltage in the mixed state is given by , with the flux-flow resistance. In the surface superconducting state, the same expression applies with instead of . It has been shown that, in the case of Pb-In alloys, most of the voltage noise originates from current fluctuations bernard ; jo1 . Following here the same arguments, one can write , and with the assumption of independent fluctuators under stationary conditions:
| (3) |
where is the sample surface between the voltage pads, and the fluctuations correlation length. In the case of stationary fluctuations, and thus have a well defined magnitude. In ref bernard and jo1 , was found in Pb-In alloys.
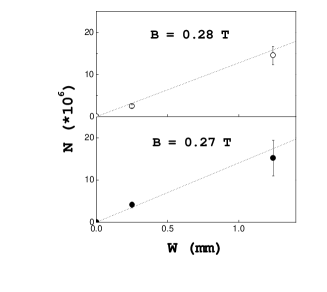
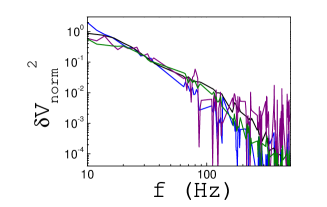
The metallic and flux-flow resistivities of pure Niobium are quite low. As a consequence of the equation (3) and for identical geometrical parameters, the flux flow noise should be largely reduced compared to the Pb-In case (or to any case of a relatively high resistance sample). This is consistent with our measurements. In addition, using the equation (3) for Pb-In or Nb, very similar values are extracted. This means that the same noise mechanism controls the fluctuator size. A strong confirmation that is a relevant parameter can be made when comparing two samples with contrasted widths (respectively samples (2) and (1). For the same surface state and the same (B,T) conditions, we have already verified that is constant (no edges effects). If is constant too, the number of fluctuators should vary as and . This can be observed from the variation of the number of fluctuators as a function of in the fig.4. This confirms that the noise arises from the statistical averaging of small and independent noisy domains. Consistently, we do not observe any cut-off in the spectral shape meaning that no size effect is introduced. In addition, the spectrum is very similar to the one observed in Pb-In alloys (fig.5).
Since the number of fluctuators is found to be proportional to the surface of the samples, on can also conclude that the (low frequency broad band) noise does not arise from instabilities close to the edges of the sample. This contrasts to the conclusion of the ref. paltiel , where the voltage noise was attributed to the dynamical annealing of a disordered vortex phase nucleated close to the edges. We stress that this latter interpretation was proposed for the peculiar case of the peak effect in , where two macroscopic critical current states coexist in the sample (marchevski ; neutrons and references herein), and where the large noise values are coming from the kinetic between these two states. This was shown to correspond to non-Gaussian noise by a second spectrum analysis mike . No such peculiar features are observed in our samples where the noise is observed to be Gaussian and has been verified stationary using the same high order statistics method. Note that the fact that we observe stationary and Gaussian noise reinforces the modeling of the noise by independent fluctuators, and hence, is consistent with the fig.4.
We define a fluctuator by its correlation length . Up to now, has been taken as an adjustable parameter, whose relevance has been experimentally controlled (fig.4), but whose physical basis have not been clarified. Thus, it is necessary to go further inside the fluctuations mechanism. Placais et al bernard proposed that the instabilities in the vortex lattice flow originate from the hanging and release of the vortices on the surface defects, the hanging condition being the local boundary condition for a vortex line. Since the same boundary condition is the basis of a surface critical state pat , large fluctuations of magnitude are expected. The more a vortex is bent, the more non dissipative current can flow. Locally, when a vortex leaves its hanging condition, decreases very fast and at the same time, the amount of normal current localized near the surface should increase due to the conservation of the total current. Thus, an electric field is generated, being the characteristic length scale associated to the decay of surface currents ( close to pat ). This is the elementary instability.
Its duration can be estimated as follows. Using the Josephson relation, the line velocity reached by one vortex ending during the instability is given by . To the extent that one instability occurs per vortex period (individual process), the associated diffusion time is = / = / . One the other hand, it is known from classical electromagnetism that, for a given time duration, the diffusion is restricted in a skin depth / . This leads to
| (4) |
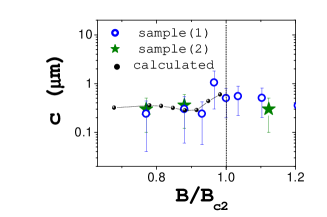
For typical values (, , , , , ), 0.07 . One can note that these instabilities are extremely short compared to the flux-flow period 1 s. The skin depth calculated from (4) is 0.3 , a value very close to the correlation length . The comparison between the equation (4) and the experimental data for the Nb (1) and (2) is shown in the fig. 6 for . The agreement is satisfactory. For , in the surface superconducting state, the equation (4) is not very accurate because has not been estimated in this case. Nevertheless, it appears clearly from the experimental data that there is no change of regime. This can be explained by the fact that in Niobium, , which is the order of magnitude of the surface sheath fink . It can be noted that in the equation (4), the important parameter which determines the range of the fluctuations is not the flux-flow resistivity but the surface critical current . Nb and Pb-In have very different resistivity but similar values (4.2 , 0.9) 700 for Nb and 300 for Pb-In). This explains why Nb and Pb-In samples exhibit also similar values.
One concludes that can be described as the skin length of very fast instabilities close to the surface. We stress that this mechanism determines the noise power via the size of a coherent domain, but it is clear that, ideally, such a stick-slip like process generates only a high frequency peak at (and the associated harmonics), and a sharp peak centered at containing the power of the process. This should occur only if the same critical current (critical angle) was reproduced at each instability. In reality, the disorder effect causes the distribution of critical currents at the sample scale and necessary induces an irreproducibility of the elementary instabilities magnitude. This creates fluctuations around and a broadening of the central peak (the low frequency broad band noise). We will see that changing the disorder, i.e. the surface roughness, by the reinforcement of the low wave-vectors, results in a change of the associated low frequency spectral shape.
II.3 On the noise for the rough surfaces
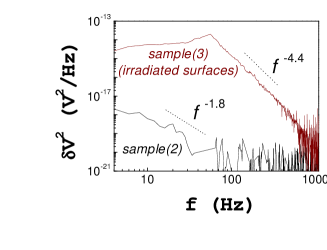
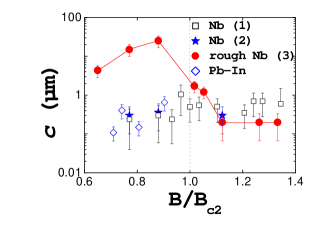
We have shown that the substantial rise of the critical current in the mixed state can be mainly ascribed to the increase of the surface roughness. For the samples with the homogeneous surface states, the noise regime is similar above and below , with comparable values of . For , the noise magnitude of the sample (3) (rough surfaces) is enhanced in the same proportion as for the critical current, meaning that the same value is found again. For , a noise rise of two orders of magnitude more than is observed. It is clear that no fundamental change in the pinning mechanism has been introduced by the irradiation, since this latter was accounted for by the increase of the surface roughness. In addition, specific heat measurements confirm that the bulk second critical field remains unchanged. Any modifications of were observed neither. As expected by the very low kinetic energy of the ions, the surface irradiation has no influence on the bulk properties of the sample. An extra noise regime due to a strong increase of the bulk defects concentration is thus very unlikely. An increase of the correlation length of the surface currents fluctuations, resulting in less statistical averaging, is a more consistent track. All samples being identical, apart from their surface state, this increase has to be linked to the introduction of the artificial superficial disorder. In addition to the enlargement of the coherent domain, a striking change can be observed in the spectral shape. The usually smooth decay of the noise power with the frequency is here replaced by a strong decrease at high frequencies () and a nearly white noise below a kink at a frequency (fig. 7). corresponds to a characteristic time , above which correlation vanishes. turns out to have a too small vortex velocity dependence to be obviously connected with a time of flight or a transit time. Anyway, the appearance of a large and of are simultaneous. Since the characteristic length is very far away from or , but always found to be of the order of magnitude of , this suggests that is associated to the collective rearrangement of the surface currents within the coherent domain note .
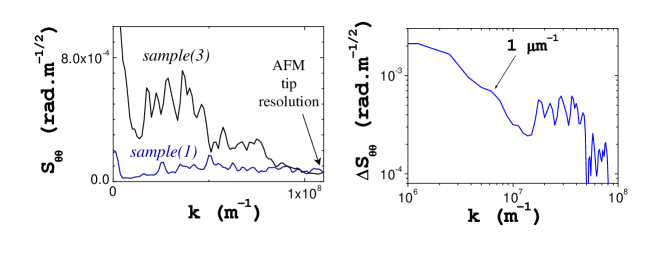
Some large scale defects can be easily evidenced on the degraded surface (fig.2). To be more precise, we have plotted the roughness spectrum in the fig.8, where the increase of spectral weight due to the irradiation is clearly shown. The lowest wave-vectors are the most affected. They correspond to the large bumps of diameter which are also visible in the AFM pictures (fig.2). Since they were introduced by the irradiation, they offer an attractive explanation for the large values. We propose that they determine the maximum available correlation length, within which the instabilities are correlated, instead of in the virgin samples. This implies also that a slower diffusion of the instabilities is involved. For such a large scale mechanism to be effective, the possibility of strong collective effects between vortex endings is necessary. Because of the magnetic long-range interactions, the FLL is much softer for short wave vectors of distortion (the elastic non-locality) brandt . Even if we do not have a quantitative analysis of the process, the following results are qualitatively accounted for by the introduction of the long-range interactions: (i) increases with the magnetic field close to (fig.9), as expected from the softening of the vortex lattice, and (ii) returns to the virgin sample value as soon as . Indeed, the surface superconducting state is populated by very short vortices which melt away rapidly in the bulk kulik , so their response is expected to be individual (local). In the absence of long range interaction in the lattice, the instabilities process can not involve distortions at small wave-vector, but is limited to the small range roughness, like in the virgin samples. One of the key points is that the large scale roughness affects the spatial extension of each fluctuation, but not their power. The latter is fixed by the critical current that exhibits a more monotonic trend towards .
It can be observed that returns strictly to its “ virgin surface ” value for and not for , where is the bulk value, as measured by specific heat. As previously noted, the surface irradiation causes a concentration of Ar ions only in the first nm under the surface. As a consequence, the coherence length is modified by mean free path effects (for example ulmaier ) and the surface second critical field is locally increased, explaining why the surface properties are now slightly shifted from the bulk properties. Finally, one can note that any change in the noise statistics can be observed in any sample and in any regime. The noise is always Gaussian and stationary, even after the surface irradiation where the correlation lengths are found to be notably increased. This can be attributed to the large size of our samples which impedes any deviation from gaussianity because of statistical averaging. If the size of the sample is made small enough, a more peculiar behavior can be expected and is observed levy .
In conclusion, we have studied the critical current and the voltage noise in Niobium slabs, in the high field regime of the mixed state and the surface superconducting state. It appears that the critical current is quantitatively controlled by the surface roughness, and as a consequence can be modified by controlled low energy irradiation. The mechanism of voltage noise which reflects the underlying surface current fluctuations is not modified when the bulk vortex lattice changes into the surface vortices. The associated correlation length can be associated with the skin length of the superficial instabilities. An artificial surface corrugation with large scale defects causes an enlargement of this correlation length, only for . This reveals likely the long range interactions of the mixed state .
Acknowledgments: We would like to thank L. Mchin (GREYC, Caen) for the surfaces irradiation, V. Hardy (CRISMAT, Caen) for the specific heat measurements, and Bernard Plaçais (ENS, Paris) for fruitful discussion. This work was supported by la ” rgion Basse-Normandie ”.
References
- (1) J. R. Clem, Phys. Rep. 75, 1 (1981).
- (2) M. B. Weissman, Rev. Mod. Phys. 60, 537 (1988).
- (3) J. Scola, A. Pautrat, C. Goupil, L. Mchin, V. Hardy, and Ch. Simon Phys. Rev. B 72, 012507 (2005).
- (4) B. Plaçais, P. Mathieu, and Y. Simon, Phys. Rev. Lett. 70, 1521 (1993).
- (5) J. Scola, A. Pautrat, C. Goupil and Ch. Simon, Phys. Rev. B 71, 104507 (2005).
- (6) S. Casalbuoni, L. von Sawilski, J. Kotzler, cond-mat/0310565.
- (7) W. DeSorbo, Phys. Rev. 135, A1190 (1965).
- (8) Y. Paltiel, E. Zeldov, Y. Myasoedov, M. L. Rappaport, G. Jung, S. Bhattacharya, M. J. Higgins, Z. L. Xiao, E. Y. Andrei, P. L. Gammel, and D. J. Bishop, Phys. Rev. Lett. 85, 3712 (2000).
- (9) A. Pautrat, J. Scola, C. Goupil, Ch. Simon, C. Villard, B. Domengs, Y. Simon, C. Guilpin, and L. Mchin Phys. Rev. B 69, 224504 (2004).
- (10) H. Ulmaier, Irreversible properties of type II superconductors, p 147, Edited by G. Hhler, Springer-Verlag Berlin Heidelberg New York (1975).
- (11) Y. Paltiel, G. Jung, Y. Myasoedov, M. L. Rappaport, E. Zeldov, S. Bhattacharya, and M. J. Higgins, Fluctuation and Noise Lett. 2, 31 (2002).
- (12) W. Marchevsky, M.J. Higgins and S. Bhattacharya, Nature 409, 591 (2001).
- (13) A. Pautrat, J. Scola, Ch. Simon, P. Mathieu, A. Brlet, C. Goupil, M. J. Higgins, and S. Bhattacharya, Phys. Rev. B 71, 064517 (2005).
- (14) R. D. Merithew, M. W. Rabin, M. B. Weissman, M. J. Higgins, and S. Bhattacharya Phys. Rev. Lett. 77, 3197 (1996).
- (15) P. Mathieu, B. Plaçais and Y. Simon, Phys. Rev. B 48, 7376 (1993).
- (16) H. J. Fink and R. D. Kessinger, Phys. Rev. 140, A1937 (1965).
- (17) We have also observed sharp peaks corresponding to in the sample (1). In contrast to , can be linked to a time of flight effect. This is an additional “ noise ” mechanism with long range coherence. Since its power turns out to be negligible compared to the broad band noise, it can be ignored for the present discussion.
- (18) E.H. Brandt, E. H. Brandt, Rep. Prog. Phys. 58, 1465 (1995).
- (19) I.O. Kulik, Sov. Phys. JETP 28, 461 (1969).
- (20) J.Scola, A.Pautrat et al, in preparation.