Magnetic field-induced quantum superconductor-insulator transition in
Abstract
A study of magnetic-field tuned superconductor-insulator transitions in amorphous thin films shows that quantum superconductor-insulator transitions are characterized by an unambiguous signature – a kink in the temperature profile of the critical magnetic field. Using this criterion, we show that the nature of the magnetic-field tuned superconductor-insulator transition depends on the orientation of the field with respect to the film. For perpendicular magnetic field, the transition is controlled by quantum fluctuations with indications for the existence of a Bose insulator; while for parallel magnetic field, the transition is classical, driven by the breaking of Cooper pairs at the temperature dependent critical field .
pacs:
73.50.-h, 74.25.-q,74.40.+k,74.78.-wQuantum fluctuations are believed to control the critical behavior of continuous Superconductor-Insulator Transitions (SIT) observed in disordered thin films of various metals Sondhi et al. (1997). Fine-tuning of the transition can be achieved either by applying a perpendicular magnetic field Hebard and Paalanen (1990); Paalanen et al. (1992); Yazdani and Kapitulnik (1995); Ephron et al. (1996); Marković et al. (1998); Gantmakher et al. (2000); Bielejec and Wu (2002); Sambandamurthy et al. (2004) or by varying the sheet resistance of the films – using film thicknessHaviland et al. (1989); Marković et al. (1999) or electrostatic fieldParendo et al. (2005).
These transitions have been found to be characterized by a critical resistance – where the Temperature Coefficient of Resistance(TCR) changes sign – and scaling behavior as predicted by the so-called ‘dirty boson’ model Fisher et al. (1990). In case of magnetic field-induced SIT, the ‘dirty boson’ model predicts that the SIT occurs simultaneously with the quantum melting and condensation of the vortex system Fisher (1990); Kramer and Doniach (1998). Indeed, because the dual representation of the vortex system is isomorph to a disordered two-dimensional boson system Nelson (1988), and because Cooper pairs in thin films can also be described by a two-dimensional boson system, it has been shown that this model is self-dual Fisher (1990). Thus, the superconducting state is characterized by localized vortices in a condensate of Cooper pairs; the insulating state, by localized Cooper pairs in a condensate of vortices.
However, experimentally, it is difficult to distinguish this Bose insulator from the standard fermionic insulator expected in two-dimensional disordered fermions systems Abrahams et al. (1979). Moreover, because the crossing point observed in the field dependence of the resistance curves measured at different temperatures is generally expected whenever the sample goes from superconducting () to insulating (), the conclusion about the quantum nature of the transition only relies on the temperature independence of this crossing point. Thus, for a given experiment, it can never be definitely excluded that the apparent temperature independence of the crossing point is not due to the finite resolution of measurements.
This ambiguity was particularly striking in a recent report of a comparison of parallel and perpendicular field-tuned SIT Gantmakher et al. (2000). In this experiment, no features in the data have been found that could distinguish the transitions observed in the two magnetic field configurations; while we do expect the nature of the transitions to be profoundly different for the two configurations.
Indeed, as described above, in a perpendicular magnetic field, the SIT is due to the quantum melting and condensation of the vortex glass; however, in a parallel magnetic field, because no vortices can be created in the sample, we expect the field-induced transition to be classical, due to the breaking of the Cooper pairs at .
In this letter, we report on a study of the magnetic field-tuned SIT in amorphous thin films for two orientations of magnetic field, parallel and perpendicular to the film plane. A careful examination of the SIT in the two configurations clearly shows that they hold distinct characteristics. For parallel magnetic fields, the transition is ‘classical’, due to the vanishing superconducting order parameter at the temperature dependent critical field ; whereas, for perpendicular magnetic field, the transition is controlled by quantum fluctuations, characterized by a temperature independent critical point and universal scaling behavior. Furthermore, a clear kink is observed in the temperature profile of the critical field that definitely indicates the peculiar (quantum) nature of the transition.
Amorphous thin films of are prepared under ultrahigh vacuum by e-beam co-evaporation of Nb and Si, with special care over the control and homogeneity of concentrations. Such films are known to undergo a transition from insulator to metal with increasing Nb concentration Dumoulin et al. (1993); Bishop et al. (1985); Lee et al. (2000). For this experiment, a series of six samples, numbered 1 to 6 in table 1, with stoichiometry and thicknesses ranging from down to , have been deposited onto sapphire substrates. Those films are highly stable and no significant changes of resistance are observed after a cycling between room and helium temperature.
Resistances were measured by employing a standard four-probe method, with ac lock-in detection operated at . The magnitude of the current is , which is well within the linear regime of the I-V characteristic. All electrical leads were filtered at from RF frequency.
| [Å] | ||||||
|---|---|---|---|---|---|---|
| 1 | 500 | 287 | 282 | 480 | 10.1 | 0.65 |
| 2 | 250 | 632 | 612 | 375 | 7.7 | 0.72 |
| 3 | 250 | 638 | 620 | 347 | 8.0 | 0.8 |
| 4 | 125 | 1401 | 1333 | 235 | 5.5 | 0.67 |
| 5 | 1000 | 152 | 530 | ? | ||
| 6 | 125 | 1430 | 1356 | 213 | 5.0 | 0.6 |
As shown in table 1, the sheet resistance of the samples increases from up to when film thickness decreases from down to . It is important to note that the normal state resistivities of these films are almost equal, which indicates that they are homogenously disordered, with the length scale for disorder potential only a few atomic spacings, as shown by structural studies Marrache-Kikuchi (2005).
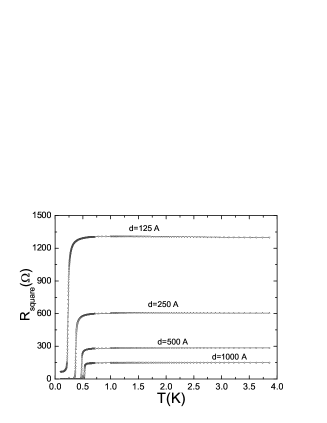
Figure 1 shows the temperature dependence for samples of different thicknesses. The superconducting transition temperature decreases for samples of increasing sheet resistance with no sign of reentrant behavior characteristic of granular systems, which is another indication of the homogeneity of the films. The decrease of the superconducting transition temperature is most likely due to the weakening of Coulomb screening in presence of disorder Finkel’stein (1987).

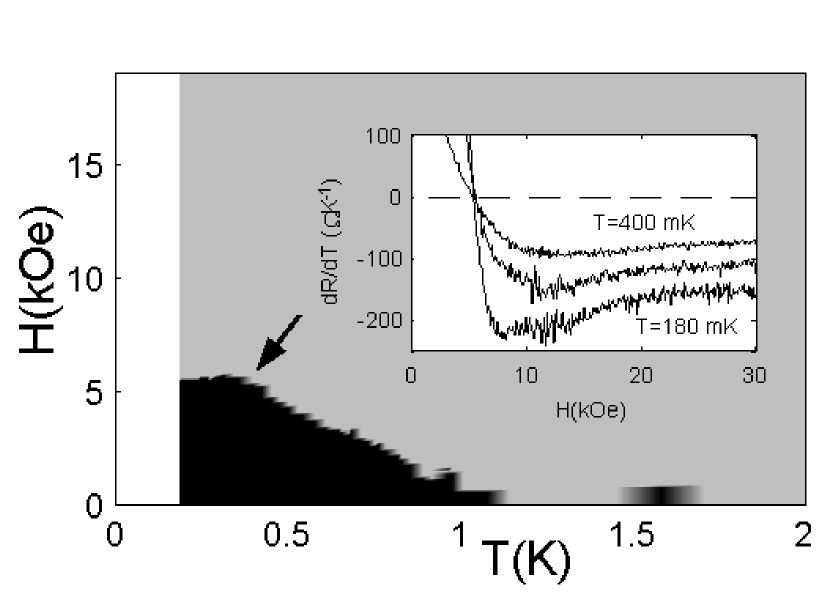
From now on, the data shown are measured on sample 4, Åthick. Figure 2 shows the temperature dependance for different values of a magnetic field applied normal to the thin film. At large magnetic fields, rises with decreasing temperature, signaling the onset of insulating behavior in the zero temperature limit. The resistance isotherms, measured as function of magnetic field at fixed temperatures between and , clearly show , inset of figure 2, the existence of a critical value of the magnetic field where . As shown in previous reports Hebard and Paalanen (1990); Paalanen et al. (1992); Yazdani and Kapitulnik (1995); Ephron et al. (1996); Marković et al. (1998); Gantmakher et al. (2000); Bielejec and Wu (2002); Sambandamurthy et al. (2004); Steiner et al. (2005), the insensitivity of this crossing point to temperature is the most striking characteristic of the data, and is believed to be the consequence of the quantum nature of the SIT. An alternative way to display the critical point is to plot the TCR, with a two-color scale, on the temperature-magnetic field plane, where light (dark) gray is used for negative (positive) TCR. At the crossing point, the TCR changes sign and is represented as the border line between the two colored regions. The color map clearly shows a kink in the temperature profile of the critical field, about . Below this temperature, the critical field is temperature-independent and represents, on this color-map, the crossing point (,). The kink clearly defines a temperature scale in the system – absent from classical transitions – that signal the peculiar nature of the transition; this kink may be interpreted as the temperature scale below which quantum fluctuations of the superconducting order parameter dominate the dynamics of the system.
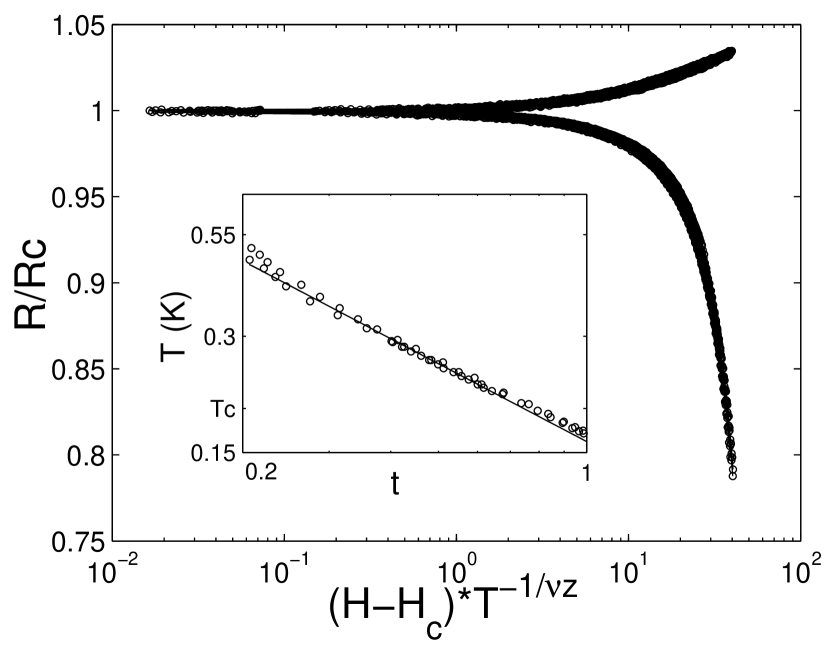
Using the value of the critical point just determined, we plot the ratio against the scaling variable , where is the correlation length exponent and the dynamical-scaling exponent.
The critical exponent product is obtained from the data using a numerical minimization procedure described in Ref. Marković et al. (1999). The procedure consists to plot versus and treat as an unknown variable. The value of is found when the best collapse between data measured at temperature T and the data measured at our lowest temperature() is obtained. A fit of the data t(T) with the function gives the exponent product ; note that the value of the exponent does not depend on the curve against which we test the collapse of the data, and figure 3 demonstrates the good collapse of the data for this value of the exponent. With increasing sample thickness, weaker insulating behavior is observed at high field, but the main aspects of the transition – critical point and scaling behavior – remain up to 500Å. Despite the fact that the value of the critical field is observed to increase and the critical resistance to decrease with increasing sample thickness, the value of the exponents are observed to remain identical, . Note that the scaling behavior of sample 5, Åthick, was difficult to analyze due its very weak insulating behavior and poorly defined critical point.
It has been argued that, due to long-range Coulomb interactions, the dynamical exponent should have the value Fisher et al. (1990), a value confirmed by independent measurement of and in MoGe Yazdani and Kapitulnik (1995). Assuming this value , it follows that , which is identical to exponent values obtained from the study of the field-tuned SIT in amorphous Bi films Marković et al. (1999) and amorphous Be films measured with high currents Bielejec and Wu (2002). However, exponent values have been obtained from field-induced SIT observed in Hebard and Paalanen (1990), MoGe Yazdani and Kapitulnik (1995), and amorphous Be films measured with low current Bielejec and Wu (2002). The reasons behind the observed differences are still unknown.
An exponent value agrees with numerical simulations of the (2+1)-dimensional classical XY model Cha and Girvin (1994) and the Boson-Hubbard model Kisker and Rieger (1997). This exponent is, however, inconsistent with the scaling theory of the dirty boson model, which predicts Fisher et al. (1990), and percolation-based model Shimshoni et al. (1998), which predicts .
An interesting feature of the data is that compelling scaling behavior, figure 3, and a well defined critical point, figure 2, are observed up to , above the superconducting critical temperature . This indicates that the critical behavior of the SIT is not affected by the dramatic change in the life-time of Cooper pairs, from infinite below to finite values above , in the fluctuating regime.
The value of the critical resistances found in our experiment are also inconsistent with the scaling theory, which predicts a universal value for the resistance at the quantum critical point. Instead, we find that the critical resistance changes with the sample sheet resistance, to span a large interval between and , see table 1. Such deviations of the critical resistance from the universal value have often been found Yazdani and Kapitulnik (1995); theoretically, it has been suggested that models including fermionic excitations may account for the excess conductivity at the critical point Kapitulnik et al. (2001); Galitski et al. (2005), while preserving the main characteristics of the quantum SIT : the critical point and scaling behavior.
Despite those inconsistencies between the data and the purely bosonic models, we will now show that the most representative characteristics of the field-tuned quantum SIT are not found when the same samples are submitted to a parallel magnetic field.

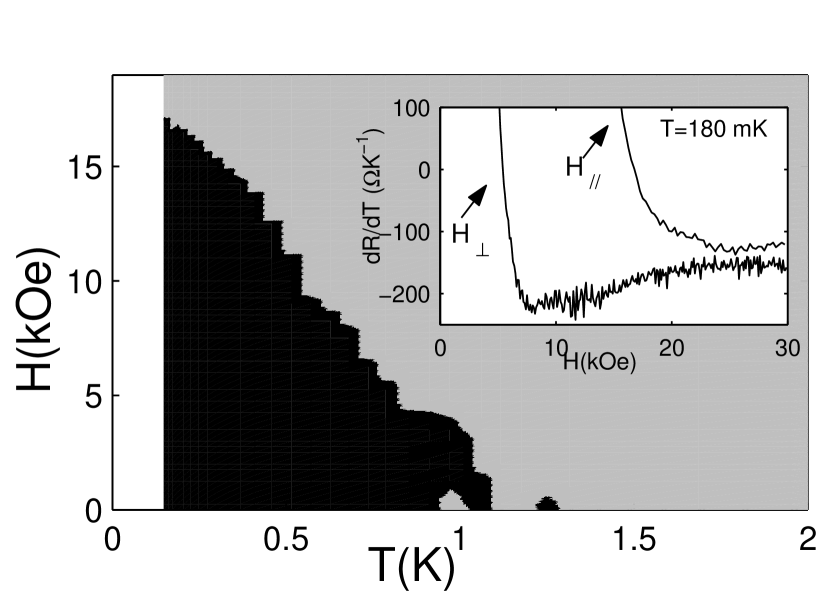
Figure 4 shows the temperature dependance for different values of the magnetic field applied parallel to the thin film plane. At large magnetic fields, we recover an insulating-like behavior of the sheet resistance, as in the previous situation. However, a close inspection of the transition shows that the position of crossing point (R,H), where a change of sign in TCR occurs, depends on temperature. The color map of the TCR sign does not show any temperature independent field scale or kink in the temperature profile of the critical field. Thus, the transition looks classical, due to the breaking of Cooper pairs at the temperature-dependant critical field .
An important aspect of the quantum SIT is the supposed existence of a bosonic insulator – formed of localized Cooper pairs – above the critical field. This Bose insulator should only exist for perpendicular magnetic field configuration; while for parallel magnetic field, the insulator is of fermion-glass type. Indications for two different types of insulators is found in the data.
In perpendicular magnetic field configuration, the inset of figure 2 shows that TCR has a local negative minimum that occurs at a field value about two times the critical field. The disappearance of this minimum at high temperature (400 mK) indicates that it is related to superconductivity. The inset figure 4 shows this data compared with TCR measured in parallel magnetic field. It clearly appears that the minimum observed in perpendicular magnetic field, , is well below the TCR measured in parallel magnetic fields,, and that no such local minimum exists for the data in parallel magnetic field configuration. Taken together, these observations suggest that, for perpendicular magnetic field, superconducting fluctuations are responsible of the stronger insulating behavior just above the critical field, which may be the signature of a Bose insulator. If this interpretation is correct, the subsequent increase of TCR above is due to the pair-breaking of Cooper pairs; the bosonic insulator is transformed progressively into a fermionic insulator toward high magnetic fields. This phenomenon received much attention recently with the observation of large negative magnetoresistance in amorphous Steiner et al. (2005).
To summarize, we have found that quantum SIT are characterized by an unambiguous signature – a kink in the temperature profile of the critical field. We used this signature to show definitely that the nature of magnetic field-induced SIT in disordered thin films of depends on the orientation of the magnetic field with the plane of the film. In perpendicular magnetic fields, the transition shows the archetypal features of a quantum SIT : a kink and a plateau in the temperature dependence of the critical field , a critical scaling behavior and stronger insulating behavior just above the critical field. In contrast, in parallel magnetic fields, the SIT looks classical, the superconductivity disappears at the temperature dependent critical field , due to the breaking of Cooper pairs.
The authors would like to thanks M. Aprili, A.M. Goldman and S. Vishveshwara for useful discussions.
References
- Sondhi et al. (1997) S. L. Sondhi, S. M. Girvin, J. P. Carini, and D. Shahar, Rev. Mod. Phys. 69, 315 (1997).
- Hebard and Paalanen (1990) A. F. Hebard and M. A. Paalanen, Phys. Rev. Lett. 65, 927 (1990).
- Paalanen et al. (1992) M. A. Paalanen, A. F. Hebard, and R. R. Ruel, Phys. Rev. Lett. 69, 1604 (1992).
- Yazdani and Kapitulnik (1995) A. Yazdani and A. Kapitulnik, Phys. Rev. Lett. 74, 3037 (1995).
- Ephron et al. (1996) D. Ephron, A. Yazdani, A. Kapitulnik, and M. R. Beasley, Phys. Rev. Lett. 76, 1529 (1996).
- Marković et al. (1998) N. Marković, C. Christiansen, and A. M. Goldman, Phys. Rev. Lett. 81, 5217 (1998).
- Gantmakher et al. (2000) V. F. Gantmakher, M. V. Golubkov, V. T. Dolgopolov, G. E. Tsydynzhapov, and A. A. Shashkin, JETP Lett. 71, 160 (2000).
- Bielejec and Wu (2002) E. Bielejec and W. Wu, Phys. Rev. Lett. 88, 206802 (2002).
- Sambandamurthy et al. (2004) G. Sambandamurthy, L. W. Engel, A. Johansson, and D. Shahar, Phys. Rev. Lett. 92, 107005 (2004).
- Haviland et al. (1989) D. B. Haviland, Y. Liu, and A. M. Goldman, Phys. Rev. Lett. 62, 2180 (1989).
- Marković et al. (1999) N. Marković, C. Christiansen, A. M. Mack, W. H. Huber, and A. M. Goldman, Phys. Rev. B 60, 4320 (1999).
- Parendo et al. (2005) K. A. Parendo, K. H. Sarwa, B. Tan, A. Bhattacharya, M. Eblen-Zayas, N. E. Staley, and A. M. Goldman, Phys. Rev. Lett. 94, 197004 (2005).
- Fisher et al. (1990) M. P. A. Fisher, G. Grinstein, and S. M. Girvin, Phys. Rev. Lett. 64, 587 (1990).
- Fisher (1990) M. P. A. Fisher, Phys. Rev. Lett. 65, 923 (1990).
- Kramer and Doniach (1998) A. Kramer and S. Doniach, Phys. Rev. Lett. 81, 3523 (1998).
- Nelson (1988) D. R. Nelson, Phys. Rev. Lett. 60, 1973 (1988).
- Abrahams et al. (1979) E. Abrahams, P. W. Anderson, D. C. Licciardello, and T. V. Ramakrishnan, Phys. Rev. Lett. 42, 673 (1979).
- Dumoulin et al. (1993) L. Dumoulin, L. Bergé, J. Lesueur, H. Bernas, and M. Chapellier, J. Low. Temp. Phys. 93, 301 (1993).
- Bishop et al. (1985) D. J. Bishop, E. G. Spencer, and R. C. Dynes, Solid State Electron. 28, 73 (1985).
- Lee et al. (2000) H. L. Lee, J. P. Carini, D. V. Baxter, W. Henderson, and G. Gruner, Science 287, 633 (2000).
- Marrache-Kikuchi (2005) C. A. Marrache-Kikuchi, PhD Thesis (2005).
- Finkel’stein (1987) A. M. Finkel’stein, JETP Lett. 45, 46 (1987).
- Steiner et al. (2005) M. Steiner, G. Boebinger, and A. Kapitulnik, Phys. Rev. Lett. 94, 107008 (2005).
- Cha and Girvin (1994) M.-C. Cha and S. M. Girvin, Phys. Rev. B 49, 9794 (1994).
- Kisker and Rieger (1997) J. Kisker and H. Rieger, Phys. Rev. B 55, 11981 (1997).
- Shimshoni et al. (1998) E. Shimshoni, A. Auerbach, and A. Kapitulnik, Phys. Rev. Lett. 80, 3352 (1998).
- Kapitulnik et al. (2001) A. Kapitulnik, N. Mason, S. A. Kivelson, and S. Chakravarty, Phys. Rev. B 63, 125322 (2001).
- Galitski et al. (2005) V. M. Galitski, G. Refael, M. P. A. Fisher, and T. Senthil, cond-mat p. 0504745 (2005).