Structural signatures of the unjamming transition at zero temperature
Abstract
We study the pair correlation function for zero-temperature, disordered, soft-sphere packings just above the onset of jamming. We find distinct signatures of the transition in both the first and split second peaks of this function. As the transition is approached from the jammed side (at higher packing fraction) the first peak diverges and narrows on the small- side to a delta-function. On the high- side of this peak, decays as a power-law. In the split second peak, the two subpeaks are both singular at the transition, with power-law behavior on their low- sides and step-function drop-offs on their high- sides. These singularities at the transition are reminiscent of empirical criteria that have previously been used to distinguish glassy structures from liquid ones.
pacs:
61.43.Fs, 81.05.Rm, 64.70.Pf,It is only natural to suspect that the dramatic dynamical arrest that occurs as a liquid is cooled into a glass must be accompanied by a signature in the underlying atomic arrangements. However, the atomic configurations in the liquid and glass are strikingly similar to one another. Over the years, the challenge to identify a subtle structural difference between the two states has led to the proposal of several empirical criteria Cargill (1970a); Wendt and Abraham (1978); Hiwatari (1980). In this paper, we revisit an old idea, due to Bernal Bernal (1964), of using static sphere packings to gain insight into the structure of amorphous systems Scott (1962); Cargill (1970b); Bennett (1972); Finney (1970a, 1977); Torquato and Stillinger (2002). We find that, with decreasing density, the structure of such packings changes distinctly as they unjam.
It is particularly revealing to study static packings of spheres interacting via a finite-ranged, purely-repulsive potential. There is a fundamental change in the mechanical properties in such systems, reminiscent of the glass transition Liu and Nagel (1998), as the packing fraction is varied across a well-defined unjamming/jamming transition at , which was found to coincide with the value of random close packing O’Hern et al. (2002, 2003). Above the system has nonzero static shear and bulk moduli, while below it costs no energy to shear or compress the system by an infinitesimal amount. Moreover, the unjamming transition in many ways resembles a critical point Bolton and Weaire (1990); Durian (1997); O’Hern et al. (2002, 2003); Makse et al. (2000); Silbert et al. (2005); Wyart et al. (2005a); Schwarz et al. ; Henkes and Chakraborty (2005), with many quantities, including a diverging length scale, behaving as power-laws as the transition is approached from higher density. Here we show that the unjamming transition exhibits clearly identifiable structural signatures associated with diverging quantities, even though both the jammed and the unjammed states are disordered. These structural characteristics are echoed in some of the empirical criteria Cargill (1970a); Wendt and Abraham (1978); Hiwatari (1980) that have previously been proposed for the glass transition.
The simulations reported here are for monodisperse, soft spheres of diameter that interact through the potential , for , and when . Here, is the center-to-center separation between two particles, measured in units of . We have studied both the harmonic, , and the Hertzian, , cases. Particles are defined to be in contact if they overlap. Our three-dimensional systems consist of spheres in periodic, cubic, simulation cells. To enable a systematic study of the approach to the unjamming transition, we employ conjugate-gradient energy minimization Press et al. (1992) to obtain configurations at various packing fractions . We average over ensembles of configurations at the same distance from the transition point, i.e., at the same values of , which is equivalent to averaging over systems with the same pressure O’Hern et al. (2002, 2003).
Structural signatures of jamming are more evident O’Hern et al. (2003) in the pair correlation function, , than in the structure factor, , even though the two functions are simply related by a Fourier transform. We therefore focus on the structural characteristics that signal the approach of the zero-temperature transition from the jammed side, through a detailed analysis of computed with extraordinary resolution. In particular, we study two features of that undergo dramatic changes at the unjamming transition: the first peak and the split second peak (i. e., the two subpeaks that merge with increasing temperature to become the second peak in a typical dense liquid). A plot of is shown in Fig. 1 above the jamming transition.

I First peak of
The dominant feature in is the first tall, sharp peak at (Fig. 1). Precisely at the jamming threshold, , this peak is a -function at ; is precisely zero for and has a power-law tail extending to . The weight under the -function is the coordination number at contact, . (As we discuss below, is a few percent less than the isostatic coordination number, for our -dimensional systems Alexander (1998); O’Hern et al. (2002, 2003).) For , there is some overlap between particles so that the delta-function peak broadens and shifts to . The broadening produces a tail extending to that disappears in the limit where vanishes.
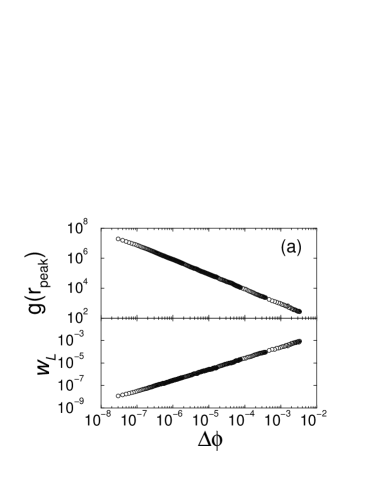
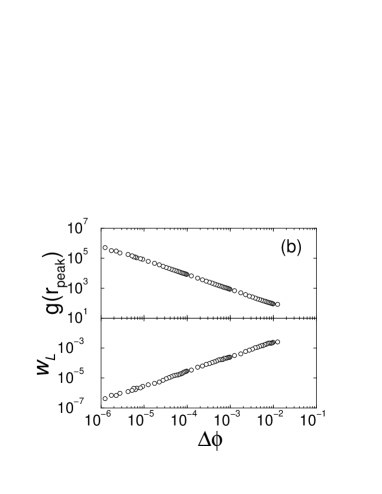
By analyzing the height of the first peak and its left-hand width, we showed O’Hern et al. (2003) that the peak approaches a delta-function as decreases towards zero. We have since obtained more systems over a wider range of . Figure 2 shows the dependence on of the first-peak height and its left-hand width for both harmonic and Hertzian potentials. Independent of the interaction potential, we find:
| (1) | |||||
| (2) |
These scalings are consistent with the area of the peak approaching a constant in the limit .
We turn now to the shape of the first peak in at for a system at , just above the jamming transition. As shown in Fig. 3(a), for the region , is almost strictly exponential with only a small curvature near its peak. It can be fit with the functional form:
| (3) |
where , with and .


As we compress the system above we see that the exponential behavior of the tail at gradually becomes more Gaussian as the system is compressed above the transition. This is shown in Fig. 3a-d. We can still use Eq. 3 to fit the shape, however, with different coefficients and . In Fig. 4 we show the evolution of and with . This evolution occurs more rapidly for Hertzian (not shown) than for harmonic spheres.

The results for have implications for the distribution of inter-particle normal forces, . This is shown in Fig. 5. At high compressions, is well-described by a Gaussian, but the tail straightens out towards an exponential as is lowered towards zero. These results are consistent with previous results of Makse, et al. Makse et al. (2000); Zhang and Makse (2005), who studied sphere packings at fixed pressure. (As we noted above, constant pressure corresponds to constant .) The Gaussian shape at high is consistent with expectations for equilibrium systems interacting with a harmonic potential O’Hern et al. (2001). However, these systems are at zero temperature, and it is unclear whether they can be described by a nonzero effective temperature. The exponential behavior at small agrees with experimental and simulation data on static granular packings of hard particles, which necessarily exist at packing fractions near Mueth et al. (1998); Makse et al. (2000); Silbert et al. (2002a).

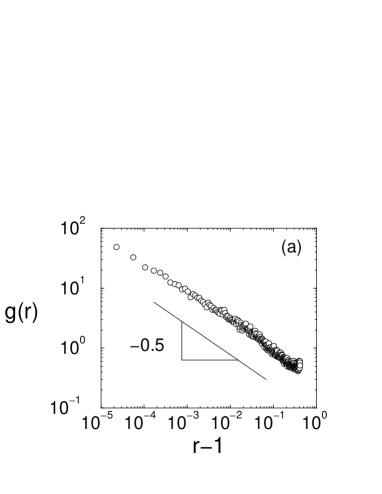
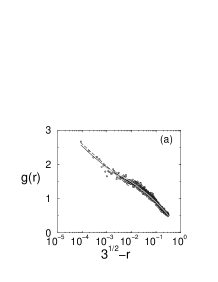
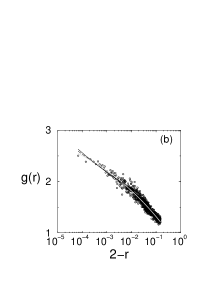
There is interesting behavior above the asymmetric first peak in as well as below it. Fig. 6(a) shows that versus varies as a power-law for a system just above the transition at :
| (4) |
with . This result was first reported for gravity-sedimented, granular packings Silbert et al. (2002b), but over a much smaller range in than presented here. We note that there is a very slight knee that occurs near . The asymptotic power law behavior near should be determined only from the region below this knee. As we will show below, this knee becomes more pronounced as increases.
The number of neighbors, , that are separated by a distance of at most Gotoh and Finney (1974) is given by the integral
| (5) |
This is shown in Fig. 6(b). Therefore, Fig. 6(a) and Eq. 4 imply, that for a system at the transition, should increase with as
| (6) |
where is defined in Eq. 4 and is the average number of neighbors per particle at contact at the transition. This scaling is consistent with the one reported by O’Hern et al. O’Hern et al. (2002), who looked at how the excess coordination number increased as a system was incrementally compressed above . We note that we have found a similar exponent of using the Hertzian interaction potential, , as we found for the harmonic potential, .

Donev et al. Donev et al. (2005) also calculated the number of neighbors near the transition, but for a system of hard spheres. When they plotted versus they found that the slope was closer to 0.6 than 0.5. They argued that this implies that for hard spheres, which is different from our result for soft repulsive spheres (Eq. 6). Based on this difference, they concluded that the power-law behavior seen for is not universal and depends on the interparticle potential as well as perhaps the procedure leading to the configuration.
However, that conclusion does not follow from their analysis. The confusion occurs because their results were for a system in which all the rattlers (that is, particles without any neighbors) had been removed. It is not surprising that this changes the nature of the pair correlation function from a system, such as ours, where all particles are considered. That is, we analyze the system directly as produced by energy minimization without performing the additional step of removing particles that do not happen to be part of the backbone of the structure. Whether one chooses to remove rattlers or not depends on the physics one wants to study. Here we remark that it is more natural to include rattlers in if one is going to compare to any experiment. We also note that rattlers can join the backbone when the system is perturbed, and can therefore influence the system’s response and stability, as argued in Ref. Wyart et al. (2005b). Finally, we claim that the conclusion of Donev, et al. that the power-law exponent depends on the potential of interaction or the algorithm for creating the states (aside from removing one class of particles by hand) is unfounded. Rather, the difference arises from whether one studies systems with rattlers included or removed. When Donev, et al. include rattlers in their analysis, they also find an exponent closer to 0.5 Torquato , consistent with what we have found here and in previous work Silbert et al. (2002b); O’Hern et al. (2002, 2003).
There is a difference between and . is the number of contacts only for a system that has all rattlers removed from the system. If the rattlers are not removed from the system then . Because , for example measured in an experiment, does not distinguish between rattlers and particles belonging to the connected backbone of the structure, one must use in Eqs. 6. Indeed, calculating either directly as in Ref. Donev et al. (2005), or integrating via Eq. 5, are identical only when using , and not in Eq. 6. If denotes the total number of particles, the number of overlapping pairs, and the total number of rattlers, then while . Although only of the particles are rattlers at the transition, their exclusion can produce a change of the power law exponent.
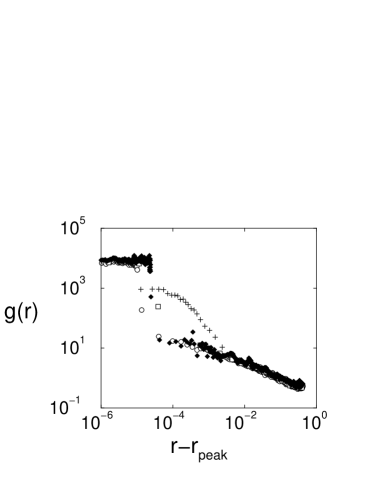
We find that the observed power-law for depends on (see Fig. 7(a)). As increases, the knee in near becomes more prominent. In the region below this knee (i. e., at smaller ), the slope of versus decreases. We show this slope, , as a function of in Fig. 7(b). As approaches zero, the value of increases and approaches . A similar trend was noted in the X-ray tomography experiments of Aste et al. Aste et al. (2004), who measured inside large, granular packings. Note that Donev, et al. Donev et al. (2005) study configurations below the unjamming transition, and it is not clear if the apparent value of also changes as the density is decreased below .
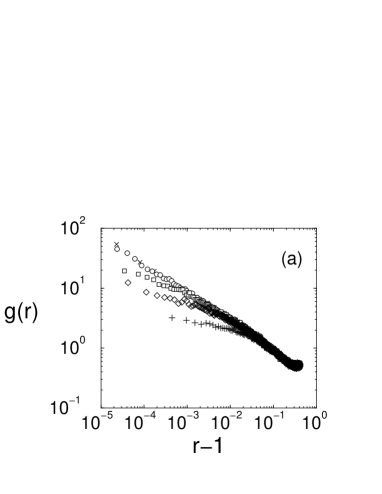

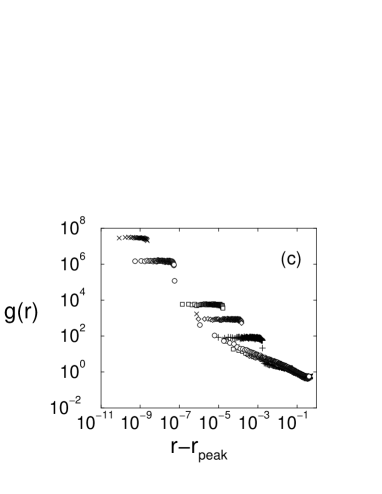
Fig. 7(c) shows, for different values of , how behaves in the region from out to the first minimum at . There are several notable features in in the vicinity of contact that are apparent when versus is plotted on axes. There is a drop in that occurs at for each value of (note that this corresponds to different values of for different ). The separation distinguishes particles that are overlapping from those which are just out of contact. The magnitude of the jump decreases, and the extent of the power-law region described by Eq. 4 also decreases, as the system is progressively compressed above the unjamming transition. The region beyond contact is relatively unaffected by compression. (Although the power law exponent changes slowly with as highlighted in Fig. 7(b), by far the largest change occurs in crossing from to .) This indicates that as the system is compressed, particles are depleted from the region beyond contact, , and are absorbed into the contact region, .
We have determined that this drop in is not an artifact of the zero-temperature system. We have used several different protocols for creating particle configurations, as shown in Fig. 8 and described in its caption. Evidently, the drop in persists to finite temperature.
Why should there be an abrupt drop in at ? One possibility is that, to a first approximation, compression only changes the nearest-neighbor spacing of particles that are already in contact, that is, within a distance of each other. Particles separated by a distance may not be moved appreciably closer to one another by compression. Instead, we suggest that upon compression, the movement of particles that are not yet overlapping is predominantly in a direction perpendicular to the line connecting them. This is consistent with our data.
As the system is compressed and particles are incorporated into the contact region, the number of overlapping pairs increases. As mentioned above, the average number of overlapping neighbors per particle, , increases with compression as . As this occurs, the distribution of values, , also shifts. This is shown in Fig. 9. Close to the transition, most particles have 6 overlapping neighbors. As the system is compressed to , the maximum shifts to but there is still no observable weight at .

II Split second peak of
The approach of the unjamming point is also apparent in features associated with the second peak in . Figure 10 shows this region of for several values of . For the system closest to jamming, at , (Fig. 10(a)) there is a pronounced splitting of the second peak in into two sub-peaks, located at and . Such a splitting of the second peak has long been known Cargill (1970a). Indeed, the emergence of a split second peak was one of the early criteria used to signal the onset of the glass phase in supercooled liquids Wendt and Abraham (1978).

On the small- side of both of these sub-peaks we find that increases rapidly. In Fig. 11, we have attempted to characterize these features for the system closest to the transition. In that figure we plot versus and . We have not been able to tell whether itself diverges or whether the divergence appears only in its slope, . We would need to average over many more systems to tell these two possibilities apart unambiguously. Our best fits to the two possible cases are:
| (7) | |||||
| (8) | |||||
| (9) |
and
| (10) | |||||
| (11) | |||||
| (12) |
where the fit parameters are provided in Table 1.
| [h] First sub-peak | Second sub-peak |
|---|---|
| = 0.9 | = 1.1 |
| = 0.12 | = 0.08 |
| = 2.75 | = 2.8 |
| = 0.16 | = 0.12 |
| = 0.25 | = 0.15 |
On the high- side of each sub-peak, it is clear from Fig. 10(a) that there is both a step-function drop-off Finney (1970b); Donev et al. (2005) and an additional smooth decrease of with increasing . Although, from these data, we cannot unambiguously determine a functional form for this last smooth decrease, the data suggest that it might be fit with
| (13) |
where and and for the first and second sub-peaks, respectively. As the system is compressed above the transition, the structure around both sub-peaks becomes rounded. In particular, it is only in the limit of that the drop-off becomes a sharp step-function.
Here, we suggest a simple interpretation of the origin of the step-function drop-off in on the high- side of both sub-peaks. At the jamming transition, each particle must be held in place by particles that are just in contact with no overlap. At that point there is an average of precisely neighbors per particle in the force network. It seems plausible that the second-nearest-neighbor peaks originate from pairs of particles that have at least one neighbor in common, while pairs that do not have a common neighbor contribute only to a slowly-varying background.
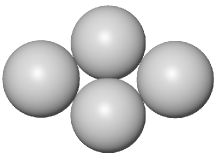
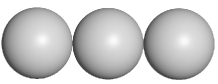
The separation corresponds to two particles on diametrically opposite sides of a common neighbor (Fig. 12, right figure). This is the largest distance that can separate two particles that have one common neighbor. The separation corresponds to the largest possible separation between two particles, and , that have two common neighbors (Fig. 12, left figure). In this case the four particles lie in the same plane; the two common neighbors touch and the particles and are on opposite sides of the crease between them. When is only slightly greater than , there can no longer be any contribution from two particles that share a common neighbor. Similarly, when is only slightly greater than , there can be no contribution from pairs of particles that share two common neighbors. This leads to step-function drop-offs at and .
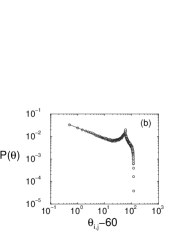
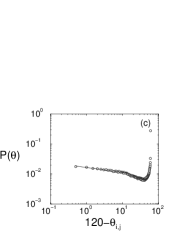
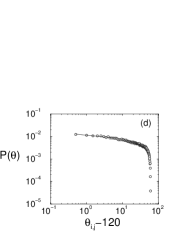
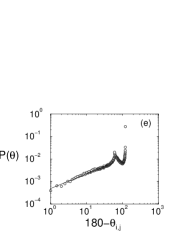
Support for the hypothesis that the drop-offs are due to pairs of particles that share common neighbors can be obtained from the angular correlations between two neighbors of a common particle. We show this angular correlation, , in Fig. 13, where is defined in the sketch in the inset. At (which corresponds to particles separated by ) Fig. 13(d) shows that the distribution goes to zero as,
| (14) |
If the sub-peak at arises from pairs that share one common neighbor, then the form of just below should be related to the form of just below by
| (15) |
where the Jacobian factor diverges as
| (16) |
Thus, Eq. 15 implies
| (17) |
This is in reasonable agreement with the fit in Eq. 11, where we found , implying that the second sub-peak does indeed arise from two particles that share a common neighbor and that this leads to the observed step-function drop-off just above . However, we should note that this argument does not necessarily imply that diverges at , as indicated by Eq. 17, since we cannot determine the behavior of asymptotically close to with sufficient accuracy.
By a similar argument, if the first sub-peak arises from pairs of particles that share two common neighbors, then the peak at corresponds to . For , we find
| (18) |
This behavior implies ; this result is not too different from the fit in Eq. 7, which suggests . This consistency check suggests that the first sub-peak does indeed arise from pairs of particles that share two common neighbors.

Although pairs with two common neighbors cannot contribute to for , pairs with only one common neighbor can still contribute. Such pairs may account for the smooth decrease in (see Eq. 13) just above .
III Discussion
We have shown that the unjamming transition is accompanied by several features in the pair correlation function:
-
•
A delta-function at with area .
-
•
A power-law at of the form .
-
•
A sub-peak at that either diverges or has diverging slope as and that has a step-function drop-off just above .
-
•
A sub-peak at that either diverges or has diverging slope as and that has a step-function drop-off just above .
These features appear for both harmonic and Hertzian repulsions, and therefore seem to be purely geometrical features of the jamming/unjamming transition at zero temperature.
Here, we suggest that some of these structural features are reflected in a less extreme form in the two primary empirical criteria that have been used extensively in the literature to identify the glass transition. The first is the ratio, , of the first minimum to the first maximum in . As the temperature of a glass-forming liquid decreases, decreases. Wendt and Abraham Wendt and Abraham (1978) proposed that corresponds to a reasonable estimate of the glass transition temperature, . We note that at the unjamming transition we have studied here, . It is possible that the decrease in observed as is lowered towards is a remnant of the vanishing of that occurs at the unjamming transition. The latter property may be the underlying reason for the success of this empirical criterion.
A second popular empirical criterion concerns the second peak of . As is lowered towards , the second peak splits into two sub-peaks. The flattening of the second peak that signals its splitting has been used to identify Wendt and Abraham (1978). We suggest that the splitting may reflect the singular sub-peaks that occur at jamming/unjamming transition. The singular nature of the splitting at this transition may provide the fundamental underpinnings of this criterion.
Acknowledgements.
We thank Bulbul Chakraborty and Corey O’Hern for instructive discussions and Salvatore Torquato for comments on our manuscript. We also gratefully acknowledge the support of NSF-DMR-0087349 (AJL), NSF-DMR-0352777 (SRN), DE-FG02-03ER46087 AJL,LES), and DE-FG02-03ER46088 (SRN,LES).References
- Cargill (1970a) G. S. Cargill, J. App. Phys. 41, 2248 (1970a).
- Wendt and Abraham (1978) H. R. Wendt and F. F. Abraham, Phys. Rev. Lett. 41, 1244 (1978).
- Hiwatari (1980) Y. Hiwatari, J. Phys. C: Solid St. Phys. 13, 5899 (1980).
- Bernal (1964) J. D. Bernal, Proc. Roy. Soc. Lond. A 280, 299 (1964).
- Scott (1962) G. D. Scott, Nature 194, 956 (1962).
- Cargill (1970b) G. S. Cargill, J. App. Phys. 41, 12 (1970b).
- Bennett (1972) C. H. Bennett, J. App. Phys. 43, 2727 (1972).
- Finney (1970a) J. L. Finney, Proc. Roy. Soc. Lond. A 319, 495 (1970a).
- Finney (1977) J. L. Finney, Nature 266, 309 (1977).
- Torquato and Stillinger (2002) S. Torquato and F. H. Stillinger, J. Phys. Chem. B 106, 8354 (2002).
- Liu and Nagel (1998) A. J. Liu and S. R. Nagel, Nature 396, 21 (1998).
- O’Hern et al. (2002) C. S. O’Hern, S. A. Langer, A. J. Liu, and S. R. Nagel, Phys. Rev. Lett. 88, 075507 (2002).
- O’Hern et al. (2003) C. S. O’Hern, L. E. Silbert, A. J. Liu, and S. R. Nagel, Phys. Rev. E 68, 011306 (2003).
- Bolton and Weaire (1990) F. Bolton and D. Weaire, Phys. Rev. Lett. 65, 3449 (1990).
- Durian (1997) D. J. Durian, Phys. Rev. E 55, 1739 (1997).
- Makse et al. (2000) H. A. Makse, D. L. Johnson, and L. M. Schwartz, Phys. Rev. Lett. 84, 4160 (2000).
- Silbert et al. (2005) L. E. Silbert, A. J. Liu, and S. R. Nagel, Phys. Rev. Lett. 95, 098301 (2005).
- Wyart et al. (2005a) M. Wyart, S. R. Nagel, and T. A. Witten, Europhys. Lett. 72, 486 (2005a).
- (19) J. Schwarz, A. J. Liu, and L. Q. Chayes, arXiv:cond-mat/0410595.
- Henkes and Chakraborty (2005) S. Henkes and B. Chakraborty, Phys. Rev. Lett. 95, 198002 (2005).
- Press et al. (1992) W. H. Press, S. A. Teukolsky, W. T. Vetterling, and B. P. Flannery, Numerical recipes in Fortran 77 (Cambridge, U.K., 1992), Second ed.
- Alexander (1998) S. Alexander, Phys. Rep. 296, 65 (1998).
- Zhang and Makse (2005) H. P. Zhang and H. A. Makse, Phys. Rev. E 72, 011301 (2005).
- O’Hern et al. (2001) C. S. O’Hern, S. A. Langer, A. J. Liu, and S. R. Nagel, Phys. Rev. Lett. 86, 111 (2001).
- Mueth et al. (1998) D. M. Mueth, H. M. Jaeger, and S. R. Nagel, Phys. Rev. E 57, 3164 (1998).
- Silbert et al. (2002a) L. E. Silbert, G. S. Grest, and J. W. Landry, Phys. Rev. E 66, 061303 (2002a).
- Silbert et al. (2002b) L. E. Silbert, D. Ertaş, G. S. Grest, T. C. Halsey, and D. Levine, Phys. Rev. E 65, 031304 (2002b).
- Gotoh and Finney (1974) K. Gotoh and J. L. Finney, Nature 252, 202 (1974).
- Donev et al. (2005) A. Donev, S. Torquato, and F. H. Stillinger, Phys. Rev. E 71, 011105 (2005).
- Wyart et al. (2005b) M. Wyart, L. E. Silbert, S. R. Nagel, and T. A. Witten, Phys. Rev. E 72, 051306 (2005b).
- (31) S. Torquato, private communication.
- Aste et al. (2004) T. Aste, M. Saadatfar, A. Sakellarious, and T. J. Senden, Physica A 339, 16 (2004).
- Finney (1970b) J. L. Finney, Proc. Roy. Soc. Lond. A 319, 479 (1970b).