Critical Phenomena and the Quantum Critical Point of Ferromagnetic Zr1-xNbxZn2
Abstract
We present a study of the magnetic properties of Zr1-xNbxZn2, using an Arrott plot analysis of the magnetization. The Curie temperature TC is suppressed to zero temperature for Nb concentration xC=0.0830.002, while the spontaneous moment vanishes linearly with TC as predicted by the Stoner theory. The initial susceptibility displays critical behavior for x xC, with a critical exponent which smoothly crosses over from the mean field to the quantum critical value. For high temperatures and xxC, and for low temperatures and xxC we find that =+aT4/3, where vanishes as xxC. The resulting magnetic phase diagram shows that the quantum critical behavior extends over the widest range of temperatures for x=xC, and demonstrates how a finite transition temperature ferromagnet is transformed into a paramagnet, via a quantum critical point.
pacs:
71.10.Hf,75.10.Lp,75.40.CxZero temperature phase transitions and their attendant quantum critical fluctuations have emerged as dominant features in the phase diagrams of different types of strongly correlated electron systems, from oxide superconductors orenstein2000 and heavy fermion compounds doniach1977 ; stewart2001 , to low dimensional materials emery1979 . These fluctuations qualitatively modify the electronic states near a quantum critical point (QCP), leading to unusual temperature divergences of the susceptibility and heat capacity, to anomalous power law behavior in the electrical transport, and even to scale invariance in the magnetic responses montfrooij2003 ; aronson2001 ; aronson1995 ; schroder2000 ; hayden1991 . The fundamental excitations near QCPs are qualitatively unlike those of conventional metals, representing in some cases entirely new classes of collective states laughlin2000 ; senthil2004 . A central issue is whether these unusual properties require the exceptionally rich physics of these host systems, derived from low dimensionality and strong correlations, or whether only proximity to a zero temperature phase transition is required. Thus, it is important to identify electronically simple systems, and to study the evolution of their critical phenomena as the ordered phases are suppressed to zero temperature.
Itinerant ferromagnets are particularly attractive hosts for such a study, as they lack the complex interplay of itinerant and localized character found near the QCPs of heavy fermion systems schroder2000 ; si2001 . Pressure and compositional variation have been used to suppress the finite temperature magnetic ordering transition, finding that the magnetically ordered phase can vanish discontinuously as in pressurized MnSi pfleiderer1997 , UGe2 pfleiderer2002 , and perhaps ZrZn2 uhlarz2004 ; knapp1971 ; smith1971 ; huber1975 ; grosche1995 , or continuously as in (Ni1-xPdx)3Al sato1975 . While disorder can affect the order of the quantum critical phase transition in itinerant ferromagnets belitz2002 , it is generally found in systems with continuous transitions tuned by a parameter that the QCP which occurs for = and T=0 dominates the magnetic phase diagram and generates a phase line T(-), where d=3, z=n+2=3 millis1993 ; pfleiderer1997 ; grosche1995 ; julian1996 . Near the QCP, the electronic part of the heat capacity is maximized thompson1989 ; wada1990 ; fuller1993 ; tateiwa2001 ; vollmer2002 while the electrical resistivity evolves from T1+δ for to the Fermi liquid T2 for oomi1998 ; pfleiderer2001 ; steiner2003 ; grosche1995 . The low field magnetization is anomalous near the QCP grosche1995 ; pfleiderer1997 , but a detailed study spanning the ordered and paramagnetic phases remains lacking. We provide this study of the magnetization of ZrZn2 here, discussing how the QCP is generated with Nb doping, and the subsequent evolution of the critical phenomena as the QCP is approached.
Zr1-xNbxZn2 is ideal for such a study. Neutron form factor measurements pickart1964 show that the magnetic moment is spatially delocalized, consistent with the small spontaneous moment matthias1958 . We establish a magnetic phase diagram, and show that it is dominated by a QCP at xC = 0.0830.002 and TC = 0 K. Stoner theory describes the ferromagnetism of ZrZn2 well, indicating that variation in the density of states at the Fermi level controls both the Curie temperature TC and the zero temperature spontaneous moment m0(0). Our measurements of the initial magnetic susceptibility (T) describe how the critical phenomena evolve with Nb doping, crossing over from mean field behavior when the reduced temperature is low and when Nb concentrations are far from the critical value, to a regime at small x-xC where the susceptibility is controlled by the QCP over an increasingly broad range of temperatures.
Polycrystalline Zr1-xNbxZn2 samples with Nb concentrations were prepared by solid state reaction ogawa1967 . X-ray diffraction confirmed the C-15 ZrZn2 structure matthias1958 at each composition, as well as residual amounts of unreacted Zr and Zn. The magnetization was measured using a Quantum Design magnetometer at temperatures from 1.8 K to 200 K and in magnetic fields up to 7 T. The inset of Fig. 1a shows the magnetic isotherms for Zr1-xNbxZn2 (x = 0.03) presented as an Arrott plot. Both the spontaneous magnetization m0(T) = m(H, T) and the initial susceptibility (T) = dm(H, T)/dH were determined by extrapolation of data from fields larger than 4.5 T. Previous de Haas-van Alphen experiments on a single crystal of ZrZn2 found a field induced transition in the magnetization near 5 T kimura2004 , and a complex pressure - temperature phase diagram was proposed for this sample uhlarz2004 . However, our Arrott plots are linear in fields from 1 T - 7 T, at least at low temperatures and for small x, indicating that this field-driven transition is absent, as it was in earlier work ogawa1967 ; huber1975 ; seeger1995 . The temperature dependence of m0(T) is plotted in Fig. 1a, showing that Nb doping continuously reduces TC and the zero temperature spontaneous moment m0(0). Fig. 1a shows that for each xxC, m0 is described by the mean field expression m0() = m0(0), where = 0.5 and = (TC-T)/TC. The suppression of TC with Nb doping is shown in Fig. 1b, demonstrating that the ferromagnetic phase line obeys the expected T=T4/3(x-xC) (d=z=3, n=1) millis1993 , terminating at a critical concentration xC=0.0830.002, analogous to the results of high pressure measurements grosche1995 .
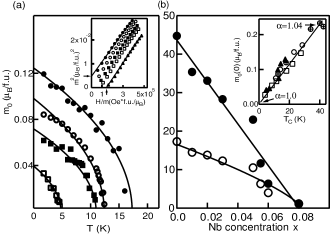
The suppression of TC and m0 with Nb doping indicates that the Stoner theory adequately describes the ferromagnetism in ZrZn2, where the underlying control parameter is the product of the Coulomb interaction and the density of states at the Fermi level. Stoner theory predicts that Tc and m0(0) are proportional for 1. The inset of Fig. 1b shows this proportionality is valid not only for our Nb doped samples, but also for those with Ti, Hf, and Y doping ogawa1968 , those with modified stoichiometry knapp1970 ; knapp1971 and even when high pressures are applied huber1975 ; grosche1995 ; uhlarz2004 . Values of are indicated in the inset of Fig. 1b, suggesting that modifications to the underlying electronic structure and not the disorder associated with doping are primarily responsible for altering the stability of ferromagnetism in ZrZn2. Indeed, only a two percent reduction in is necessary to drive the ferromagnetism in undoped ZrZn2 to the brink of instability, whether by doping or by the application of pressure.
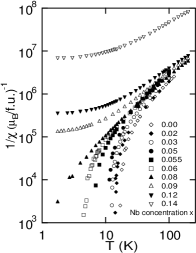
The initial magnetic susceptibility is considerably modified as the system is driven from a finite temperature instability in undoped ZrZn2, through a QCP, and into the paramagnetic phase. Arrott plot analyses are used to deduce (T) = dH/dm(H, T) shown in Fig. 2 for a wide range of Nb concentrations x. diverges at TC in the ferromagnetic samples (xxC), with little sign of critical rounding. The sample with x=0.08 displays a nearly power-law response in absolute temperature, as expected near a QCP millis1993 ; lonzarich1997 . Finally, for xxC, (T) approaches a constant value as T0, signalling that long range ferromagnetic order is no longer possible.
The initial susceptibility for xxC is well described by a power law = over at least two decades of reduced temperature =(T-TC)/TC, and for absolute temperatures as large as 100 K (Fig. 3a). The inset of Fig. 3a shows that increases smoothly from the near-mean field value 1.080.05 previously observed in ZrZn2 seeger1995 , to 1.330.01 for xxC. Since the interactions which lead to magnetic order in itinerant ferromagnets are long ranged, the intrinsic exponents related to the underlying symmetries are only found at reduced temperatures which are much smaller than those accessed in our experiments. seeger1995a ; seeger1989 ; kaul1985 . We conclude that the variation of with Nb concentration is the result of a gradual crossover from the mean field behavior associated with a finite temperature ferromagnetic transition for xxC to quantum criticality as xxC.
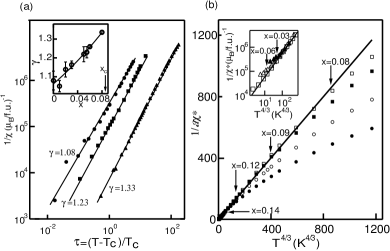
Isolating the temperatures and Nb concentrations where is dominated by the QCP is straightforward in the paramagnetic regime (xxC). Near the QCP, the initial susceptibility for an itinerant, three dimensional ferromagnet is given by = + aT4/3, with (x-xC) millis1993 . The variation of with Nb concentration x is plotted in the lower panel of Fig. 4. As predicted, vanishes approximately linearly with (x-xC), while a changes by less than 10 . The temperature dependent part of the initial susceptibility is isolated by defining 1/=(-). 1/a is plotted in Fig. 3b as a function of T4/3 for each of the three paramagnetic concentrations with x=0.09, 0.12, and 0.14, and for comparison x=0.08, which has TC = 1.20.l K. Fig. 3b demonstrates that 1/a=T4/3 below a temperature T∗ which vanishes at x=0.15 (Fig. 4), the termination of quantum criticality for xxC.
Quantum criticality is also observed for xxC, although the critical phenomena associated with the finite temperature ferromagnetic transition ultimately dominate as TTC. Since = +aT4/3, with (x-xC), the quantum critical susceptibility is largest for xxC, and extends over the broadest range of absolute temperatures, since T0. This is demonstrated in the inset of Fig. 3b, where we have plotted 1/=- as a function of T4/3. For xxC, the T4/3 behavior is only found above a temperature TG which grows rapidly with (x-xC), as shown in Fig. 4. The lower panel of Fig. 4 shows that for x xC, 1/ decreases approximately linearly with (x-xC), while the magnitude a of the T4/3 term is approximately independent of x, as in the paramagnetic phase xxC.
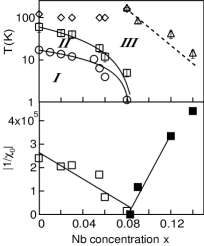
Our magnetization measurements establish that the phase diagram of Zr1-xNbxZn2 has three different regimes, depicted in Fig. 4. Ferromagnetic order is found in Region I, below a phase line TC(x) which is controlled by the x=xC, TC=0 QCP. The Stoner criterion which describes the stability of ferromagnetism remains unchanged even as xxC, indicating that the reduction in the electronic density of states drives the QCP. The spontaneous moment obeys the mean field expression, mo()=mo(0) in Region I.
Simple power law divergences with reduced temperature are found in Region II, ()=, and the enhancement of as x xC reveals that Region II is best considered a crossover region, controlled by the relative magnitudes of and (x-xC). Specifically, for small and large (x-xC), we find the mean field behavior of a finite transition temperature ferromagnet . In the opposite limit (small (x-xC) and large T) we find that the QCP is dominant, yielding a+bT4/3. Accordingly, it is possible to identify the quantum critical behavior of a three dimensional ferromagnet =+aT4/3 above a temperature TG which decreases rapidly as xxC.
The quantum critical regime III is also extensive for paramagnetic concentrations xxC, occurring below a temperature T∗ which is almost 150 K for x=xC, and dropping rapidly at larger x. Region III extends to the highest temperatures investigated for xxC. We speculate that the boundary of the quantum critical regime for xxC coincides with the condition that the correlation length is reduced to some minimal length, such as the lattice constant. The phase diagram suggests that this occurs at T=0 for x 0.15, but at increasingly high temperatures T∗ as x approaches xC from above.
The quantum critical behavior documented in this work is in excellent agreement with theoretical predictions for a three dimensional TC=0 ferromagnet. The TC=0, x=xC QCP affects a surprisingly broad area of the x-T phase diagram, competing with the conventional critical phenomena for even xxC. We find no indication of new collective phases near the QCP in Zr1-xNbxZn2, and suggest that further measurements at lower temperatures and with refined samples would be very interesting to further pursue this issue.
Work at the University of Michigan was performed under grant NSF-DMR-0405961. Work at FSU was supported by NSF-DMR-0433560. We acknowledge useful conversations with A. J. Millis, M. B. Maple, K. V. Kamenev, M. E. J. Newman and L. Sander, as well as the hospitality and support of J. E. Crow and the National High Magnetic Field Laboratory in Tallahassee during the early stages of this work.
References
- (1) J. Orenstein and A. J. Millis, Science , 468 (2000).
- (2) S. Doniach, Physica , 231 (1977).
- (3) G. R. Stewart, Rev. Mod. Phys. , 797 (2001).
- (4) V. J. Emery in Highly Conducting One-Dimensional Solids, ed. J. T. Devreese, R. P. Evrard, and V. E. van Doren (New York, Plenum, 1979) p. 247.
- (5) W. Montfrooij, M. C. Aronson et al., Phys. Rev. Lett. , 087202 (2003).
- (6) M. C. Aronson et al., Phys. Rev. Lett. , 197205 (2001).
- (7) M. C. Aronson et al., Phys. Rev. Lett. , 725 (1995).
- (8) A. Schröder et al., Nature (London) , 351 (2000).
- (9) S. M. Hayden et al., Phys. Rev. Lett. , 821 (1991).
- (10) R. B. Laughlin et al., Proc. Nat. Acad. Sci. , 32 (2000).
- (11) T. Senthil et al., Science , 1490 (2004).
- (12) Q. Si et al., Nature , 804 (2001).
- (13) C. Pfleiderer et al., Phys. Rev. B. , 8330 (1997).
- (14) C. Pfleiderer and A. D. Huxley, Phys. Rev. Lett. , 147005 (2002).
- (15) M. Uhlarz et al., Phys. Rev. Lett. , 256404 (2004). It has subsequently been shown that samples of this type are nonstoichiometric, especially near their surfaces (E. A. Yelland et al., cond-mat/0502341). The elevated Curie temperature of these samples may also be a signature of Zn deficiency knapp1971 . The pressure driven QCP in near-stoichiometric ZrZn2 was previously shown to be second order smith1971 ; huber1975 ; grosche1995 .
- (16) G. S. Knapp et al., J. Appl. Phys. , 1341 (1971).
- (17) T. F. Smith et al., Phys. Rev. Lett. , 1732 (1971).
- (18) J. G. Huber et al., Solid State Commun. , 211 (1975).
- (19) F. M. Grosche et al., Physica B , 20 (1995).
- (20) M. Sato, J. Phys. Soc. Japan , 98 (1975).
- (21) D. Belitz, T. R. Kirkpatrick, Phys. Rev. Lett. , 247202 (2002).
- (22) A. J. Millis, Phys. Rev. B , 7183 (1993).
- (23) S. R. Julian et al., J. Phys.: Condensed Matter , 9675 (1996).
- (24) J. D. Thompson et al, Physica B , 317 (1989).
- (25) H. Wada et al, J. Phys. Soc. Japan , 2956 (1990).
- (26) C. J. Fuller et al, J. Appl. Phys , 5338 (1993).
- (27) N. Tateiwa et al, J. Phys.: Condensed Matter , L17 (2001).
- (28) R. Vollmer et al, Physica B , 112 (2002).
- (29) G. Oomi et al, J. Alloys and Compounds , 482 (1998).
- (30) C. Pfleiderer et al, Nature , 427 (2001).
- (31) M. J. Steiner et al, Physica B , 1079 (2003).
- (32) S. J. Pickart et al., Phys. Rev. Lett. , 444 (1964).
- (33) B. T. Matthias and R. M. Bozorth, Phys. Rev. , 604 (1958).
- (34) S. Ogawa and N. Sakamoto, J. Phys. Soc. Japan , 1214 (1967).
- (35) N. Kimura et al. Phys. Rev. Lett. , 197002 (2004).
- (36) M. Seeger et al., J. Magn. Magn. Mater. , 312 (1995).
- (37) Shinji Ogawa, J. Phys. Soc. Japan , 109 (1968).
- (38) G. S. Knapp, J. Appl. Phys. , 1073 (1970).
- (39) G. G. Lonzarich, in edited by M. Springford (Cambridge University Press, Cambridge, England, 1997).
- (40) M. Seeger and H. Kronmuller, J. Magn. and Magn. Mater. , 393 (1989).
- (41) S. N. Kaul, J. Magn. and Magn. Mater. , 5 (1985).
- (42) M. Seeger et al., Phys. Rev. B. , 12585 (1995).