Coherent spin dynamics of an interwell excitons gas in GaAs/AlGaAs coupled quantum wells
Abstract
The spin dynamics of an interwell excitons gas has been investigated in n-i-n GaAs/AlGaAs coupled quantum wells (CQWs). In these heterostructures the electron and the hole are spatially separated in neighboring quantum wells by a narrow AlAs barrier, when an electric field is applied. The time evolution kinetics of the interwell exciton photoluminescence has been measured under resonant excitation of the 1sHH intrawell exciton, using a pulsed tunable laser. The formation of a collective exciton phase in time and the temperature dependence of its spin relaxation rate have been studied. The spin relaxation rate of the interwell excitons is strongly reduced in the collective phase. This observation provides evidence for the coherence of the indirect excitons collective phase at temperatures below a critical .
pacs:
75.75.+a, 05.40.-a, 75.50.Pp, 78.67.HcI Introduction
Among the quasi-two-dimensional systems based on semiconductor heterostructures, coupled quantum wells are of special interest because they may provide a spatial separation of photoexcited electrons and holes in neighboring quantum wells [1]. For example, in n-i-n type GaAs/AlGaAs CQWs with tilted bands due to bias application, excitons can be excited with electron and hole confined in adjacent wells which are separated by a tunneling barrier. These excitons are called spatially indirect or interwell excitons (IEs) and differ from the direct intrawell excitons (DEs), for which electron and hole are located in the same QW. In contrast to intrawell excitons, IEs are long-lived because the wave functions of electron and hole overlap very weakly through the tunneling barrier. This might open the possibility for such an electron-hole system to maintain electron spin orientation as long as the IEs life-time (several nanoseconds and longer). A large number of IEs can be easily accumulated and this exciton gas can be cooled down to rather low temperatures. Various possible scenarios of collective behavior of a dense system of spatially separated electrons and holes have been considered theoretically [1-3]. Further, there are already a lot of works [see reviews 4-6] reporting on collective behavior of IEs upon reaching critical conditions.
Earlier, we have found that below a critical temperature the gas of IEs in CQWs undergoes a phase transition-like behavior with increasing exciton density [7]. Experimental findings such as strong narrowing of the IEs photoluminescence line, drastic increasing of its circular polarisation degree and high sensitivity with respect to temperature have been associated with the condensation of IEs to a collective dielectric phase. Later it has been shown that if critical conditions are satisfied the IEs collective phase is most likely to occur in domain regions with lateral confinement [8]. According to our experiments the condensation occurs at K for an average exciton concentration of cm-2.
A collective excitonic phase, corresponding to a macroscopic exciton occupation of the lower state in domain, should show spatial and temporal coherence. This means that within the coherence length condensed excitons are described by a common wave function. Consequences expected from this are an increase of the radiative decay rate of the excitons and a reduction of the exciton spin relaxation rate. Due to these features the opportunity for resonant photoexcitation of a spin aligned collective interwell excitonic phase might arise. In the considered case the coherence length scale is expected to be equal to the size of the domain, arising from long range potential fluctuations (around one micron in lateral size), in which IEs can be accumulated.
In this manuscript we will address the IEs spin relaxation rate by measuring and analyzing the circular polarization degree under resonant pulsed laser photoexcitation. The paper is organized as follows. After describing the CQWs heterostructures being studied as well as the experimental technique in Section 2A, we describe in Section 2B the time evolution of the spectra and the decay curves of the luminescence intensity of IEs under conditions of resonant pulsed laser excitation. A broad set of experimental parameters (pump power, electrical bias, and temperature) was varied. In Section 3 we discuss theoretical calculations of the IEs spin relaxation rate. Finally in the concluding section 4 various properties of IEs observed in their luminescence spectra and their critical behavior as function of optical pumping and temperature are interpreted in terms of a collective exciton behavior.
II Experiment
II.1 Samples and experimental setup
We have investigated a n-i-n GaAs/AlGaAs heterostructure containing a GaAs/AlAs/GaAs CQW with a width of the GaAs wells of about , and a width of the AlAs barrier of about . The structure was grown using molecular-beam epitaxy on a -type doped GaAs substrate (concentration of the Si-impurity doping cm-3) with (001) crystallographic orientation. First, a 0.5m thick buffer layer of Si-doped (cm-3) GaAs was grown on top of the substrate. Next, an insulating AlGaAs layer () with a thickness of 0.15 was deposited. Then the GaAs/AlAs/GaAs CQWs sequence was grown. To improve the interface quality, the growth interruption technique has been used for the AlAs heteroboundaries. After the CQW, an insulating AlGaAs layer with a thickness of 0.15 was grown, followed by a 0.1 thick layer of Si-doped (cm-3) GaAs. The whole structure was covered by a wide GaAs layer. Mesas with a lateral size mm2 were prepared on this structure by lithography. Further, Au + Ge + Pt alloy metallic contacts to the buffer layer and to the doped layer in the upper part of a mesa were evaporated.
The IE photoluminescence (PL) was excited by 120-femtosecond laser pulses with a repetition rate of 76 MHz. A holographic grating with optical slits has been used for pulse shaping. The detection of the signal was provided by a Hamamatsu streak-camera (Model 5680-24) with a Si charged-coupled-device (CCD) detector attached to a 0.5-m spectrometer (Acton SP-500i). The systems time resolution was about 70 ps in this configuration. For circular polarization analysis of the PL signal under resonant photoexcitation we have used linear polarizers and quarter wave retarder plates.
II.2 Experimental results.
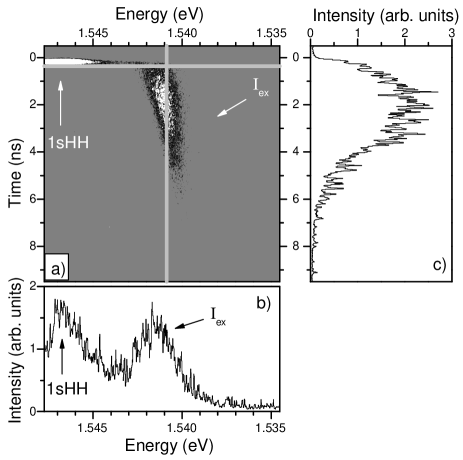
Fig. 1(a) gives a contour plot of a streak camera image of the PL emission from the studied CQWs. The horizontal (vertical) axis gives energy (time), while the brightness gives the PL intensity. For data analysis this image has been profiled either along the energy axis (fig.1b) or along the time-axis (fig.1c), resulting in time-resolved PL spectra and energy-resolved PL decay curves, respectively. For spin orientation of the IEs we used circular polarized (for example, ) laser excitation resonant to the ground state of the intrawell 1sHH excitons. The interwell exciton PL kinetics was measured under these conditions for different temperatures and bias voltages.
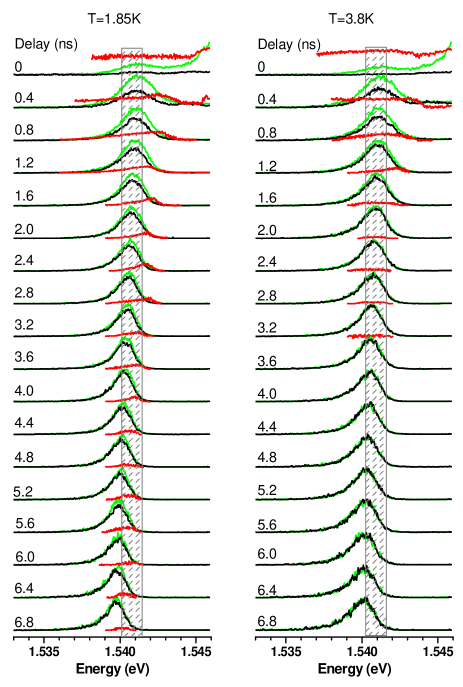
Figure 2 shows the time evolution of the polarization resolved PL spectra ( - green curves and - black curves) as well as the circular polarization degrees across the PL emission spectra (red curves). The spectra have been measured for various time delays relative to the exciting laser pulse at =1.8 and 3.8K for an applied voltage =0.6V. At zero delay, the IE PL is strongly circularly polarized, following the polarization of the exciting laser, and has a full width at half maximum (FWHM) of about 3meV. As the delay increases the PL line narrows and shifts somewhat toward the long-wavelength part of the spectrum. At =1.8K this shift is equal to 1.5meV whereas at temperatures above =3.6K it is about 1.1meV only. The PL line width evolution is highly sensitive to temperature: At 3.8K such a strong narrowing of the line with increasing delay does not occur as it is observed T = 1.8K.
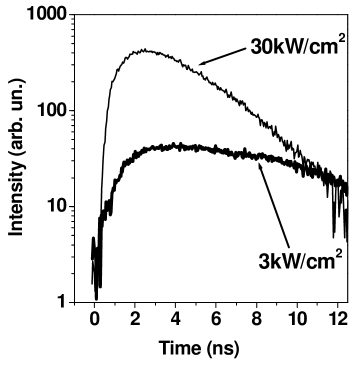
The two decay curves shown on figure 3 correspond to different excitation powers, measured at the PL line maximum of the IEs at =2K and =0.6V. One can see that decay time for larger power is much shorter (about 3 versus 7ns) than for smaller one. This description is approximative and has been used for the monoexponential data fitting.
The time evolution of the circular polarization degree reflects the IE spin relaxation. The circular polarization is defined as , where are the PL signal intensities for the and components. From Fig. 2 it becomes evident that varies with the PL emission energy and also depends strongly on temperature. Within the first nanosecond after the laser pulse, the IE PL line is strongly circularly polarized (more than 60 % at zero delay, for example) and does not show strong variations across the whole PL spectrum. At later times only the high-energy part of the spectrum remains polarized. At low temperature T=1.8K the circular polarization of the PL disappears after 7ns while at T=3.8K the PL is unpolarized already after 3ns.
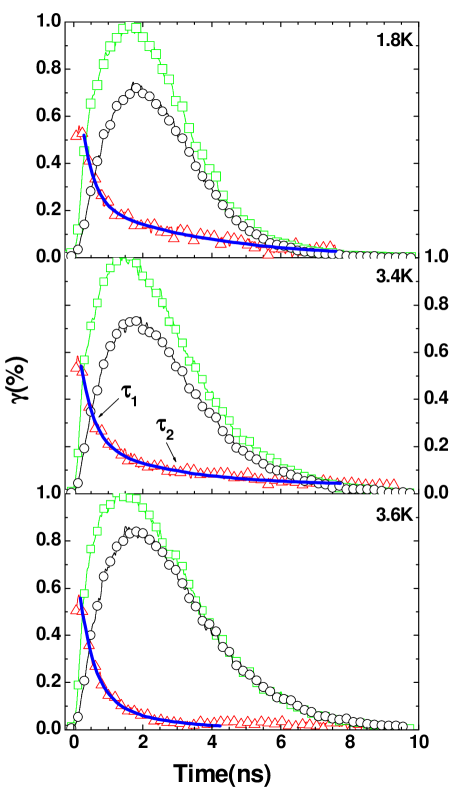
For a quantitative analysis of the spin relaxation, the PL image is profiled along the energy scale, from which PL decay curves for a fixed energy interval are received. The spin relaxation time is the decay time of the circular polarization degree. Figure 4 gives the IEs PL decay curves for and circular polarization (circular and square symbols, respectively) as well as the decay of the corresponding circular polarization degree (triangular symbols), measured at different temperatures near the PL line maximum (crosshatched region in fig.2). The blue lines are least-mean-square fits to the data using a bi-exponential decay form.
The maximum intensity of the IE PL line is reached for delays of about 2ns. We suggest that this time is necessary for the formation of IEs upon resonant tunneling of electrons and holes to adjacent quantum wells and relaxation in energy towards the density and temperature equilibrium values.
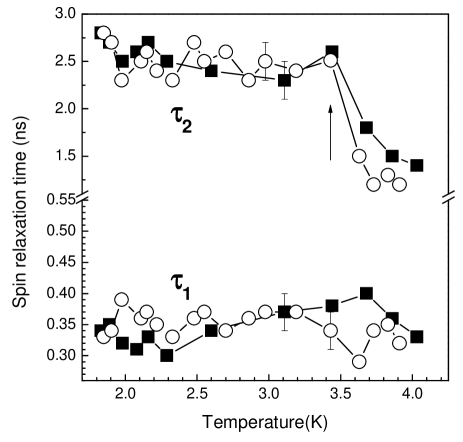
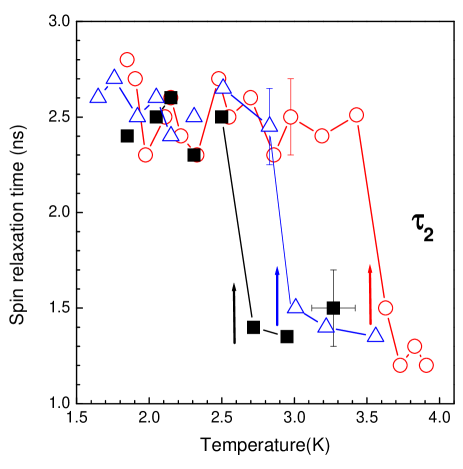
We have found that the spin relaxation dynamics can be described by two different time constants, an initial fast one and a delayed slow one (see fig.5). The initial decay time is very weakly temperature dependent and amounts to about 0.35ns. In contrast, the slow decay time which exceeds by an order of magnitude at low drops by a factor of about 2 for temperatures above 3.6K. Up to 15K no more considerable changes in the temporal dynamics of the IEs circular polarization degree is observed. The same behavior occurs for another, slightly smaller bias = -0.55 V applied to the CQW. These data have been received at an excitation power about 30kW/cm2 leading to an IEs concentration cm-2. We have found that the strong reduction of spin relaxation time is quite sensitive to excitation power (see fig.6). At smaller and at bigger excitation power the temperature boundary for the strong reduction of the spin relaxation time shifts to lower temperatures.
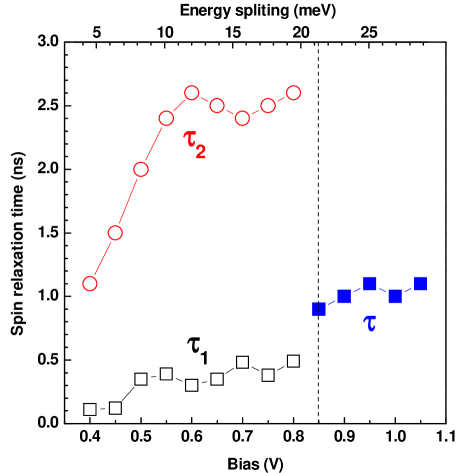
Fig.7 shows the bias dependence of the spin relaxation time at T=2K. With increasing voltage, and first monotonously increase and then don’t change up to 0.85V, corresponding to about 22meV splitting between the 1sHH and the interwell exciton. For higher bias, the spin relaxation process is described by a single relaxation time. From Fig.6 it can be seen that with increasing bias the time for accumulation of interwell excitons increases. This can be attributed only due to a rise of the tunneling time. Therefore we suggest that for large bias single-particle spin-relaxation mechanisms may play a determinative role.
We have also measured the temperature dependence of the circular polarization degree of the intrawell 1sHH exciton luminescence. Its spin relaxation rate does not change in the temperature interval from 2 to 15K and decays monoexponentially with a time constant of about 180ps. This result is in good agreement with ref. [7], where the exciton spin relaxation dynamics has been investigated in great detail at low temperatures. The mechanism responsible for 1sHH spin relaxation is the electron-hole exchange interaction. For CQW structures the carries spin dynamics is more complicated. After the laser pulse several processes may occur: electron tunneling to the adjacent quantum well, energy and spin relaxation, interwell exciton formation and radiative annihilation. We suggest that the time is due to electron-hole exchange interaction within the 1sHH exciton, while the time characterizes the IEs spin relaxation. Since the wave function overlap integral is very small, the electron-hole exchange interaction is very weak and the time is much longer than the time.
III Theoretical description of interwell exciton spin relaxation.
The exciton kinetics including spin relaxation is governed by the following processes:
1) electrons spin-flip within the exciton with rate ,
2) holes spin-flip within the exciton with rate ,
3) exciton spin-flip due to electron-hole exchange with rate for intrawell excitons and with probability for IEs,
4) exciton radiative recombination with rate for intrawell excitons and with probability for IEs,
5) intrawell exciton transformation into IEs due to electron tunneling to the adjacent quantum well with rate .
For modelling, we have used the equations obtained in refs. [10, 11]. The concentrations of intrawell excitons and interwell excitons are described by the rate equations:
| (1) | |||
| (2) |
where
These equations have to be solved for the boundary conditions:
The coefficients are given by
| (3) |
The intra- and interwell exciton spin flip probabilities are
| (4) |
The electron (hole) spin-flip rate inside the exciton is given by
| (5) |
where is the energy splitting between the optically active and the optically inactive ones.
We assume that the hole spin flipping time is much smaller than all other times in our system. In this case the ”bright” () and ”dark” () exciton concentrations are connected to each other, depending on temperature and exchange splitting .
| (6) |
This assumption allows one to take into consideration only the optical active (”bright”) ) excitons.
| (7) |
with
| (8) |
with and the coefficients given by
| (9) |
The influence of the ”dark” excitons is described by the effective annihilation rates , and the spin relaxation rates , (effective times , and , ) for intrawell and IEs, respectively:
| (10) |
To compare these results with the experimental data it is necessary to determine the time dependence of the exciton concentration of the optically active states and of their spin polarization degree:
| (11) | |||||
| (12) |
where is the total exciton concentration. The IE PL intensities measured in experiment are directly proportional to the exciton concentrations. For intrawell excitons we obtain:
| (13) |
while for IEs we have:
| (14) |
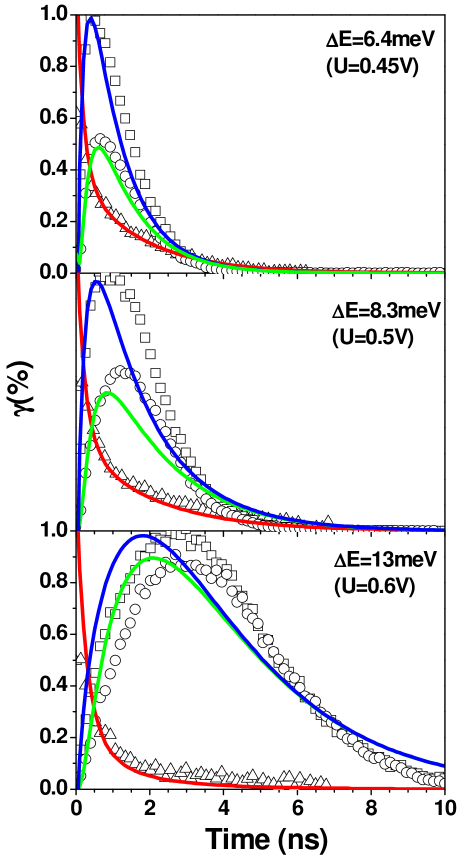
The comparison of experimental data with theoretical calculations is presented in Fig.8 for different electrical biases corresponding to the following energy splittings between the 1sHH exciton and the interwell exciton: (1) meV, ns, ns, ns, ns; (2) meV, ns, ns, ns, ns, and (3) meV, ns, ns, ns, ns. Our model rather well describes spin relaxation at small bias, while at bigger voltages probably it would have to take into account non-local tunneling, to obtain better agreement.
The increase of the exciton spin relaxation time and the radiative exciton annihilation time with bias can be explained by the enhanced spatial separation of electrons and holes both in the same quantum well as well as in adjacent ones.
IV Discussion
We believe that the experimental results described above strongly support the suggestion that we have made previously (see [7]) about the collective nature of the behavior of the interwell excitons below a critical temperature. Qualitatively, the origin of the collective exciton phase can be described as follows. At low temperatures (T 2K), the IEs fill a particular potential relief in the quantum-well plane, as the density of the optical excitation power is increased. These potential traps arise, for example, from residual impurities, defects, or other structural imperfections. This is manifested by a narrowing of the PL line with increasing pumping, such that the line width ceases to reflect the statistical distribution of the fluctuation amplitudes of the random potential. In our opinion, the sharp narrowing of the PL line, the superlinear rise of its intensity and the threshold-like increase of its circular polarization cannot be associated with reaching the percolation threshold by IE density only, because of the strong sensitivity to temperature, even though there is no distinct temperature boundary. Berman and Lozovik showed [2] that a sufficiently dense system of IEs with particular values of the dipole moment may condense into a dielectric phase despite of the dipole repulsion among such excitons.
An essential amendment was made in ref. [1], whose authors indicated that such a condensation in real systems can occur most probably in regions with confinement in the quantum-well plane. In the structures studied here which were fabricated using the growth interruption epitaxial technique for the heteroboundaries (in our case, the growth interruption time was 2 minutes), large-scale in-plane fluctuations of the well width arise in the heterostructure plane. The size of these fluctuations along the growth direction is of the order of one monolayer. The characteristic lateral length scale of such fluctuations in the QW plane reaches a micrometer. Because of these fluctuations, lateral domains are formed in the quantum wells. As judged from the characteristic doublet structure in the photoluminescence excitation spectra of the intrawell excitons of our samples, the depth of such domains can be estimated by 1.5 - 2 meV. IEs can accumulate in these domains, because the lateral domain boundaries prevent excitons from spreading out randomly in the quantum-well plane.
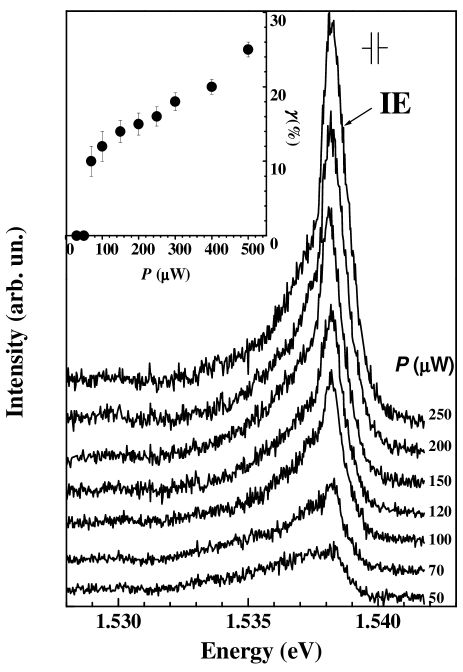
We have suggested that the IEs demonstrate a collective behavior in these domains when their density and temperature surpass critical values. For testing this assumption, the surfaces of the samples were coated by a metallic mask containing lithographically prepared holes with sizes of a micrometer or less, through which photoexcitation and photocollection were done [8] (see fig. 9). We found that for weak pumping (less than ), the IEs are strongly localized in small-scale fluctuations of a random potential, and the corresponding photoluminescence line is inhomogeneously broadened (up to 2.5meV). When the resonant excitation power is increased, a spectral line which is attributed to delocalized excitons arises with a threshold-like intensity behavior. Above the threshold the intensity increases linearly with pump power, narrows (minimum line width eV), and undergoes an energy shift (up to meV) to lower energies, in accordance with filling of the lowest state in the domain. Finally we observed that with increasing temperature, this line disappears continuously from the spectrum. Therefore its vanishing cannot be described by a thermally activated behavior, which would show an exponential dependence. The critical temperature is about 3.4K.
IEs are composite bosons. If this bosonic behavior is maintained also at high densities, the excitons therefore must condense upon reaching the values for critical concentration and temperature (analogue of Bose-Einstein condensation). For confinement in the quantum-well plane, the critical temperature at which this condensation takes place can be estimated using the equation , where is the exciton density, is the exciton mass, and is the domain area. If we assume that the exciton mass is and the domain size is , we obtain a critical temperature for the densities used in our experiment. This is very close to the value observed experimentally.
It should also be noted that in our experiments measurements are carried out simultaneously on several tens of such lateral domains because the smallest diameter of the laser excitation spot from which luminescence spectra are detected is about . Due to the dispersion of the lateral domain sizes and the averaging of spectra from different domains, a sharp threshold of the critical behavior in temperature cannot be observed. For the same reasons, the smallest observed luminescence line width (about 1meV) is still inhomogeneously broadened, because interwell exciton luminescence from differently sized domains contribute to the emission. At the same time, the sharp narrowing of the luminescence line observed experimentally at () and the long-wavelength shift of this line (about 1.5meV), in accordance with filling of the lowest energy state in the domain, are clear manifestations of Bose properties of excitons.
The condensed IE phase must exhibit coherent properties. This means that the IEs must possess the same phase on the length scale of the de Broglie wavelength, which is close to the lateral domain sizes. This phase coherence in turn affects the radiative annihilation rate, which increases due to the increased coherence volume. Earlier we have found from the kinetics of luminescence spectra that the lifetime of the collective exciton state is about three times shorter than the luminescence decay time of localized IE’s [9]. This increase in the radiative decay rate of IEs and the corresponding increase of the degree of circular polarization are particular manifestations of the coherence of the collective exciton state.
We believe that the presented experimental results are additional evidence for the coherence of the IEs collective phase at low temperatures. Our claim is based on ref. [12], where the spin relaxation rate of Bose-condensates of atoms in traps was studied. It has been shown that the spin relaxation rate of the atoms condensed phase is N! times smaller than that for atoms in the uncondensed phase, where is the number of particles involved in scattering process destroying Bose-condensation. Experimentally, this claim was confirmed in ref. [13], in which the spin dynamics of atoms in a Bose-condensate has been investigated. In our case the time characterizing the exciton spin relaxation changes by a factor of about 2, as expected from the electron-hole composition of the exciton, in good agreement with the model calculations in ref. [12].
V Conclusions
In conclusion, for the first time the temperature dependence of the IEs spin relaxation time has been investigated in GaAs/AlGaAs CQWs. A strong decrease of the IEs spin relaxation time has been discovered at . The observed phenomenon occurs due to the interwell exciton collective phase coherence at temperatures below the critical one.
VI Acknowledgements
The authors want to express their thanks to V.B. Timofeev for valuable suggestions and remarks, as well as to Yu. Kagan for fruitful and interesting discussions. This research was supported by DFG (Grant No. 436 RUS 17/95/03), by RFBR, and by the Russian Science Support Foundation.
References
- (1) Xuejun Zhu, P.L. Littlewood, M.S. Hybersten, and T. Rice, Phys. Rev. Lett. 74, 1633 (1995).
- (2) Yu.E. Lozovik and ‘O.L. Berman, JETP 84, 1027 (1997)
- (3) A.V. Larionov and V.B. Timofeev, JETP 90, 1093-1104 (2000).
- (4) L.V. Butov, J. Phys.: Condens. Matter 16, R1577 (2004).
- (5) S.A. Moskalenko and D.W. Snoke, Bose-Einstein Condensation of Excitons and Biexcitons (Cambridge University Press, 2000).
- (6) A.V. Larionov and V.B. Timofeev, JETP Letters, 73, 301-308 (2001).
- (7) A.V. Larionov, V.B. Timofeev, J. Hvam, and C. Soerensen, JETP Lett. 71, 117-122 (2000).
- (8) A.V. Larionov, V.B. Timofeev, et al., JETP Lett. 75, 570-574 (2002).
- (9) A.V. Larionov, V.B. Timofeev, J. Hvam, and C. Soerensen, JETP Lett. 75, 200-204 (2002).
- (10) M.Z. Maialle, E.A. de Andrada e Silva, and L.J. Sham, Phys.Rev. B 47, 15776 (1993).
- (11) A. Vinattieri, Jagdeep Shah, T.C. Damen, and D.S. Kim, L.N. Pfeiffer, M.Z. Maialle, and L.J. Sham, Phys.Rev. B 50, 10868 (1994).
- (12) Yu. Kagan, V.A. Kashurnikov, et al., Phys. Rev. A 61, 043608 (2000).
- (13) E.A. Burt, R.W. Ghrist, et al., Phys. Rev. Lett. 79, 337-340 (1997).