Two-band model of Raman scattering on electron-doped high- superconductor
Abstract
We have analyzed the and Raman spectra of electron-doped cuprate superconductors Nd2-xCexCuO4 and Pr2-xCexCuO4 using a weakly coupled two-band model. One of these two bands is centered around and couples more strongly with the mode, while the other is centered around and and couples more strongly with the mode. This model explains in a natural way why the Raman peak occurs at a higher frequency than the one at optimal doping, and how these two peaks change with doping in agreement with experiments. The result thus supports that there are two kinds of quasiparticles in electron-doped cuprates and -wave superconductivity is driven by the holelike band and a proximity effect on the electronlike band.
pacs:
74.25.Gz, 74.20.Mn, 74.20.Rp 78.30.-jI Introduction
Pairing symmetry of electron-doped high- cuprate superconductors such as Nd2-xCexCuO4 and Pr2-xCexCuO4 is a long standing problem Tsuei and Kirtley (2000); Armitage et al. (2001); Sato et al. (2001); Alff et al. (1999); Prozorov et al. (2000); Skinta et al. (2002); Kim et al. (2003); Biswas et al. (2002); Chesca et al. (2003, 2005); Shan et al. (2005); Balci and Greene (2004); Stadlober et al. (1995); Blumberg et al. (2002); qaz ; Matsui et al. (2005a); Ariando et al. (2005). Although no consensus has been reached yet, more and more recent experimental results have suggested that the order parameter of electron-doped cuprates is likely to have -wave pairing symmetry Tsuei and Kirtley (2000); Armitage et al. (2001); Sato et al. (2001); Prozorov et al. (2000); Blumberg et al. (2002); Chesca et al. (2003, 2005); Matsui et al. (2005a); Ariando et al. (2005), in close resemblance to that of hole-doped materials. Among various experiments, the Raman scattering seems to suggest a different story Stadlober et al. (1995); Blumberg et al. (2002); qaz . For hole-doped superconductors, it was known that typical , , and pair-breaking peaks appear, respectively, at the frequencies of , , and times of the gap amplitude Devereaux and Einzel (1995). However, in electron-doped materials the relative position of the and peaks changes with doping. The peak appears first at a higher frequency than the one in the underdoped regime. It then moves down and finally appears at a frequency lower than that of the peak in the heavily overdoped regime.
The Raman scattering has the potential to probe different regions of the Fermi surface (FS), thus a thorough understanding of the experimental data can provide a better understanding on the momentum dependence of superconducting (SC) pairing gap. The observation of Raman peak at higher frequency than that of would imply a non-monotonic -wave order parameter in a single-band system Blumberg et al. (2002). This nonmonotonic order parameter seems to be also consistent with the observation of angle resolved photoemission spectroscopy (ARPES) Matsui et al. (2005a). However, this one-band picture may not be adequate to describe the nature of two kinds of charge carriers in electron-doped cuprate superconductors, as revealed by magneto-transport measurements Wang et al. (1991); Jiang et al. (1994); Fournier et al. (1997).
A key clue towards the understanding of Raman data in Nd2-xCexCuO4 comes from the doping evolution of the FS revealed by ARPES Armitage et al. (2002); Matsui et al. (2005b). At low doping, four small FS pockets first appear around and . By increasing the doping, four new pockets begin to form around . These results can be explained in terms of the k-dependent band-folding effect due to antiferromangetic (AF) ordering. The original band is folded back into the magnetic Brillouin zone (MBZ) around the diagonal line (). Near the intersecting points of the Fermi surface, an AF gap opens and splits the original FS into two Kusko et al. (2002); Yuan et al. (2004); Voo and Wu (2005). This two-band picture was first used by Luo and Xiang to explain the unusual temperature dependence of the magnetic penetration depth in electron-doped copper oxides Luo and Xiang (2005). It is supported by Hall coefficient and magneto-resistance measurements Wang et al. (1991); Jiang et al. (1994); Fournier et al. (1997). The generic feature of a weakly coupled two-band model was discussed in Ref. Xiang and Wheatley (1996) in the context of hole-doped cuprate superconductors.
In this paper, we shall use a two-band model to study the Raman response for the electron-doped cuprates. As will be shown, the two-band model gives a unified explanation to the unusual behaviors of Raman spectra. It explains in a natural way why the Raman peak appears at a higher frequency than that of the peak at optimal doping and why the relative positions of these two peaks change in the heavily overdoped regime.
II Model and Formalism
We start by considering the two-dimensional --- model
| (1) | |||||
where , , and denote the nearest, second-nearest, and third-nearest neighbors between and . No double occupied sites are allowed in Eq. (1). All notations used in (1) are standard. Applying the slave-boson and MF decoupling Yuan et al. (2004), Hamiltonian (1) can be written in terms of two (diagonalized) bands in momentum space
where the prime denotes that the momentum summation is over the MBZ only () and
with the AF wave vector and the AF order. Here
| (2) | |||||
with the uniform bond order and the doping concentration ( is the fermionic spinon operator).
In the SC state, we add a BCS coupling term to each band and assume the system to be described by the following Hamiltonian Luo and Xiang (2005)
where and are the -wave gap functions.
The Raman scattering intensity is proportional to the imaginary part of the effective density-density correlation function in the limit . Here is the effective density operator and is the Raman vertex. When the energy of incident light is smaller than the optical band gap, the contribution from the resonance channel is negligible. The Raman vertex can then be obtained in terms of the curvature of the band dispersion under the inverse effective mass approximation.
In the current two-band model, the effective density operator is decomposed as
| (3) | |||||
Along with the unitary transformation Yuan et al. (2004) such that operators and are transformed into and , the Raman response function for each symmetric channel () is then given by csl
| (4) | |||||
where and are the normal and anomalous Green functions for a superconductor, if or if . The intra- and interband vertex functions are
| (5) | |||||
where . For the and channels, and . Here (inverse effective mass approximation). Eq. (4) and (5) reduce to the famous ones in a one-band system when Devereaux and Einzel (1995).
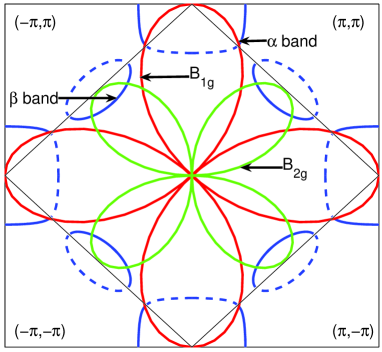
Shown in Fig. 1 are the and Raman vertices and how they are coupled to the SC quasiparticle excitations in k space. Since the vertex has symmetry, the channel is dominated by the excitations of the band. In contrast, the vertex has symmetry, thus the channel is contributed mainly from the excitations of the band. Since both and vertices are odd-parity, their Raman intensities are not affected by the Coulomb screening. For the fully symmetric channel, in contrast, all regions of momentum space contribute and the Raman intensity is partially screened. Since the channel is more sensitive to the actual vertex as well as the screening effect, we will leave out and focus on the and channels only.
In electron doped cuprates, the SC state appears only when the band emerges above the Fermi energy. This would suggest that we assume that it is the band that drives the system to superconduct, while the band becomes superconducting mainly via the proximity effect. A simple picture for the understanding of the unusual Raman spectra in electron doped cuprates can then be sketched as follows. In the under doped or optimally doped regime, the band couples more strongly with the AF fluctuations than the band. This results in a relatively larger SC gap in the band () than in the band (). The channel probes mainly the quasi-particle (QP) excitations of the band, thus the Raman peak is mainly determined by . Similarly, the channel probes mainly the QP excitations of the band, its Raman peak is mainly determined by . If is much smaller than , one would then expect that the peak appears at a frequency lower than that of the peak, unlike in the hole doped case. In the heavily overdoped regime, the AF correlation becomes very weak and the band splitting vanishes. In this case the two-band model reduces essentially to a one-band model and the and Raman spectra would behave similarly as in the hole doped cuprate superconductors, consistent with the experiments.
III Results and Discussions
III.1 On Nd2-xCexCuO4
Pertaining to Nd2-xCexCuO4, we have adopted , , , and to simulate the band structure Yuan et al. (2004). We take and for the optimally doped () sample, and for the overdoped () sample. These parameters are close to those obtained in self-consistent calculations for the normal states Yuan et al. (2004). The chemical potentials are determined by the filling factor for each band to give the true doping concentration through .
Theoretical fitting procedures are implemented as follows. First, the vertex functions are evaluated using (5). Then the SC gaps and and the smearing Lorentz width and are adjusted to fit the peak positions and the overall spectral line shape (up to a constant multiplying factor).
Figure 2 compares the experimental data of Raman spectra for Nd2-xCexCuO4 with the theoretical calculations. For all the cases considered in Fig. 2, our fitting curves are in good agreement with the experimental results. For the optimally doped sample (x=0.15) reported in Ref. Blumberg et al. (2002) at (first column), the and Raman peaks appear at and , respectively. The corresponding gap and smearing parameters obtained by fitting are and ). The ratio between the Raman peak frequency and is about , while the ratio between the Raman peak frequency and is about . The corresponding ratios in a hole doped d-wave superconductor are about 2 and 1.6, respectively. This difference between hole and electron doped cuprates is not difficult to be understood. In electron doped materials, the AF correlation splits the continuous FS into two separate sheets. This then suppresses the high (low) energy region to which the () probes. It is thus expected that the () peak will be red shifted (blue shifted) compared with the result of hole-doped cuprate superconductors.
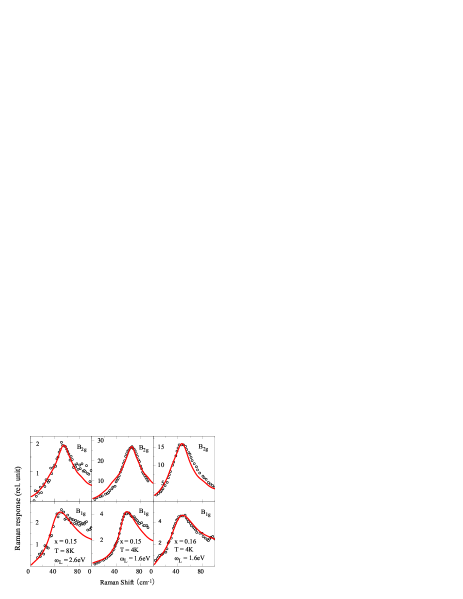
For another set of data of the optimally doped sample reported in Ref. qaz at (second column), the fitting parameters are and . The corresponding parameters for the overdoped sample at (third column) are and . The gap parameters obtained are consistent with the general expectation. Both and decrease with increasing temperature at the same doping level and with increasing doping at the same temperature. The gap ratio, , is reduced from 2 at optimal doping to 1.7 at slightly overdoping, consistent with the scenario of AF-like fluctuation induced superconductivity. All fitting parameters for Nd2-xCexCuO4 are summarized in Table 1.
| Column 1 | Column 2 | Column 3 | |
| (K) | 22 | 22 | 13 |
| 0.178 | 0.178 | 0.15 | |
| 6 | 4 | 8 | |
| 8 | 6 | 8 | |
| 21 | 27 | 21 | |
| 48 | 57 | 37 | |
| 2.29 | 2.11 | 1.76 | |
| 2.18 | 2.59 | 2.84 |
| Column 1 | Column 2 | Column 3 | |
| 0.15 | 0.165 | 0.18 | |
| (K) | 23.5 | 15 | 10 |
| 0.15 | 0.12 | 0 | |
| 6 | 8 | 15 | |
| 6 | 8 | 15 | |
| 31 | 16 | 15 | |
| 68 | 30 | 15 | |
| 2.19 | 1.88 | 1 | |
| 2.89 | 2 | 1.5 |
III.2 On Pr2-xCexCuO4
The Raman scattering measurement has also been carried out in electron-doped Pr2-xCexCuO4 at various doping levels qaz . The Raman spectra of Pr2-xCexCuO4, as shown in Fig. 3, behave similarly as for Nd2-xCexCuO4. At optimal doping, the peak appears at a frequency higher than that of the peak. With increasing doping, the frequency of the peak approaches to and finally surpasses the peak in the overdoped regime.
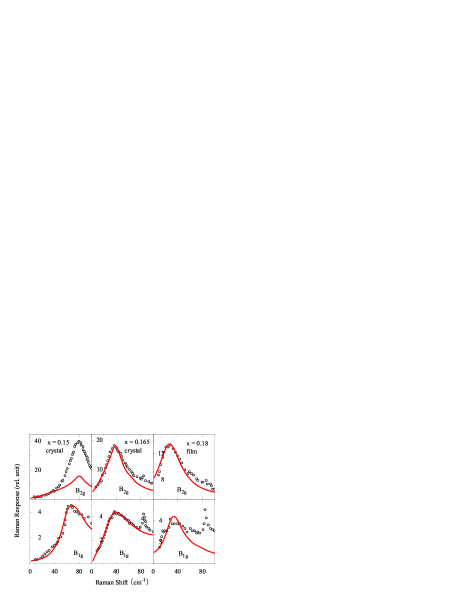
Figure. 3 compares the measurement data of Pr2-x CexCuO4 with our theoretical calculations. For the optimally doped sample (), the Raman peak appears at 80 for the mode and at 62 for the mode. The parameters obtained by fitting are and , with and . For the slightly overdoped sample (), the and peaks appear at the same frequency at 37 and the parameters we obtained are and , with and . For the heavily over-doped sample (), the Raman peaks appear at 25 and 30 for the and modes, respectively. The relative peak positions of these two modes are similar as in a one-band -wave superconductor. This is not unexpected since at such a high doping level, the two-band model reduces essentially to a one-band model. In this case, the parameters we obtained are and , with and . For the above three samples, the ratio changes from , to , and finally to with increasing doping. With increasing doping, the AF order is depressed and the gap amplitudes is decreased. The results are consistent with neutron scattering measurement K. Yamada and K. Kurahashi and T. Uefuji and M. Fujita and S. Park and S.-H. Lee and Y. Endoh (2003). All fitting parameters for Pr2-xCexCuO4 are summarized in TABLE 2.
In the top-left panel of Fig. 3 for the mode, the experimental data are taken under the strong resonant regime as emphasized in Refs. Blumberg et al. (2002); qaz . In this case, the contribution from the resonance channel becomes important and the inverse effective mass approximation is not valid. Our theoretical result including only the non-resonant contribution can give a good explanation to the low-frequency part of the spectrum, but the height of the peak is much lower than the experimental one. The resonance channel may also have some contribution to the spectrum in the second column of Fig. 2 for Nd2-x CexCuO4.
IV Summary
In summary, we have analyzed the Raman spectra of electron-doped cuprate superconductors based on a weakly coupled two-band model. Our result gives a unified explanation to the experimental data in the whole doping range. It suggests strongly that the SC pairing in electron-doped cuprate superconductors results from the same pairing mechanism as in hole doped ones and the gap parameter has -wave symmetry. To understand the Raman data in the strong resonance regime, a more comprehensive theory including the contribution from the resonance channel is desired.
Acknowledgements.
The authors are grateful to Hsiang-Lin Liu for useful comments on Raman experiments. This work was supported by the National Natural Science Foundation of China (Grant No. 10347149), National Basic Research Program of China (Grant No. 2005CB32170X), and National Science Council of Taiwan (Grant No. 93-2112-M-003-015).References
- Tsuei and Kirtley (2000) C. C. Tsuei and J. R. Kirtley, Phys. Rev. Lett. 85, 182 (2000).
- Armitage et al. (2001) N. P. Armitage, D. H. Lu, D. L. Feng, C. Kim, A. Damascelli, K. M. Shen, F. Ronning, Z.-X. Shen, Y. Onose, Y. Taguchi, et al., Phys. Rev. Lett. 86, 1126 (2001).
- Sato et al. (2001) T. Sato, T. Kamiyama, T. Takahashi, K. Kurahashi, and K. Yamada, Science 291, 1517 (2001).
- Alff et al. (1999) L. Alff, S. Meyer, S. Kleefisch, U. Schoop, A. Marx, H. Sato, M. Naito, and R. Gross, Phys. Rev. Lett. 83, 2644 (1999).
- Prozorov et al. (2000) R. Prozorov, R. W. Giannetta, P. Fournier, and R. L. Greene, Phys. Rev. Lett. 85, 3700 (2000).
- Skinta et al. (2002) J. A. Skinta, M.-S. Kim, T. R. Lemberger, T. Greibe, and M. Naito, Phys. Rev. Lett. 88, 207005 (2002).
- Kim et al. (2003) M.-S. Kim, J. A. Skinta, T. R. Lemberger, A. Tsukada, and M. Naito, Phys. Rev. Lett. 91, 087001 (2003).
- Biswas et al. (2002) A. Biswas, P. Fournier, M. M. Qazilbash, V. N. Smolyaninova, H. Balci, and R. L. Greene, Phys. Rev. Lett. 88, 207004 (2002).
- Chesca et al. (2003) B. Chesca, K. Ehrhardt, M. Mössle, R. Straub, D. Koelle, R. Kleiner, and A. Tsukada, Phys. Rev. Lett. 90, 057004 (2003).
- Chesca et al. (2005) B. Chesca, M. Seifried, T. Dahm, N. Schopohl, D. Koelle, R. Kleiner, and A. Tsukada, Phys. Rev. B 71, 104504 (2005).
- Shan et al. (2005) L. Shan, Y. Huang, H. Gao, Y. Wang, S. L. Li, P. C. Dai, F. Zhou, J. W. Xiong, W. X. Ti, and H. H. Wen, Phys. Rev. B 72, 144506 (2005).
- Balci and Greene (2004) H. Balci and R. L. Greene, Phys. Rev. Lett. 93, 067001 (2004).
- Stadlober et al. (1995) B. Stadlober, G. Krug, R. Nemetschek, R. Hackl, J. L. Cobb, and J. T. Markert, Phys. Rev. Lett. 74, 4911 (1995).
- Blumberg et al. (2002) G. Blumberg, A. Koitzsch, A. Gozar, B. S. Dennis, C. A. Kendziora, P. Fournier, and R. L. Greene, Phys. Rev. Lett. 88, 107002 (2002).
- (15) M. M. Qazilbash, B.S. Dennis, C. A. Kendziora, H. Balci, R. L. Greene, and G. Blumberg, cond-mat/0501362; M. M. Qazilbash, A. Koitzsch, B. S. Dennis, A. Gozar, H. Balci, C. A. Kendziora, R. L. Greene, and G. Blumberg, cond-mat/0510098.
- Matsui et al. (2005a) H. Matsui, K. Terashima, T. Sato, T. Takahashi, M. Fujita, and K. Yamada, Phys. Rev. Lett. 95, 017003 (2005a).
- Ariando et al. (2005) Ariando, D. Darminto, H. J. H. Smilde, V. Leca, D. H. A. Blank, H. Rogalla, and H. Hilgenkamp, Phys. Rev. Lett. 94, 167001 (2005).
- Devereaux and Einzel (1995) T. P. Devereaux and D. Einzel, Phys. Rev. B 51, 16336 (1995).
- Wang et al. (1991) Z. Z. Wang, T. R. Chien, N. P. Ong, J. M. Tarascon, and E. Wang, Phys. Rev. B 43, 3020 (1991).
- Jiang et al. (1994) W. Jiang, S. N. Mao, X. X. Xi, X. Jiang, J. L. Peng, T. Venkatesan, C. J. Lobb, and R. L. Greene, Phys. Rev. Lett. 73, 1291 (1994).
- Fournier et al. (1997) P. Fournier, X. Jiang, W. Jiang, S. N. Mao, T. Venkatesan, C. J. Lobb, and R. L. Greene, Phys. Rev. B 56, 14149 (1997).
- Armitage et al. (2002) N. P. Armitage, F. Ronning, D. H. Lu, C. Kim, A. Damascelli, K. M. Shen, D. L. Feng, H. Eisaki, Z. X. Shen, P. K. Mang, et al., Phys. Rev. Lett. 88, 257001 (2002).
- Matsui et al. (2005b) H. Matsui, K. Terashima, T. Sato, T. Takahashi, S.-C. Wang, H.-B. Yang, H. Ding, T. Uefuji, and K. Yamada, Phys. Rev. Lett. 94, 047005 (2005b).
- Kusko et al. (2002) C. Kusko, R. S. Markiewicz, M. Lindroos, and A. Bansil, Phys. Rev. B 66, 140513(R) (2002).
- Yuan et al. (2004) Q. Yuan, Y. Chen, T. K. Lee, and C. S. Ting, Phys. Rev. B 69, 214523 (2004).
- Voo and Wu (2005) K. K. Voo and W. C. Wu, Physica C 417, 103 (2005).
- Luo and Xiang (2005) H. G. Luo and T. Xiang, Phys. Rev. Lett. 94, 027001 (2005).
- Xiang and Wheatley (1996) T. Xiang and J. M. Wheatley, Phys. Rev. Lett. 76, 134 (1996).
- (29) C. S. Liu, unpublished notes.
- K. Yamada and K. Kurahashi and T. Uefuji and M. Fujita and S. Park and S.-H. Lee and Y. Endoh (2003) K. Yamada and K. Kurahashi and T. Uefuji and M. Fujita and S. Park and S.-H. Lee and Y. Endoh, Phys. Rev. Lett. 90, 137004 (2003).