Induced glassy behavior in the melt of glycerol and aerosil dispersions
Abstract
A high-resolution calorimetric spectroscopy study has been performed on pure glycerol and colloidal dispersions of an aerosil in glycerol covering a wide range of temperatures from K to K, deep in the liquid phase of glycerol. The colloidal glycerol+aerosil samples with , , and mass fraction of aerosil reveal glassy, activated dynamics at temperatures well above the of the pure glycerol. The onset of glass-like behavior appears to be due to the structural frustration imposed by the silica gel on the glycerol liquid. The aerosil gel increases the net viscosity of the mixture, placing the sample effectively at a lower temperature thus inducing a glassy state. Given the onset of this behavior at relatively low aerosil density (large mean-void length compared to the size of a glycerol molecule), this induced glassy behavior is likely due to a collective mode of glycerol molecules. The study of frustrated glass-forming systems may be a unique avenue for illuminating the physics of glasses.
pacs:
61.43.Fs, 65.40.Ba, 65.60.+a, 67.40.FdI INTRODUCTION
The glass-forming liquids are interesting materials for study and have continually drawn the attention of researchers because of their unusual material properties Simon and McKenna (1997); Richert and Angell (1 June 1998); Birge et al. (1997); Weyer et al. (1997); Alig (1997). These materials show different thermal transitional and dynamical effects when they enter the glassy state. That is, the glassy state is governed by the disorder of the molecules when quenched rapidly below the glass transition temperature (). Much attention has been devoted to the study of pure glass-forming liquids such as glycerol Richert and Angell (1 June 1998); Prevosto et al. (2002); Sharma et al. (2003) since the glassy state of the pure liquid can be achieved with ease just by cooling below K for glycerol). It remains unclear whether the glass state is due to molecular interactions or a collective phenomena of many molecules that prevents crystallization and ”freezes” the sample into an amorphous state. One avenue to illuminate this phenomena has been the study of mixtures of glass-forming liquids or other solvents to isolate any specific molecular interactions. However, only a few such studies have been performed to date, and these have not settled the central question Yu and Carruzzo (2004).
An extension of the idea of using mixtures would be to employ a colloidal dispersion in a glass-forming liquid to introduce structural frustration. Such a gel system would introduce frustration in a controlled way by simply increasing the density of the colloidal particles. This would have the advantage of increasing the effective viscosity of the mixture and would have an associated mean void length. The perturbations observed for a given mean void length could then be compared to a typical molecule size of the glass-forming liquid to determine the extent of any collective mode. The colloidal gel could be obtained using aerosil particles, a technique that has already found use in the study of quenched random disorder at liquid crystal phase transitions and has been shown to involve coupling of the aerosil to the dynamics of the host fluid Iannacchione et al. (1998, 2003).
The most common technique for studying different transitions is differential scanning calorimetry (DSC) and modulation differential scanning calorimetry (MDSC) techniques, which have been widely used in the study of glasses Donth et al. (1997); Sharma et al. (2000). However, the necessary fast scan rates severely distort the behavior of slowly relaxing systems. To measure the heat capacity directly and over a wide range of frequencies under near equilibrium conditions, ac or modulation calorimetry (MC) has proven to be of great benefit for thermodynamic studies Simon and McKenna (1997); Finotello et al. (1997); Kraftmaker (2002); Gmelin (1997). Our interest is to use a MC technique on frustrated glass-forming liquid systems to probe energy relaxations via calorimetric spectroscopy.
This paper presents the results of a calorimetric spectroscopy study of colloidal dispersions of aerosil particles in glycerol as a function of aerosil density. The addition of aerosil introduces glass like dynamics with relaxations on the order of a second beginning at void length scales on the order of nm. This indicates that the induced glassy behavior is due to a collective mode of many glycerol molecules. A theoretical review of calorimetric spectroscopy and the relevant glass dynamics is presented in Sec. II, and the experimental details are described in Sec. III. The results for temperature and frequency scans as well as an Arrhenius analysis are shown in Sec. IV, with discussion and conclusions drawn in Sec. V.
II Theoretical Description
II.1 Complex Heat Capacity
Since the source of any sample’s heat capacity are the fluctuations of the sample’s energy, it is natural to consider as a dynamic quantity. However, for most materials the characteristic relaxation time of the energy fluctuations are too short to be sensed by traditional calorimetric techniques. Nevertheless, a complex heat capacity may be defined containing a real () and imaginary () component indicating the storage (capacitance) and loss (dispersion) of the energy in the sample in a direct analog to a complex permittivity. Using a linear response approach, the relaxing enthalpy fluctuations (at constant pressure) denoted as defines an enthalpy correlation function as . The complex heat capacity at a given frequency is then given by
| (1) |
where and the time integral multiplying the imaginary number is . For energy dynamics characterized by a single mode of frequency , the real part has two asymptotic limits, fast ( or , denoted by ) and static ( or , denoted by ) compared to this mode. The imaginary part would exhibit a peak at that would be the inflection point of the smooth roll over between the two frequency limits of .
II.2 Modulation Calorimetry
Modulation calorimetry allows one to make frequency dependent measurements and so access calorimetric spectroscopy. In modulation calorimetry, a small oscillating heating power is applied to the sample+cell and induces an rms temperature rise as well as small temperature oscillations. Note, in what follows the cell is considered to consist of the actual sample holder and the attached heater and thermometer. For a sample of finite thermal conductivity and a sample+cell experimental arrangement of a thickness less than the thermal diffusion length, the heat flow equations may be set up considering the sample+cell as a single thermal mass (i.e., geometry independent) Sullivan and Seidel (1968). The temperature oscillation amplitude is given to second order by
| (2) |
where is the amplitude of the applied heating power, is the angular frequency, is the total heat capacity of the sample and cell, and is the amplitude of the temperature oscillations. In addition, there are two important thermal relaxation times, the external relaxation time constant and the internal relaxation time constant , which is the sum of square internal time constants of the sample and cell ( and ). Here, is sample’s thermal resistance and is the external thermal resistance to the bath. There is also a phase shift between the applied heat and resulting temperature oscillations but it is more convenient to define a reduced phase shift since for frequencies below , . The reduced phase shift, to the same accuracy as Eq. (2), is given by
| (3) |
where . The different internal relaxation times that enter in Eq. (2) and (3) are related by and must be taken into account in order to extract the complex heat capacity.
Noting that , Eq. (3) can be substituted into Eq. (2) to give
| (4) |
where is defined for ease of notation. Factoring out a gives
| (5) |
where the total heat capacity is identified as the real part of the complex heat capacity. The function is then given by
| (6) |
and may be regarded as a correction for a sample and cell having comparable finite thermal relaxation times.
For most materials away from any phase transition, the imaginary part of the heat capacity is essentially zero at typical heating frequencies ( mHz). This quantity may be derived from Eq. (3) by substituting the definitions of the relaxation times and Eq. (5) for the heat capacity. This gives
| (7) |
where a frequency dependent correction function is introduced as
| (8) |
that also accounts for the comparable relaxation times of the sample and cell.
Typically, the cell’s geometry and mass may be controlled and so its thermal relaxation time can be made much less than that of the sample, . In this case, the two internal relaxation times are approximately equal. Taking , the correction function does not change but the term vanishes in . The frequency dependence for both correction functions enter through the reduced phase shift. At sufficiently low heating frequencies , approaches ( approaches ) and , which reduces the real and imaginary heat capacities in Eqs. (5) and (7) to
| (9) |
and
| (10) |
where any energy dynamics or dispersion in the sample will be indicated by a non-zero value of .
II.3 Brief Review of Glass Dynamics
Glass-forming or super-cooled liquids exhibit dynamics due to inhibited structural relaxations that diverge upon approaching the glass-transition until the system falls from ergodicity. Glass-formers are characterized by a rapid increase in viscosity (from poise above to poise below the glass transition temperature) with decreasing temperature, which reflects the rapidly shifting timescale of relaxation dynamics of the liquid. The slow molecular motion, known as -relaxation, has been well characterized on timescales between ps and longer Yang and Nelson (1995); Glorieux et al. (2002) and this stops completely below the glass transition temperature. The fast motion (-relaxation) is predicted to exist at timescales between and ps Franosch et al. (1998), and persists even in the glassy state. However, -relaxation is difficult to determine unambiguously by experiment and its physical meaning is debated. Qualitatively, -relaxation can be thought of as the collective motion of many particles while -relaxation is the motion of a single molecule rattling within a cage of nearest neighbors. Fundamentally, the issue of glasses centers on whether the glassy behavior is due to ”stuck states” of a collection of molecules or due to molecular frustration preventing the crystallization of the material.
Quantitatively, glassy dynamics typically obey Vogel-Fulcher-Tammann (or Arrhenius) behavior indicating that the dynamics are energetically activated Vogel (1921); Fulcher (1926). According to Arrhenius behavior, the relaxation time of glass forming liquids can be given by
| (11) |
where is the relaxation time of some structural fluctuation, is the high-temperature limit of this fluctuation, is the activation energy, and as usual. This activated relaxation mode can become very long and complicate the interpretation of thermodynamic measurements. Glycerol has been a particularly well studied example of such glass-forming liquids that exhibit all of the above characteristics Simon and McKenna (1997); Richert and Angell (1 June 1998); Yu and Carruzzo (2004).
III Experimental
The pure glycerol obtained from Aldrich was used after carefully degassing at K for hours because of its hygroscopic nature. The pure glycerol has a molecular weight of g mol-1, a density of g cm-3, and a nominal glass transition temperature of K. The hydrophilic type-300 aerosil silica nano particles obtained from Degussa Deg were thoroughly dried at K under vacuum for hours prior to use. The specific surface area of the aerosils measured by the manufacturer via BET nitrogen isotherms is m2 g-1 and each aerosil sphere is roughly nm in diameter. However, SAXS studies have shown that the basic aerosil unit consists of a few of these spheres fused together during the manufacturing process Iannacchione et al. (1998). Typically, the hydrophilic nature of the aerosils arises from the hydroxyl groups covering the surface and allows the aerosil particles to hydrogen bond to each other. This type of bonding is weak and can be broken and reformed, which leads to the thixotropic nature of gels formed by aerosils. The aerosil gelation in an organic solvent occurs via a diffusion-limited aggregation process resulting in a fractal gel of Roshi et al. (2005). See Fig. 1. However, pure glycerol is a hydrogen-bonding liquid that may alter the dispersion of aerosil from that shown in Fig. 1. Each glycerol+sil colloidal dispersion sample was created by mixing appropriate quantities of aerosil and glycerol together with spectroscopic grade (low-water content) acetone that was subsequently evaporated slowly away. The resulting mixtures were then annealed and degassed at K for hour. The resulting samples appear by visual inspection to be very similar to those made in an organic solvent like a liquid crystal. In addition to the pure glycerol sample, three dispersion samples were prepared with a mass fraction of aerosil of , , and . In addition, these samples may be characterized by the conjugate density defined as the mass of aerosil per open (glycerol) volume that allows one to determine the mean-void length Iannacchione et al. (2003). The characterization of the aerosil by and does not depend on the details of the dispersion structure, only that it be random. It is likely that the aerosil dispersion remains random in glycerol. See Table 1 for a summary of these parameters.
High-resolution ac calorimetry was performed using a home-built calorimeter at WPI. The sample cell consisted of a silver crimp-sealed cup+lid where cup dimensions are mm diameter and mm thick and lid dimensions are mm diameter and mm thick (closely matching the dimensions of the heater). The average mass of the silver cell was g and the sample (glycerol+aerosil) was mg and the total mass of cell+sample did not deviate by more than mg between the different samples. After the sample was introduced into a cell and the lid crimp sealed to the cup under pressure a - strain-gauge heater and -M carbon-flake thermistor were attached. The cell was then mounted in the calorimeter, the details of which have been described elsewhere Yao and Garland (1998). In the ac-mode, power is input to the cell as resulting in temperature oscillations with amplitude and a relative phase shift of . From these parameters and the all necessary finite conductivity corrections, the real and imaginary heat capacity were determined. All cells studied in this work closely matched each other in dimension and mass to better than 5% in order to better isolate effects introduced by the aerosil.
Three experiments were performed: temperature, time, and frequency scans with the following protocols. For temperature scans, measurements were made on a freshly mounted sample at a constant heating frequency of mHz as the cell first heated then immediately cooled between and K using a constant rate of K hr-1. After the cell had cooled back to the initial temperature of K, a time scan was preformed to monitor the heat capacity as it relaxed back to the initial value. Frequency scans were then performed at fixed temperatures from to K in steps of K over the frequency range from to mHz (i.e., from to s-1).
IV RESULTS
IV.1 Temperature and time scans
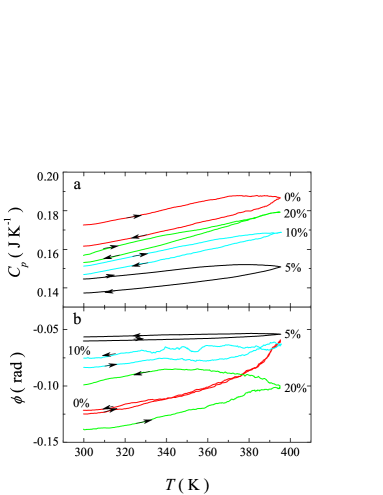
Heating and cooling scans for all samples are shown in the Fig. 2. From the data, clear indications of hysteresis are observed for the pure glycerol in that the values of on cooling do not reproduce the values observed on the heating scan of a freshly loaded sample. For the glycerol+sil samples, this hysteresis decreases with increasing aerosil content. This effect may be quantified by the area of this hysteresis loop () that decreases in a near linear fashion with the mass fraction of aerosil. This behavior is in marked contrast to that of the reduced phase shift. For pure glycerol reproduces itself between heating and cooling, but begins to take on increasing hysteresis like that described for but with increasing aerosil content.
The measurements made as a function of time, not shown here, upon returning to the starting temperature clearly indicate a very slow, nearly linear, relaxation back to the initial values. For the pure glycerol, this was observed to take to days; while for the dispersion sample, to days were required for the sample to recover. This time increased with increasing aerosil content. Clearly, long relaxations persist at these high temperatures for glycerol and the character of this relaxation changes with the addition of the aerosil gel. These extremely slow relaxations (on the order of days) are of unclear origin.
IV.2 Frequency scans
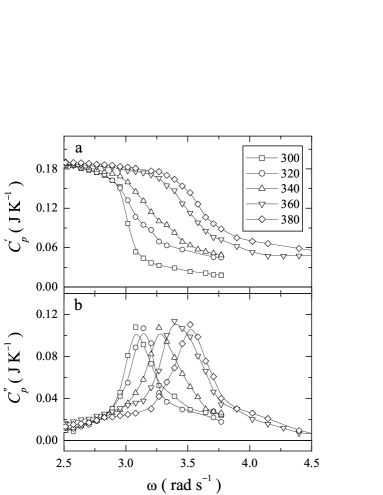
To probe the slow dynamics of the pure and dispersion samples, frequency scans were performed from mHz down to mHz. The pure glycerol frequency scans exhibited a dispersion peak in the imaginary heat capacity at a frequency () coincident with the inflection point of the real heat capacity roll-off. This dispersion peak remained stationary at s-1 as the temperature progressively increased from K to K. In contrast, the dispersion peak for the glycerol+sil samples clearly indicate a shifting dispersion peak with increasing temperature. An example of the resulting real and imaginary heat capacities after all calibrations and internal corrections were made is shown in Fig. 3 for the sample at five temperatures. The imaginary heat capacity shows a dispersion peak at a frequency that again coincides with the inflection point of the real heat capacity roll-off. However, as the temperature increases progressively to K, the dispersion peak shifts towards higher frequencies consistent with results observed in the glassy state of pure glycerol Simon and McKenna (1997).
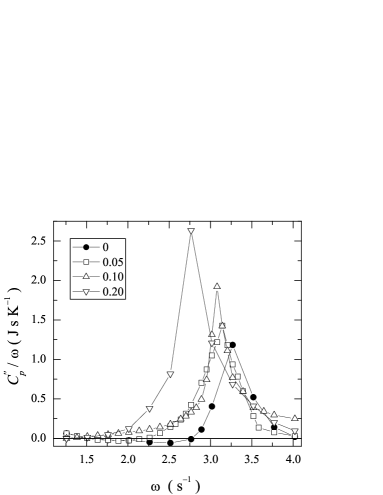
The evolution of the peak at K as a function of frequency is given in Fig. 4 for several aerosil concentrations. The dispersion peak increases in height and shifts to lower frequencies with increasing amounts of aerosil. The integration of over the range of frequency covered yields the total dispersion heat capacity of this relaxation mode (), which linearly increases with aerosil concentration.
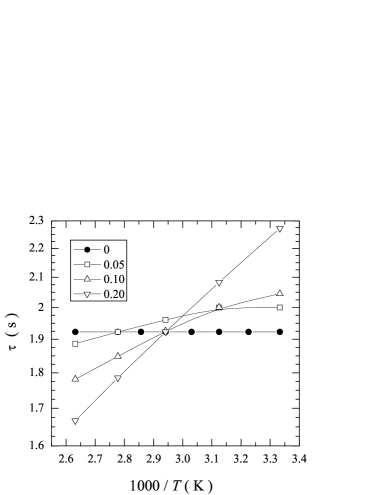
The frequency of the imaginary heat capacity dispersion peak determines a characteristic relaxation time for this dynamic mode as . To establish whether these relaxations are energetically activated, a semi-log plot of against was made, which would reveal a linear region whose slope is directly related to the activation energy . See Eq. (11). Such a plot is shown in Fig. 5. The pure glycerol does not exhibit activated dynamics and the relaxations for the glycerol+sil dispersions become progressively activated at progressively lower temperatures representing the onset of Vogel-Fulcher or Arrhenius behavior. It is clear that as the aerosil content increases, the activation energy (high-temperature relaxation time) of the glycerol+sil system continuously increases (decreases). Table 1 summarizes the results of the dispersion peak integration as well as the Arrhenius analysis.
V DISCUSSION AND CONCLUSIONS
Since the sample and cell configuration was constructed to be nearly identical for all the samples studied, the differences observed with the introduction of aerosil is particularly significant. This is especially true since the thermal conductivity of the silica is greater than the glycerol and its increasing content should have improved the internal thermal conductivity of the sample. Also, since both the aerosil and glycerol can hydrogen-bond to themselves and each other, the aerosil surface is likely coated by a bound layer of glycerol. This would strongly couple the two components of this dispersion. At room temperature and above, pure glycerol behaves as an isotropic liquid but still retains some strong molecular interactions to induce the hysteresis shown in Fig. 2. The mass of the cell+sample was checked repeated at various stages during the scan protocol and there were no significant changes. Thus, desorbing and absorbing moisture during the thermal scans cannot account for the observed hysteresis behavior. However, this hysteresis relaxes very slowly, on the order of days, and so it does not seem to be connected to the dynamics observed by the frequency scans (on the order of a second) for the pure glycerol or the glycerol+sil samples.
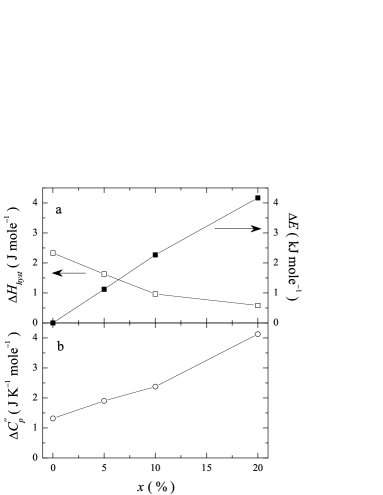
As the silica density increases, the effective viscosity of the colloidal mixture increases and there is also an increase in the activation energy. Since these experiments were conducted well above the pure glycerol glass transition temperature of K, the induced glassy behavior is likely due to the aerosil-imposed frustration on a large collection of glycerol molecules. This is evident considering that the onset of this effect begins even for the sample, which has a mean void length scale of nm. The estimated size of a glycerol molecule from the specific volume is nm. A summary of the thermodynamic results are given in Fig. 6 and Table 1. Clearly there is a strong correlation of the activation energy and the total heat capacity loss , both increasing linearly with aerosil content.
The energy dynamics of glycerol containing a colloidal dispersion of aerosil silica nano particles has been studied by high-resolution modulation calorimetry. This has revealed a temperature and silica density dependent complex heat capacity. It has been observed that under certain experimental conditions of temperature and frequency, this system shows interesting frequency dynamics and displays dispersion peaks that shift towards higher frequency with increasing temperature. These results are consistent with those found for the glassy state of glycerol Simon and McKenna (1997). As the silica density is increased in the isotropic glycerol, larger dispersion peaks are found at lower frequencies indicating an increase in the activation energy of this relaxation. This phenomena may be explained in terms of the formation of ”stuck states” of glycerol in the voids between glycerol-coated silica particles also manifesting itself in the increase in the sample’s viscosity. This work highlights the potential of using frustrated glass-forming liquids via colloidal gel dispersions as a means of gaining insight into the glass state. Dielectric spectroscopy studies of such systems as well as x-ray analysis of the structure of the aerosil dispersion would be of great interest.
Acknowledgements.
We are grateful to C. W. Garland for useful discussions. This work was supported by the NSF-CAREER award DMR-0092786.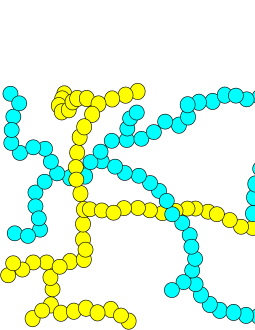
References
- Simon and McKenna (1997) S. L. Simon and G. B. McKenna, J. Chem. Phys. 107, 8678 (1997).
- Richert and Angell (1 June 1998) R. Richert and C. A. Angell, Journal of Chemical Physics 108, 9016 (1 June 1998).
- Birge et al. (1997) N. O. Birge, P. K. Dixon, and N. Menon, Thermochimica Acta 304-305, 51 (1997).
- Weyer et al. (1997) S. Weyer, A. Hensel, J. Korus, E. Donth, and C. Schick, Thermochimica Acta 304-305, 251 (1997).
- Alig (1997) I. Alig, Thermochimica Acta 304-305, 35 (1997).
- Prevosto et al. (2002) D. Prevosto, P. Bartolini, R. Torre, S. Capaccioli, M. Riccizi, A. Taschin, D. Pisignano, and M. Lucchesi, Philosophical Magazine B 82, 553 (2002).
- Sharma et al. (2003) D. Sharma, S. K. Dwivedi, R. K. Shukla, and A. Kumar, Materials and Manufacturing Processes 18, 93 (2003).
- Yu and Carruzzo (2004) C. C. Yu and H. M. Carruzzo, Physical Review E 69, 051201 (2004).
- Iannacchione et al. (1998) G. S. Iannacchione, C. W. Garland, J. T. Mang, and T. P. Rieker, Phys. Rev. E 58, 5966 (1998).
- Iannacchione et al. (2003) G. S. Iannacchione, S. Park, C. W. Garland, R. J. Birgeneau, and R. L. Leheny, Phys. Rev. E 67, 011709 (2003).
- Donth et al. (1997) E. Donth, J. Korus, E. Hempel, and M. Beiner, Thermochimica Acta 304-305, 239 (1997).
- Sharma et al. (2000) D. Sharma, R. Shukla, A. Singh, A. Nagpal, and A. Kumar, Adv. Mater. Opt. Electron. 10, 251 (2000).
- Gmelin (1997) E. Gmelin, Thermochimica Acta 304-305, 1 (1997).
- Kraftmaker (2002) Y. Kraftmaker, Physics Reports 356, 1 (2002).
- Finotello et al. (1997) D. Finotello, S. Qian, and G. S. Iannacchione, Thermochimica Acta 304-305, 303 (1997).
- Sullivan and Seidel (1968) P. F. Sullivan and G. Seidel, Adv. Mater. Opt. Electron 173, 679 (1968).
- Yang and Nelson (1995) Y. Yang and K. A. Nelson, J. Chem. Phys. 113, 7722 (1995).
- Glorieux et al. (2002) C. Glorieux, K. A. Nelson, G. Hinze, and M. D. Fayer, J. Chem. Phys. 116, 3384 (2002).
- Franosch et al. (1998) T. Franosch, W. G tze, M. R. Mayr, and A. P. Singh, J Non-Cryst. Solids 235-237, 71 (1998).
- Vogel (1921) H. Vogel, Phys. Z. 22, 645 (1921).
- Fulcher (1926) G. S. Fulcher, J. Am. Ceram. Soc. 6, 339 (1926).
- (22) Degussa Corp., Silica Division, 65 Challenger Road, Ridgefield Park, NJ 07660. Technical data is given in the Degussa booklet Aerosila.
- Roshi et al. (2005) A. Roshi, S. Barjami, D. Paterson, I. McNulty, and G. S. Iannacchione (2005), in preparation.
- Yao and Garland (1998) H. Yao and C. W. Garland, Rev. Sci. Instrum. 69, 172 (1998).