Crossover from the pair contact process with diffusion to directed percolation
Abstract
Crossover behaviors from the pair contact process with diffusion (PCPD) and the driven PCPD (DPCPD) to the directed percolation (DP) are studied in one dimension by introducing a single particle annihilation and/or branching dynamics. The crossover exponents are estimated numerically as for the PCPD and for the DPCPD. Nontriviality of the PCPD crossover exponent strongly supports the non-DP nature of the PCPD critical scaling, which is further evidenced by the anomalous critical amplitude scaling near the PCPD point. In addition, we find that the DPCPD crossover is consistent with the mean field prediction of the tricritical DP class as expected.
pacs:
64.60.Ht,05.70.Ln,89.75.DaThe absorbing phase transition (APT) has emerged during the last few decades as a prototype of nonequilibrium critical phenomena. The APT is a transition from an active phase into an inactive (absorbing) phase which is composed of absorbing (trapped) configurational states where the system cannot leave by the prescribed dynamic rules. As in the equilibrium critical phenomena, a few scaling exponents characterize and classify critical behaviors into universality classes H00 ; O04 . Robustness of the directed percolation (DP) universality class with respect to the microscopic details led to the “DP conjecture” J81 ; G82 that a model should belong to the DP class if it has a unique absorbing state without additional symmetry, conservation laws, quenched disorder, and long-range interactions. Although significant progress has been achieved to date, the full understanding on the main features of the APT universality classes is still far from complete.
To achieve such a goal, it is crucial to identify the universality class of the pair contact process with diffusion (PCPD) G82 ; HT97 ; CHS01 , which has been the most controversial topic these days, to our knowledge. The PCPD is a variant of the pair contact process J93 by allowing single-particle diffusion in addition to binary fission and annihilation dynamics ( and ). Even with combined efforts of extensive and highly equipped numerical and analytical studies, its one-dimensional version has defied a consensus as yet HH04 . Rather, various possible scenarios have been suggested with the DP class in the center of this controversy. In one scenario, the PCPD should belong to a universality class distinct from the DP with a unique set of critical exponents KC03 ; PP05a ; PP05b or continuously varying exponents due to the marginal perturbation NP04 . The other states that the PCPD will eventually flow to the DP fixed point after a huge crossover time H03 ; BC03 ; H05 . More scenarios can be found in Ref. HH04 . In high dimensions, it is unquestionably clear that the PCPD and the DP exhibit different critical scaling.
The strong corrections to scaling are the main obstacle for the numerical study to determine the universality class of the PCPD. To make matters worse, the field theory with a single component order parameter is shown to be not viable JvWOT04 . It implies that the proper field theory, if it exists, needs (at least) two independent order parameters, which is also independently proposed by us from the numerical study of the driven PCPD (DPCPD)PP05a .
.
In this Rapid Communication, we propose an approach to settle down or at least moderate the PCPD controversy by scrutinizing closely the crossover behavior from the PCPD to the DP class. We allow unary branching and/or annihilation dynamics ( and ) in the PCPD model, which should lead to the well-known DP critical dynamics as soon as it is introduced. The nontrivial nature of the DP critical line approaching the PCPD point as well as anomalous crossover scaling behavior would serve as an indicative of different scaling at the PCPD point, distinct from the DP.
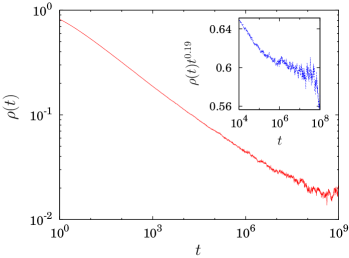
Although the accurate estimation of the critical exponent values for the PCPD is severely plagued by corrections to scaling, the critical point itself can be located with relatively high precision. In Fig. 1, the density decay near criticality is shown for the PCPD model of which detailed dynamics is given in Eq. (1) with . The system size at a tuning parameter (0.133 522) is () and the number of independent samples is 32 (104). All samples carry at least one neighboring pair until the end of simulations, , which guarantees that finite size effects have not emerged as yet. From Fig. 1, the critical point is estimated as with the number in the parentheses as the uncertainty of the last digit. It should be emphasized that our estimation of the critical point for the PCPD does not resort to any prescribed critical exponent value.
In the generalized crossover model including unary branching and/or annihilation processes, it is relatively easier to locate the critical points accurately by utilizing the known DP critical exponent values. With the annihilation and/or the branching , the density decay in the absorbing phase should be exponential in time at least in one dimension, which nullifies the long-term memory effect of the isolated particles NP04 and the simple unplagued DP scaling should be anticipated. The accurate information on the critical line as a function of the unary process rate allows us to estimate the crossover exponent , which describes the crossover scaling, if it exists, from the PCPD to the DP.
The detailed evolution rules for the generalized crossover model are summarized using stoichiometric notations as
| (1a) | |||
| (1b) | |||
| (1c) | |||
| (1d) | |||
where () stands for a hard core particle (vacancy) and . The periodic boundary conditions are employed on a one-dimensional lattice with size . The case of , , , and with a tuning parameter corresponds to the PCPD model studied before PP05a , of which the critical point is accurately located through Fig. 1. In the case of nonzero , the critical point is located by observing the flatness of as a function of with the DP critical exponent J96 . In the following, we always set and .
The simulation algorithm to mimic the dynamics in Eq. (1) is as follows: First, choose a particle at random. Then, choose one of its nearest neighboring sites randomly as a target site. If the target site is vacant, the chosen particle is annihilated with probability , branches a particle at the target site with probability , or hops to that site with probability . The random selection of one of nearest neighbors amounts to the factor of the transition rates in Eqs. (1c) and (1d). In the case where the target site is already occupied, both particles are annihilated with probability or one extra particle is generated at a randomly chosen nearest neighbor site of the pair with probability when that site is vacant. If the chosen site is already occupied, this branching attempt is rejected. After this update, the time increases by , where is the total number of particles at time just before the update.
| 0 | 0.133 519(3) | 0.133 519(3) |
|---|---|---|
| 0.133 172(3) | 0.134 085(5) | |
| 0.132 581(2) | ||
| 0.132 080(3) | 0.135 81(1) | |
| 0.131 325(5) | 0.136 98(1) | |
| 0.130 715(5) | 0.137 92(1) | |
| 0.130 185(5) | 0.138 73(1) | |
| 0.129 708(3) | 0.139 46(1) |
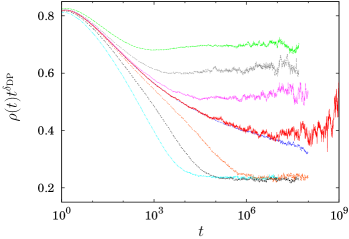
By observing how behaves in the asymptotic regime, the critical point values for nonzero ’s are estimated. If the system is in the active (absorbing) phase, those curves should veer up (down). Only at criticality, a flat straight line can be observed. Initially, all sites are occupied. The simulations were performed up to and no finite size effects have been observed with system size . The numerical estimates for the critical point values at and at are tabulated in Table 1. Figure 2 shows the critical density decay for various values of at and 1. The flatness of the critical curves can be seen quite early even for very small , while the PCPD lines () do not show any flatness within our observation time. It may be understood either by a tremendously long dynamic correction to the DP scaling H05 or by a non-DP scaling for the PCPD. In either case, it is evident that there exists a diverging crossover time scale as .
The crossover scaling function near the PCPD critical point should take the form
| (2) |
where with the crossover exponent , , and are the critical exponents of the PCPD, and with being the PCPD critical point value. The crossover time diverges as such that .
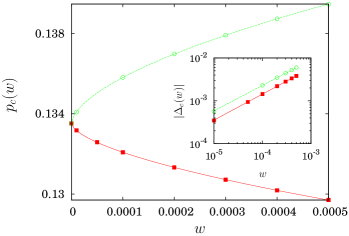
The crossover exponent can be calculated without the knowledge of the values of and by studying how the DP critical line approaches the PCPD critical point. This line should be one of the renormalization group flow lines such as DL9 , where and is a (nonuniversal) constant. In Fig. 3, the crossover exponent is estimated using the least-square fitting, which turns out to have a nontrivial and universal value of . This nontrivial nature of the critical line () signals strongly a possible non-DP scaling at the PCPD point.
The similar analysis can be applied to the DPCPD with diffusion bias by modifying the dynamics in Eqs. (1) in such a way that the dynamics (1d) is absent and the dynamics (1c) is replaced by
| () |
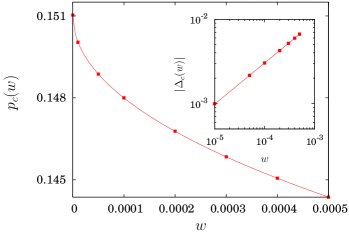
With , this model is the DPCPD studied in Ref. PP05a . Since the diffusion bias should not change the DP scaling PP05a , this model with nonzero is still expected to belong to the DP class. Figure 4 shows how the DPCPD crosses over to the DP as increases and finds the crossover exponent , which is consistent with the mean field prediction of the tricritical DP class Tri and, in turn, confirms again that the upper critical dimension of the DPCPD is 1 comment .
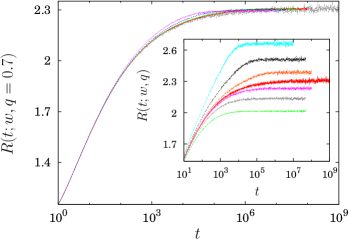
To get a more concrete evidence for the non-DP nature of the PCPD scaling, we go back to the scaling function in Eq. (2) which can be rewritten at criticality as
| (3) |
where and . Since should be a finite constant as to guarantee the DP scaling for nonzero , the critical decay amplitude is proportional to for sufficiently small where the crossover scaling is valid.
If the PCPD belongs to the DP class (), the amplitude converges to a nonzero value as . Otherwise, it decreases algebraically with , using the present best estimates for the PCPD exponent values as and KC03 ; PP05a ; H05 . In Fig. 2, there are apparently two very different convergent behaviors for and 1. Naive estimates lead to for and for , both of which do not simultaneously fit into either the DP or the non-DP scenario.
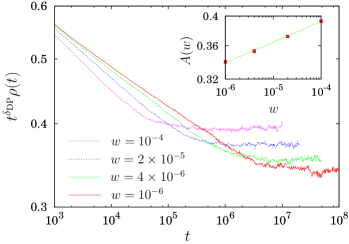
We find that this perplexing result originates from the narrowness of the crossover scaling region near the PCPD point. To get a hint for the valid scaling regime, we observe the pair density as well as the particle density in simulations. Both quantities should scale in the same way and their critical amplitudes also scale similarly as . Hence, the ratio should be independent of for the valid crossover scaling regime in the asymptotic limit. The inset of Fig. 5 shows that both cases at and 1 have not entered the scaling regime as yet up to , which implies that the naive estimates for should be significantly influenced by the corrections to scaling. Fortunately, we find a reasonably good scaling regime for not so small at . Figure 5 shows that the scaling regime is reached already for . The inset of Fig. 6 shows how the critical amplitude of the density, say , behaves in the crossover scaling regime, from which we estimate that is consistent with the PCPD estimate. This result strongly supports again the non-DP nature of the PCPD scaling. The crossover exponent estimated for the case of is , which is compatible with the previous estimation within error.
To conclude, we studied the crossover behavior from the pair contact process with diffusion and the driven pair contact process with diffusion to the directed percolation. We found that the crossover for the PCPD to the DP is nontrivial and the critical amplitude scaling is anomalous, which strongly supports the non-DP nature of the PCPD scaling. The crossover exponent for the DPCPD takes the mean field value of the tricritical DP (TDP) Tri . This implies that the two-dimensional PCPD might have connections to the TDP that is under our current investigation.
References
- (1) H. Hinrichsen, Adv. Phys. 49, 815 (2000).
- (2) G. Ódor, Rev. Mod. Phys. 76, 663 (2004).
- (3) H.K. Janssen, Z. Phys. B: Condens. Matter 42, 151 (1981).
- (4) P. Grassberger, Z. Phys. B: Condens. Matter 47, 365 (1982).
- (5) M.J. Howard and U.C. Täuber, J. Phys. A 30, 7721 (1997).
- (6) E. Carlon, M. Henkel, and U. Schollwöck, Phys. Rev. E 63, 036101 (2001).
- (7) I. Jensen, Phys. Rev. Lett. 70, 1465 (1993).
- (8) For a review, see M. Henkel and H. Hinrichsen, J. Phys. A 37, R117 (2004).
- (9) J. Kockelkoren and H. Chaté, Phys. Rev. Lett. 90, 125701 (2003).
- (10) S.-C. Park and H. Park, Phys. Rev. Lett. 94, 065701 (2005).
- (11) S.-C. Park and H. Park, Phys. Rev. E 71, 016137 (2005).
- (12) J.D. Noh and H. Park, Phys. Rev. E 69, 016122 (2004).
- (13) H. Hinrichsen, Physica A 320, 249 (2003).
- (14) G.T. Barkema and E. Carlon, Phys. Rev. E 68, 036113 (2003).
- (15) H. Hinrichsen, e-print cond-mat/0501075.
- (16) H.-K. Janssen, F. van Wijland, O. Deloubriere, and U. C. Täuber, Phys. Rev. E 70, 056114 (2004).
- (17) I. Jensen, J. Phys. A 29, 7013 (1996).
- (18) See, e.g., I.D. Lawrie and S. Sarbach, in Phase Transitions and Critical Phenomena, edited by C. Domb and J.L. Lebowitz (Academic Press, London, 1984), Vol. 9.
- (19) T. Ohtsuki and T. Keyes, Phys. Rev. A 35, 2697 (1987); 36, 4434 (1987); S. Lübeck (unpublished); P. Grassberger, e-print cond-mat/0510428.
- (20) Our definition of the crossover exponent is the inverse of that in Ref. Tri and there might be a logarithmic correction though not visible.