Twin spin/charge roton mode and superfluid density: primary determining factors of in high- superconductors observed by neutron, ARPES, and SR
Abstract
In the quest for primary factors which determine the transition temperature of high- cuprate superconductors (HTSC), we develop a phenomenological picture combining experimental results from muon spin relaxation (SR), neutron and Raman scattering, and angle-resolved photoemission (ARPES) measurements, guided by an analogy with superfluid 4He. The 41 meV neutron resonance mode and the ARPES superconducting coherence peak (SCP) can be viewed as direct observations of spin and charge soft modes, respectively, appearing near () and the center of the Brillouin zone, having identical energy transfers and dispersion relations. We present a conjecture that the mode energy of this twin spin/charge collective excitation, as a roton analogue in HTSC, plays a primary role in determining , together with the superfluid density at . We further propose a microscopic model for pairing based on a resonant spin-charge motion, which explains the extremely strong spin-charge coupling, relevant energy scales, disappearence of pairing in the overdoped region, and the contrasting spin-sensitivities of nodal and antinodal charges in HTSC systems. Comparing collective versus single-particle excitations, pair formation versus condensation, and local versus long-range phase coherence, we argue that many fundamental features of HTSC systems, including the region of the Nernst effect, can be understood in terms of condensation and fluctuation phenomena of bosonic correlations formed above .
keywords:
high- superconductivity, SR, ARPES, neutron scattering.1 Introduction
Since the author joined the research group of Prof. Toshimitsu Yamazaki at the Univ. of Tokyo in 1976, the ultimate goal of our research has been to combine powerful modern experimental techniques with insightful physics phenomenology. In this lecture, we would like to present our attempt towards this goal in 18 years of study on high- cuprate superconductors (HTSC), motivated by the quest for primary factors which determine , and guided by an instructive analogy between HTSC and superfulid He systems. Some seed ideas of the present work have been discussed in ref. [1].

2 Superfluid Energy Scales vs.
By 1989, within a few years after the discovery of HTSC systems, we established [1,2] strong correlations between and (superconducting carrier density / effective mass) at by measuring the muon spin relaxation rate and the London penetration depth as . As shown in Fig. 1, a nearly linear relationship between and (often referred to as the “superfluid density”) holds in most of the underdoped cuprates as well as in HTSC systems with Cu/Zn substitutions [3], formation of island regions having static stripe spin correlations [4], and overdoped systems having microscopic phase separation between superfluid and normal unpaired fermions [5,6]. The strong correlation was one of the earliest signatures suggesting fundamental difference of HTSC systems from BCS superconductors. The robustness of this relationship against heterogeneity, analogous to the case in superfluid He films and 3He/4He mixture films on regular and porous media [1], can be expected only for systems with very strong coupling. In Fig. 1, we also notice that the 214 systems exhibit an “early branching off” from the nearly linear relationship, which we will ascribe to the closeness to competing magnetic states, as discussed later.
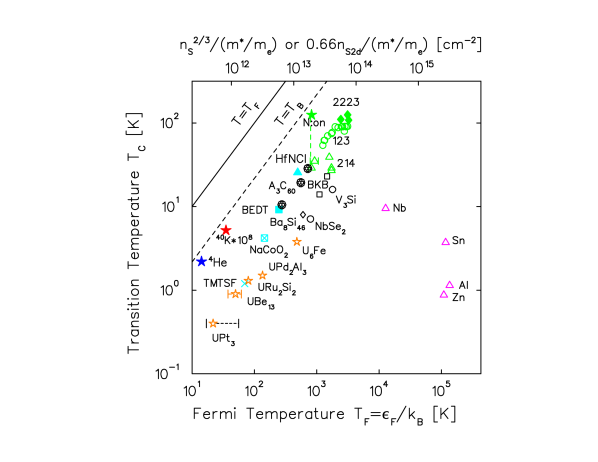
In 1991 [7], we converted the superfluid density into the effective Fermi temperature , which represents an effective kinetic energy scale of mobile superconducting carriers corresponding to the “Drude” spectral weight in optical responses. The results in Fig. 2 are shown together with the Bose-Einstein (BE) condensation temperature expected when all the superconducting carriers form a non-interacting ideal Bose gas with the density and mass 2. The transition temperatures of HTSC, organic BEDT, and some other novel superconductors are reduced by a factor 4-5 from , while the above-mentioned linear relationship emerges to be parallel to the line. This feature suggests a fundamental importance of the BE condensation concept in cuprates. The blue star point represents the superfluid transition of (3-dimensional) liquid He, at = 2.2 K which is about 50 % reduced from the K calculated with the number density and mass. Figure 2 can be viewed as an experimentalist’s way to classify various superconductors and superfluids between the two extrema of idealized BE and BCS condensations in the strong and weak-coupling limits.
3 BE-BCS crossover and phase diagram of HTSC

In 1993-94 we proposed a conjecture [8-10] that the phase diagram of HTSC systems can be mapped onto a general concept of BE to BCS crossover shown in Fig. 3. When bosonic correlations develop well above , BE condensation occurs when the thermal wave length of bosons becomes comparable to the interboson distance, resulting in in 2-d and in 3-d systems. In the BCS condensation, the attractive “pairing” energy scale (i.e., the gap) determines , since the number-density restriction for BE condensation is readily satisfied when the Cooper pairs (bosons) are formed at . The v.s. correlations and the pseudogap behavior lead to a view that the underdoped cuprates are in the BE region, with the representing pair (boson) formation above . In this mapping, the optimal-doping region lies in the crossover region, where the number-density energy scale (the effective Fermi temperature ) is close to the energy of pair mediating interaction . In HTSC systems, the optimum region appears around 2000 K. Hence the antiferromagnetic spin fluctuations, having a similar energy scale, become an attractive candidate for the pairing mediator [10].
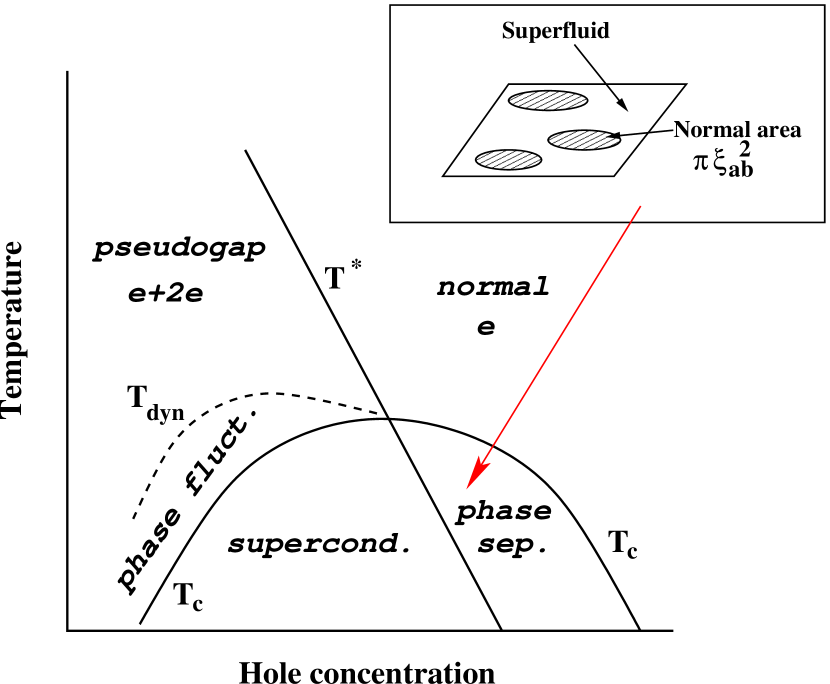
Figure 4 shows our current view of the actual HTSC phase diagram [1,12]. Several experimental results [5-6] in the overdoped region indicate existence of microscopic phase separation, as we first suggested in 1993 [5] and as has been directly confirmed very recently by scanning tunneling microscopy (STM) studies [11]. The overdoped region is thus quite different from the simple BCS situation. When the pairing strength rapidly decreases with increasing doping (increasing ), the system responds by creating a “phantom superconducting” region where superconductivity is maintained by microscopic phase separation to gain condensation energy at the expense of Coulomb energy for charge disproportionation [6].
4 Collective soft-mode energies determining
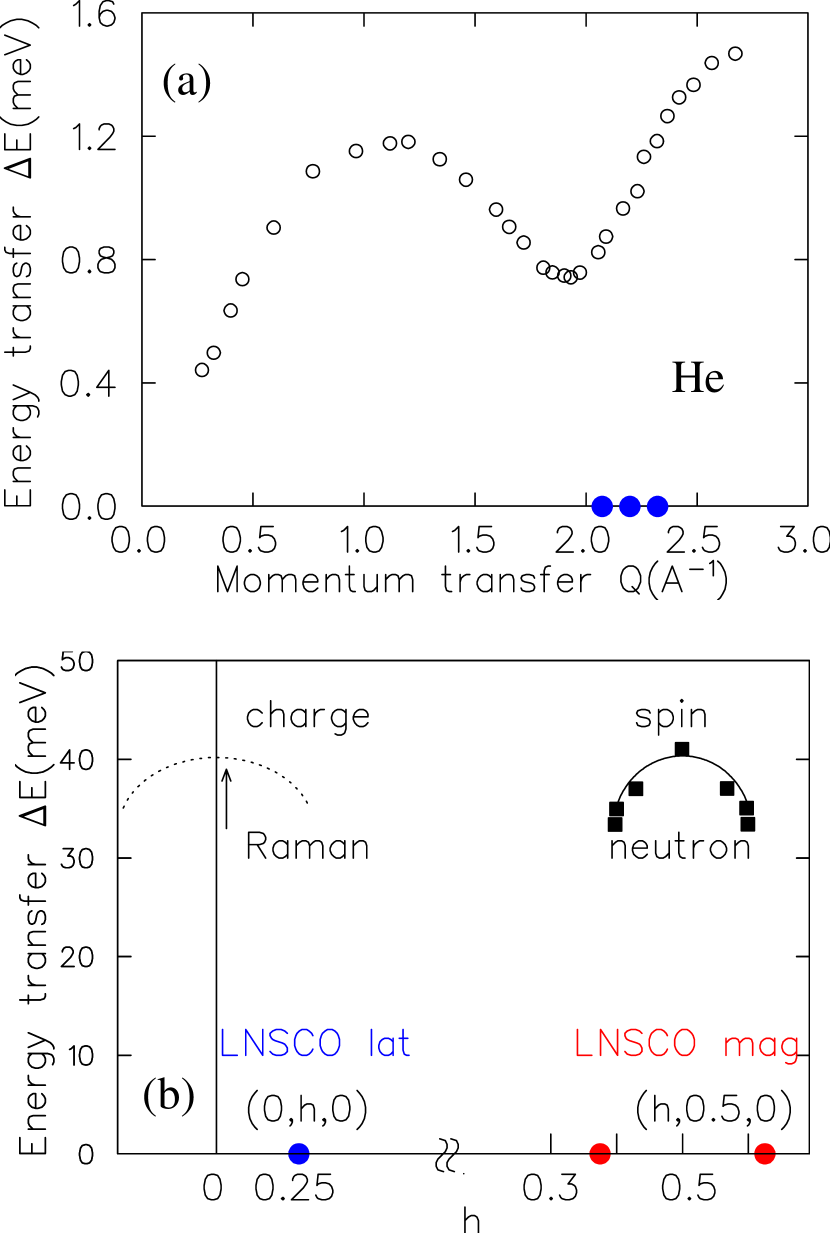
In superfluid 3-d liquid 4He, the reduction of the lambda temperature = 2.2 K from the idealized = 3.2 K is caused by the existence of roton excitation, which ia a soft phonon mode towards solidification of He. Figure 5(a) shows the phonon-roton dispersion relation [13] together with the Bragg peaks of solid He [14]. The effect of roton on can be clearly seen via the nearly linear relationship in Fig. 6 which plots versus the roton mode energy (observed at different pressures [15]: orange-star symbols), where the He values for the both axes are multiplied by a factor 60 to be compared with the cuprates. Helium rotons demonstrate that the closeness to the competing state (solid He) influences the condensation temperature of a bosonic superfluid.
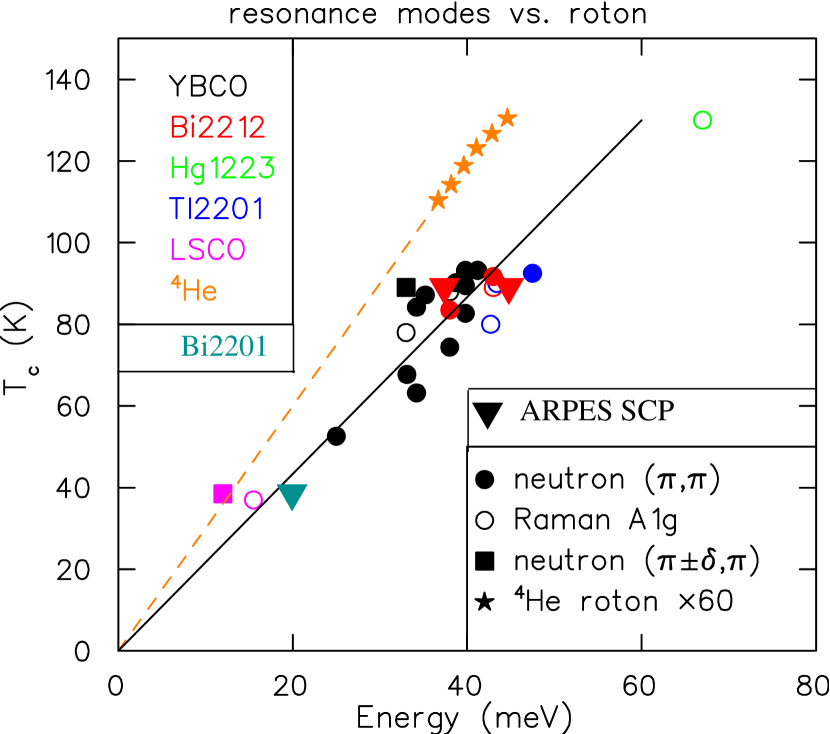
Guided by an analogy to He, we plot the energy of the 41 meV magnetic resonance mode of HTSC [16] versus in Fig. 6. Also plotted is the energy of Raman mode which follows the same relationship [17]. The magnetic resonance mode is a soft-magnon mode towards the magnetically ordered stripe state competing with the superconducting state, analogous to He rotons being a soft phonon mode towards a competing state. The neutron resonance detects an S=1 excitation with the wavevector transfer (), while the Raman mode represents an S=0 excitation near the zone center. In most of known cases, the “2-magnon” mode in Raman measurements, having twice the magnon energy, is required to match the nearly zero net momentum transfer in Raman measurements. In contrast, Fig. 6 shows a one-to-one correspondence of neutron and Raman energies. This apparent contradiction can be resolved by assuming a roton-analogue twin mode in HTSC [1], having the spin-branch near () and charge branch near the zone center, with the same energy minimum and dispersion, as illustrated in Fig. 5(b).
Indeed the competing states in the cuprates, such as the stripe state or the Mott insulator antiferromagnetic state, have both spin and charge orders, with the spin Bragg peak (red circles in Fig. 5(b)) and charge Bragg peak (blue circles) appearing when that state wins against the superconducting state [18]. When the superconducting state wins, the spin-charge modulations become dynamic, yet conserving the very strong correlations with each other and having the same soft-mode energy transfers corresponding to the “superconducting condensation energy”. Via this mechanism, although neutrons and photons (in the Raman studies) create different final states (S=1 and S=0 states) with different momentum transfers, the spin and charge branches appear with the same energy transfers. The magnon soft-mode can exist only when it is associated with the partner dynamic charge modulation. Thus the excitation of the 41 meV mode contributes to the reduction of superfluid density, playing a role similar to He rotons, leading to a linear relationship between and the mode energy for HTSC systems as shown in Fig. 6. This analogy between He and HTSC is strengthened by their nearly equal ratios of mode energy and .
5 Common spin-charge dispersion relation and ARPES coherence peak as the charge branch
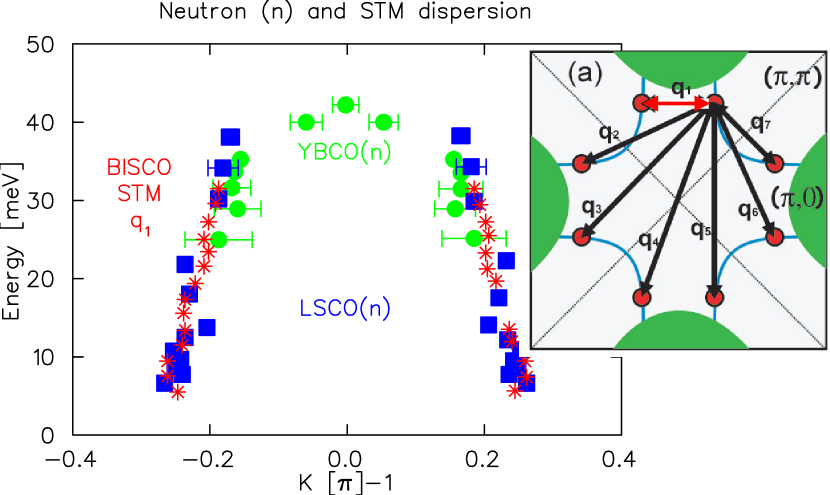

The 41 meV spin-branch exhibits a dispersion relation, extending downwards towards the satellite stripe Bragg peaks, as shown for YBa2Cu3O7-δ (YBCO) and La2-xSrxCuO4 (LSCO) [19] in Fig. 7 and even in non-superconducting La2-xBaxCuO4 (LBCO) with = 1/8 [20]. There seem to be two cases: (a) the mode energy at () is reduced for systems with lower ’s, such as in the underdoped YBCO; and (b) the dispersion itself does not change but the lower-energy branch is populated for systems with lower ’s, such as in LSCO and LBCO 214 cuprates. When we plot the energy of the spectral-weight maximum of the lower-energy populated branch, which is often referred to as the “spin gap energy” in neutron studies, the correspondence with superfluid He becomes even better, as shown by the filled square symbols in Fig. 6. Christesen et al. [19] noticed that, after a factor 2 adjustment of momentum transfers, the same dispersion relation is also seen in the charge scattering observed in the STM studies in Bi2Sr2CaCu2O8+δ (Bi2212) [21], shown by the red star symbols in Fig. 7.
The present author has recently noticed that this “common dispersion of spin and charge responses” appears also in the ARPES results of the “superconducting coherence peak” (SCP), obtained by Platé et al. [22] in Tl2201 near the antinodal wavevector (). Figure 8 shows the energy-transfer by photons to the system in ARPES (i.e., negative peak energy) plotted versus the distance of the momentum transfer from (), showing dispersion nearly identical to those in Fig. 7. Furthermore, the energy transfer of the ARPES SCP [23] closely follows the relationship found for neutron and Raman modes, as shown in Fig. 6 with filled-triangle symbols. These observations suggest that the ARPES SCP may be interpreted as a direct manifestation of the charge branch of the twin spin-charge soft mode.
6 Collective mode versus single-particle pair-breaking excitations
Although fundamental differences of HTSC from traditional BCS superconductors were noticed by the mid 1990’s, the destruction of superfluid density has almost always been discussed exclusively in terms of single-particle pair-breaking excitations: people’s minds have still been controlled by the BCS theory. This tendency has perhaps been enhanced by the successful explanation of the low-temperature penetration depth results by the d-wave nodal quasiparticle excitations.
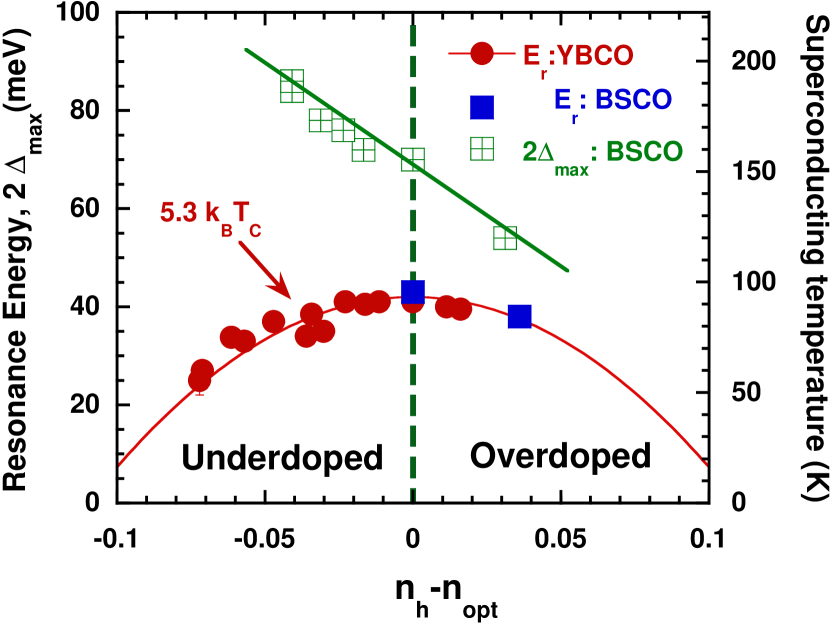
Single-particle excitations would cost the gap energy in pair breaking. Imagine a spin-singlet charge pair formed to gain the antiferromagnetic exchange energy . Input of energy is required to flip the spin in the single-particle process. In collective excitations based on many-body correlations, a spin triplet excitation can be realized as a spin wave which can be obtained without an energy input of . This is why the S=1 neutron resonance mode does not cost any pair-breaking energy. Indeed, the mode energy in the underdoped HTSC, proportional to , follows the doping dependence completely opposite to the behavior of the gap (and pairing) energy (and ), as illustrated in Fig. 9 [16]. It is very difficult to ascribe to the nodal quasiparticle pair-breaking excitations [24], in view of this opposite behavior of and .
From a single-particle type view, an ARPES excitation near the antinodal () point requires to break the Cooper pair, costing the gap energy , in addition to any bosonic mode energy to which the charge is coupled. So, the SCP energy has been discussed in terms of [25]. However, imagine the case when the energy input by ARPES photon is used to create collective dynamic spin-charge modulations, as illustrated in Fig. 8(d) [18]. Thanks to the microscopic separation of spins and charges in this stripe pattern, the spin of a hole is “frustrated” with the neighbouring Cu moments. This “geometrical frustration” makes the spin direction of the charge irrelevant when the charge is knocked out as the ARPES photo-electron: the charge liberation does not cost the pairing energy or . Therefore, we would expect direct correspondence of the ARPES SCP energy to the boson mode energy for the case of collective excitations of the charge soft mode. This explains the agreement of neutron and SCP energies in Fig. 6. Such a liberated charge would carry momentum of the “broken” charge-density-wave pair correlation, as clearly seen from the ARPES momentum in Fig. 8(a) [22].
7 Microscopic pairing via resonant spin-charge motion
These considerations suggest that pairing in HTSC should involve: (1) a very strong spin and charge coupling; (2) energy scale of (charge kinetic energy) comparable to that of pair-mediation interaction; and (3) disappearance of pairing in the overdoped region. Guided by these, the present author proposed a pairing mechanism in 2004 [1] based on resonant spin-charge motion of antinodal charges.

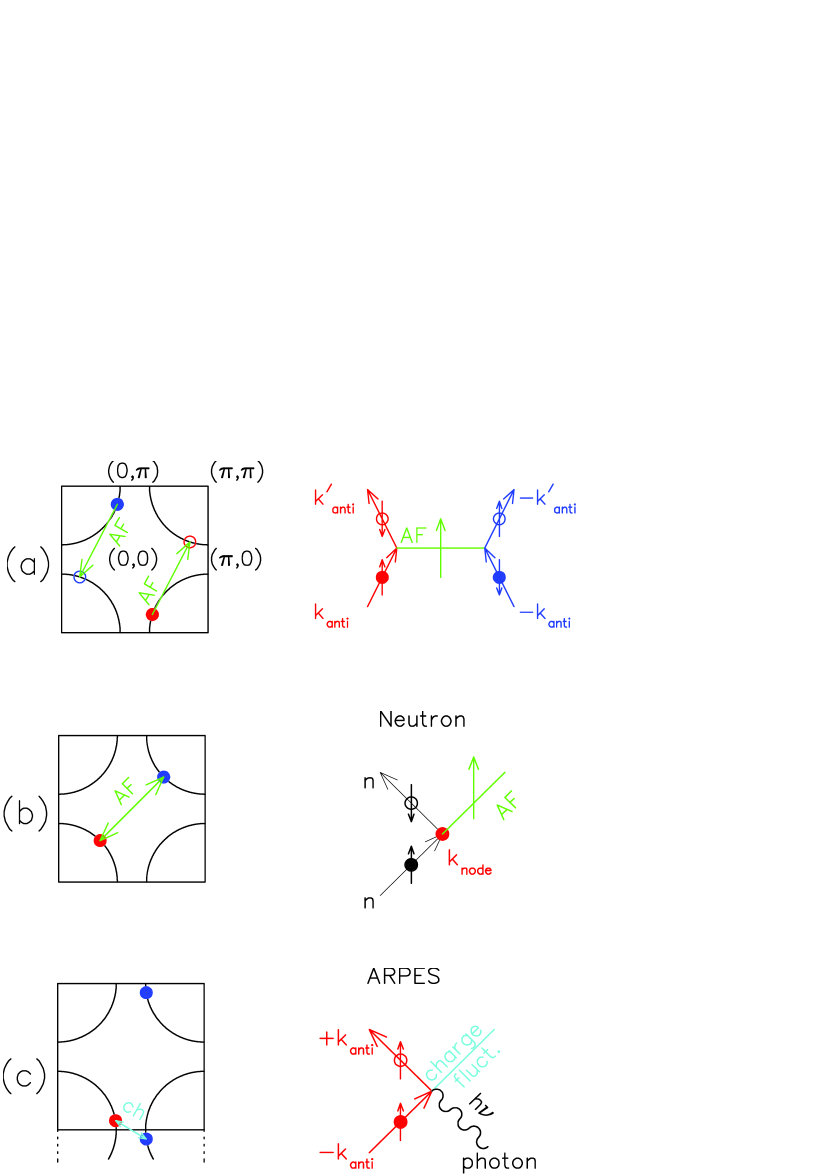
Figure 10 shows a motion of a hole in dynamic antiferromagnetic (AF) correlations of surrounding Cu moments. When the AF pattern is static, a charge motion towards the Cu-O bond direction (with the antinodal momentum) would cause three frustrated bonds (Fig. 10(a)). However, when this charge motion occurs in sequence with half a period of AF fluctuations, frustrations can be avoided (Fig. 10(b)). Within one period, the charge would proceed twice the lattice constant . This process brings a very strong coupling between the AF fluctuations with and the antinodal charges at the zone boundary with having the Fermi energy . Only when accompanied by a resonant AF fluctuation can an antinodal charge move freely in the system.
Thus, antinodal charge motion should always be associated with an AF spin fluctuation, similarly to the charge motion in BCS superconductors associated with lattice deformation, i.e., a phonon. The existence of a AF fluctuation can provide an energy benefit to the second antinodal charge. This results in a “scattering” process which couples antinodal charges with opposite momentum, as shown in Fig. 11(a). Unlike BCS, however, this coupling is not retarded. This process would create a substantial attractive interaction among antinodal charges, which would lead to the opening of the “pseudo gap” [1].
As the energy scale is much higher than the mode energy of roton-analogue spin-charge modulations, the AF fluctuations in the above mentioned process are mostly high energy fluctuations near () well above the soft-mode energy. The resonant process would couple such high energy spin fluctuations with the partner charge fluctuation/motion near the zone center, having comparable energies. Increasing charge doping in HTSC would increase this charge energy scale . When exceeds the spin energy scale , as presumably happening in the overdoped region, the resonant coupling mechanism is lost. Charge doping in cuprates also weakens spin correlations via introduction of frustration. These features explain the loss of pairing, followed by emergence of “phantom superconductivity” in the overdoped region.
8 Difference between nodal and antinodal charges
In contrast to antinodal charges, nodal charges are moving on the same spin sublattice, as shown in Fig. 10(d). Therefore, nodal charges are not subject to spin frustration, regardless of how their energies compare with energies of AF fluctuations. This fundamental difference between the “spin-sensitive” antinodal and “spin-insensitive” nodal charges would explain why the ARPES Fermi-energy spectral weight [26] resides mainly in the nodal region in the underdoped cuprates having strong AF fluctuations. The antinodal charges dominate ARPES response in the overdoped region where AF correlations die away, and where the antinodal charges become “spin-insensitive”.
If one tries to show the spin and charge roton-like modes in a single-particle diagram of Fig. 11(b) and (c), the spin mode appears as connecting two nodal charges and the charge mode connecting two antinodal charges, analogous to nucleon binding via a Yukawa meson. In these diagrams, “vacuum” corresponds to the situation with dynamic spin/charge stripe correlations. Neutron scattering then liberates the S=1 AF magnon, while ARPES liberates the charge fluctuation, into such a “vacuum equivalent”, with the energy input corresponding to the condensation energy, as shown in Fig. 11(b) and (c). The intensity of these liberation processes should be proportional to the superfluid density, as was actually observed in neutron and ARPES measurements [16,23].
9 Phase fluctuations, roton-like excitations, and Nernst region
In purely 2-d systems, such as a thin film of superfluid He on regular or porous media, superfluidity is destroyed via liberation of vortex-antivortex pair at the Kosterlitz-Thouless (KT) transition temperature , where the superfluid density at follows the system-independent universal value given by the KT theory [27]. Since the roton energy scale is much higher than , the 2-d superfluid density in typical He films shows little temperature dependence at , as shown in Fig. 5(a) of ref. [1]. In He thin-films, “dynamic superfluidity” with dissociated vortices exists at = 3.2 K, as can be seen in the specific heat results.
In cuprate systems, with increasing temperature, the superfluid density is destroyed by the nodal pair-breaking excitations at low temperatures up to , presumably followed by the reduction due primarily to excitations of the twin spin-charge soft mode at . For the case of highly 2-d cuprates, such as Bi2212, the system undergoes the KT transition with sufficiently reduced superfluid density at [28]. In systems close to the magnetic states, such as the 214 systems near the 1/8 doping concentration, is determined by the soft mode energy, i.e., the closeness to the competing state. In either types of cuprates, the normal state above exhibits “dynamic superconductivity”, as was demonstrated by the observation of Nernst effect [29] shown in Fig. 12.

For bosonic systems where the pairing energy scale is higher than the number-density scale , we expect the Nernst region to extend up to . Indeed, the Nernst on-set temperature 130 K of 10% Sr doped LSCO system [29] (green star) lies very close the the line in Fig. 2 [1], and increases with increasing doping in the very underdoped region in Fig. 12, following the behavior of . The reduction of near the optimum doping region in Fig. 12 can be explained by the reduction of , which makes bosons unavailable. Thus, the Nernst effect occurs with two conditions: (1) availability of bosons, i.e., ; and (2) sufficient number density of bosons to build up local phase coherence, i.e. . The Nernst region above can be characterized by the existence of bosonic amplitude without static long-range phase coherence. If it were possible to remove factors which destroy long-range phase coherence, such as the soft mode and low dimensionality, cuprate systems would have acquired superconductivity at the Nernst onset temperature .
Since the soft-mode energy is related to condensation energy,
superfluid density influences the mode energy. However,
due to relevance of competing states,
at is no longer a sole factor in determining . This feature
is clearly seen for the case of 214 cuprates, which are
particularly close to the competing magnetic state,
having lower soft-mode energies, thus showing earlier
branching off from the linear relationship in Fig. 1,
compared to YBCO systems with comparable values of
.
In this way, superfluid density and the soft-mode energy
“conspire or cooperate” in determining .
Further studies of microscopic pairing mechanisms and
collective modes would hopefully clarify the origin of
apparently universal upperlimit of 1/4
common to various correlated electron superconductors
shown in Fig. 2.
This work has been supported by the NSF DMR-0102752, DMR-0502706, INT-0314058 and CHE-0111752 (Nanoscale Science and Engineering Initiative). The author thanks J.C. Davis, A. Damascelli, N. Nagaosa for useful discussions; G.M. Luke and S. Uchida for continuing collaboration; and T. Yamazaki for excellent guidance in the beginning of the author’s scientific career.
References
- [1] Y.J. Uemura, J. Phys. Condens. Matter 16 (2004) S4515.
- [2] Y.J. Uemura et al., Phys. Rev. Lett. 62 (1989) 2317.
- [3] B. Nachumi et al., Phys. Rev. Lett. 77 (1996) 5421.
- [4] K.M. Kojima et al., Physica B 36 (2003) 316.
- [5] Y.J. Uemura et al., Nature (London) 364 (1993) 605.
- [6] Y.J. Uemura, Solid State Commun. 120 (2001) 347.
- [7] Y.J. Uemura et al., Phys. Rev. Lett. 66 (1991) 2665.
- [8] Y.J. Uemura, in Polarons and Bipolarons in High-Tc Superconductors and Related Materials, ed. by E. Salje, A.S. Alexandrov and Y. Liang, Cambridge University Press (1995), p.p. 453.
- [9] Y.J. Uemura, in Proceedings of International Symposium/Workshop on High- Superconductivity and the C60 Family, May 1994, Beijing, ed. by H.C. Ren, Gordon and Breach (New York), (1995), p.p. 113.
- [10] Y.J. Uemura, Physica C282-287 (1997) 194.
- [11] J.C. Davis, private communications (2005).
- [12] Y.J. Uemura, Solid State Commun. 126 (2003) 23 ; erratum ibid 425.
- [13] D.G. Henshaw and A.D.B. Woods, Phys. Rev. 121 (1961) 1266.
- [14] D.G. Henshaw, Phys. Rev. 109 (1958) 328.
- [15] O.W. Dietrich et al., Phys. Rev. A5 (1972) 1377.
- [16] P. Bourges et al., Physica C424 (2005) 45.
- [17] Y. Gallais et al., Phys. Rev. Lett. 88 (2002) 177401.
- [18] J.M. Tranquada et al., Nature 375 (1995) 561.
- [19] N.B. Christensen et al., Phys. Rev. Lett. 93 (2004) 147002.
- [20] J.M. Tranquada et al., Nature 429 (2004) 534.
- [21] K. McElroy et al., Nature 422 (2003) 592.
- [22] M. Platé et al., Phys. Rev. Lett. 95 (2005) 077001.
- [23] A. Damascelli, Z. Hussain, Z.X. Shen, Rev. Mod. Phys. 75 (2003) 473 (see Fig. 50 at p. 513).
- [24] P.A. Lee and X.G. Weng, Phys. Rev. Lett. 78 (1997) 4111.
- [25] M.R. Norman and C. Pepin, Rep. Prog. Phys. 66 (2003) 1547.
- [26] T. Yoshida et al., Phys. Rev. Lett. 91 (2003) 027001.
- [27] J.M. Kosterlitz and D.J. Thouless, J. Phys. C: Solid State Phys. 6, (1973) 1181.
- [28] J. Corson et al., Nature (London) 398 (1999) 221.
- [29] Y. Wang et al., Phys. Rev. B64 (2001) 224519.
- [30] T. Timusk and B. Statt, Rep. Prog. Phys. 62 (1999) 61.