Apparent vibrational side-bands in -conjugated systems: the case of distyrylbenzene
Abstract
The photoluminescence (PL) spectra of dilute solution and single crystals of distyrylbenzene show unique temperature dependent vibronic structures. The characteristic single frequency progression at high temperatures is modulated by a low frequency progression series at low temperatures. None of the series side band modes corresponds to any of the distyrylbenzene Raman frequencies. We explain these PL properties using a time dependent model with temperature dependent damping, in which the many-mode system is effectively transformed to two- and then to a single ”apparent” mode as damping increases.
The excited state properties of distyrylbenzene (DSB), which is the three phenyl group oligomer analog of p-phenylene vinylene (Fig. Apparent vibrational side-bands in -conjugated systems: the case of distyrylbenzene, inset), have been the subject of recent experimental [1, 2] and theoretical [3] spectroscopic studies, because of potential opto-electronic applications [4]. DSB photoluminescence (PL) spectroscopy has been the subject of numerous research studies, since it is strongly dependent upon the packing order [3, 5, 6, 7]. In DSB films the molecules form H aggregates thus substantially weakening the emission quantum yield, relative to the separate oligomers in dilute solutions [5]. This is especially true in DSB single crystals: due to the herringbone symmetry, the fundamental optical transition (the so called ”0-0 transition”) is either totally absent or significantly reduced [3, 5]. Typical PL spectra of DSB chromophores contain vibronic progression series, of which the relative intensity and frequencies depend on packing and temperature. One key feature of the vibronic progression is that the side-band replicae have apparent frequencies that do not match any of the Raman active modes. This is true also for many other -conjugated polymers and oligomers: the rich Raman spectrum of the multi-vibrational modes systems is reduced to only one, or two apparent vibronic progression in their PL spectrum.
In this work we account for the apparent modes that appear in the PL spectra of DSB dilute solutions and single crystals; the same model may be used to explain the PL spectra of other -conjugated systems. We use the pre-resonance Raman spectrum in order to quantify the relative configuration displacement (or, equivalently, the Huang-Rhys (HR) factor) for each of the vibrational modes. Consequently, we utilize the relative HR factors in a damped time-dependent model to calculate the DSB PL spectrum. We found that above a certain finite damping, the PL vibronic progression contains only a single apparent vibronic frequency. For lower damping, however, the single frequency progression is modulated by a low frequency progression, in excellent agreement with the PL spectra measured at low temperatures.
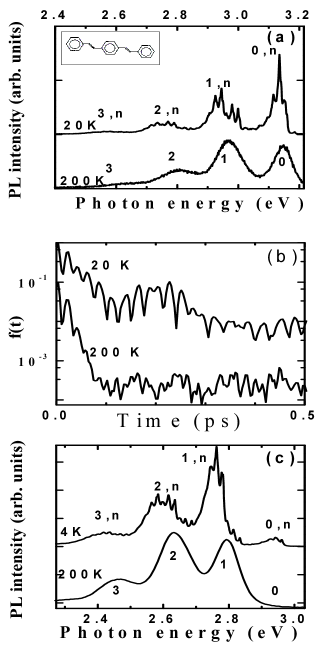
In Fig. Apparent vibrational side-bands in -conjugated systems: the case of distyrylbenzenea we show the PL spectra of DSB in dilute frozen solution of tetra-decane [6] at low and high temperatures. The PL spectrum at 200 K has the typical vibronic progression shape of other -conjugated systems, but notable changes occur with decreasing temperature. At 200 K (Fig. Apparent vibrational side-bands in -conjugated systems: the case of distyrylbenzenea, bottom curve), there appears a dominant ”high frequency” vibronic progression of 0.17 eV (1370 ), which, however, does not match any of the Raman modes (Fig. Apparent vibrational side-bands in -conjugated systems: the case of distyrylbenzene), and is not even in the vicinity of highly coupled modes (Table I). The highest energy peak (marked ”0”) is the fundamental optical transition (, at 3.15 eV), whereas the lower energy peaks (marked ”1,2,3”) are the higher order vibronic side bands. As the temperature is lowered, however, the high frequency progression is modulated (Fig. Apparent vibrational side-bands in -conjugated systems: the case of distyrylbenzenea, 20 K) by a different ”low frequency” progression of 17-19 meV. We denote this modulated vibronic structure by , (=0,1,2,3, =0,1,2,…), where () is the order of the high (low) frequency modulation. The appearance of these vibronic replicae is further illustrated in Fig. Apparent vibrational side-bands in -conjugated systems: the case of distyrylbenzeneb, where we show the PL Fourier transform, namely, . At 200 K, only highly damped short period (0.02 ps) oscillations are observed. At 20 K, on the contrary, there is considerably less damping and the short period oscillations pattern is modulated by a long period (0.22 ps) component.
The PL spectra of DSB single crystal at 4 K and 200 K are shown in Fig. Apparent vibrational side-bands in -conjugated systems: the case of distyrylbenzenec. The overall vibronic structure is very similar to that of the solution: a single frequency vibronic progression at 200 K is modulated by a much lower frequency at 4 K. The main difference between the solution and single crystal PL spectra is the intensity of the fundamental (”0”) transition: in DSB crystals it is unobservable at 200 K, gradually increasing as the temperature is lowered [7], reaching approximately 15% of its solution relative strength at 4 K. The suppressed strength of the ”0” transition is the result of the crystal symmetry [3].
When trying to account for the PL emission spectrum of a multi-vibrational system, such as DSB, in relation with its Raman spectrum, it is useful to employ time dependent analysis rather than the often used sum-over-states Franck-Condon approach [8]. In general, the emission spectrum ( is the photon energy) is given [9] by the Fourier transform of the time dependent auto-correlation function of the transition dipole moment, ,
| (1) |
Following Ref. [9], we write the correlation function for a multi-mode system in the harmonic approximation and linear electron-phonon coupling as:
| (2) |
where is the dipole matrix element for the relevant optical transition and is the bare optical transition energy. In Eq. (2), is the mode index, , where =1/[] is the mode occupation number at temperature T, =, and is its equilibrium (normal coordinate) displacement in the optically excited electronic state relative to the ground state. We emphasize here that it is the ”electron temperature”, , which determines the mode occupation, . is determined by the photon excitation energy and the electron excess energy relaxation rate and may be considerably higher than the lattice temperature, T. We identify with the system HR factor, which is the sum of the individual HR factors modified by the temperature (Eq. (2)). The time dependent term in Eq. (2) is responsible for the usual red shifted vibronic side bands in the PL spectrum, while gives rise to blue-shifted side bands (due to excited vibrational level occupation), emphasizing the low frequency modes at relatively high . In Eq. (2), a simple mode-independent phenomenological damping, 0, is introduced; it represents losses due to natural line broadening and/or other degrees of freedom [8]. Note that in Eq. (2) is a product of various periodical functions, , each with a different period and amplitude. Thus, the effect of finite damping is to limit the effective time domain in the integral (Eq. (1)), emphasizing partial periodic recurrences in that result in apparent vibronic frequencies in the PL spectrum. The apparent mode (APM) frequencies need not be equal to one of the observed Raman modes, but are related to them in a non-trivial way [10]. An example of this effect is shown in Fig. Apparent vibrational side-bands in -conjugated systems: the case of distyrylbenzenea, where , calculated using the 11-mode system of DSB given in Table I, is plotted on a logarithmic scale. It is clearly seen, that even for low damping (Fig. Apparent vibrational side-bands in -conjugated systems: the case of distyrylbenzenea, top) is dominated by two APMs: a high frequency (short period), APMH, modulated by a low frequency (long period), APML. The main effect of the damping is the faster decrease of the low frequency component (Fig. Apparent vibrational side-bands in -conjugated systems: the case of distyrylbenzenea, bottom).
The HR factors that determine the vibronic structure are closely related to the measured Raman spectrum, since the Raman process is enabled by the electron-phonon interaction. The T=0 intensity () of each Raman line measures its excited state displacement [8]: . We then have [9] and,
| (3) |
where is at T=0 K. We note that the factor in emphasizes the lower frequency Raman modes in the PL spectrum. This can be seen in Table I, where we list for DSB , calculated using Eq. (3) and the Raman data (Fig. Apparent vibrational side-bands in -conjugated systems: the case of distyrylbenzene): the lowest frequency mode has the largest HR factor, although its intensity is 1% of the strongest line! We conclude then: (1) The apparent modes are the result of a ”weighted beating” of all Raman frequencies. (2) The frequencies of the apparent modes are not, in general, the simple sum or difference of the Raman frequencies, and cannot therefore be predicted a priori. (3) The relative intensities of the apparent vibronic structure of the PL spectrum is solely determined by the experimentally measured pre-resonant Raman spectrum. (4) The only fitting parameters needed are the overall damping and the absolute magnitude of the total HR factor.
Table I. The most intense Raman lines of crystalline DSB at 10 K. , and , respectively, denote the measured peak frequency, relative integrated intensity and the calculated relative HR factor (Eq. (3), for each mode.

The first excited state of isolated DSB molecules is optically allowed, making them strongly luminescent and useable as active media in light emitting devices [4]. Typically, the PL spectrum of isolated DSB molecules consists of the fundamental (0-0) optical transition and a single frequency phonon side bands replica series. However, in DSB and other p-oligophenylene-vinylenes, as well as oligothiophens [2], in the form of solid films and crystals, the 0-0 band is strongly suppressed, whereas the phonon replicae retain their intensity and dominate the PL spectrum [5, 11]. The 0-0 PL band in films and crystals is forbidden due to Davidov splitting associated with H-aggregates. The 0-0 intensity depends on the film morphology (or aggregate size) and/or crystal purity. In an inhomogeneous solid sample, the resulting emission spectrum may be composed of contributions from several domains, with various 0-0 to 0-n intensity ratio. We therefore discuss separately the emission spectra of solution and crystalline DSB.
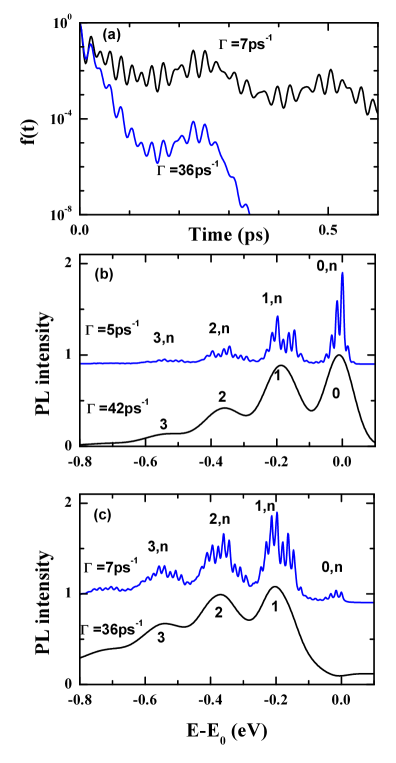
Using the data of Table I we show in Fig. Apparent vibrational side-bands in -conjugated systems: the case of distyrylbenzenea the dipole auto-correlation function, , generated for low and high damping. It is visually striking that the 11-mode system is dominated by only two APM: a short period mode modulated by a long period mode. Moreover, the frequency associated with these two APMs does not coincide with any DSB normal mode. The data given in Table I is also used to generate the PL spectra shown in Fig. Apparent vibrational side-bands in -conjugated systems: the case of distyrylbenzeneb. Here, the values of the electron temperature, , HR factor and damping were chosen to best fit the frozen solution experimental data at low and high lattice temperatures, T (Fig. Apparent vibrational side-bands in -conjugated systems: the case of distyrylbenzenea). The higher damping spectrum that presumably occurs at T=200 K (, Fig. Apparent vibrational side-bands in -conjugated systems: the case of distyrylbenzeneb) shows a vibronic progression dominated by a single frequency, APMH=173 meV (1400 cm-1). These progression peaks are marked as ”1,2,3”. This is in excellent agreement with the data at 200 K (Fig. Apparent vibrational side-bands in -conjugated systems: the case of distyrylbenzenea, bottom curve). For this case we chose , since the relevant modes are at high frequencies. At lower lattice temperatures we expect the damping to decrease. Consequently, the low frequency APM is less suppressed, making the PL spectrum sensitive to the actual value of . At low values, there appears a low frequency modulation (with APML17 meV) of the high frequency vibronic series, as seen in Fig. Apparent vibrational side-bands in -conjugated systems: the case of distyrylbenzeneb (top curve). The combined progression peaks are denoted as (k,n), where k=0,1,2,3 denotes the APMH progression and n=0,1,2… denotes the APML modulation of APMH. The PL spectrum in Fig. Apparent vibrational side-bands in -conjugated systems: the case of distyrylbenzeneb (top curve) was calculated using K; it shows two blue shifted peaks, in very good agreement with the experimental data at T=20 K (Fig. Apparent vibrational side-bands in -conjugated systems: the case of distyrylbenzenea, top curve). We thus conclude that due to the non-resonant PL excitation, .
The crystalline PL spectra show similar characteristics to the solution spectra; i.e., at high temperatures is dominated by a single APM, whereas at low temperatures this structure is modulated by a low frequency APM. As for the solution spectra, this behavior naturally results from a decreased damping at low temperatures. However, the crystalline spectra reveal an additional feature not observed in solutions.
It is seen in the PL spectra of crystalline DSB (Fig. Apparent vibrational side-bands in -conjugated systems: the case of distyrylbenzenec), that the band centered at 2.95 eV appears at T=4 K but not at T=200 K. Measurements at intermediate temperatures [7] reveal that its intensity monotonically decreases with increasing temperature; above T=150 K it cannot be observed any longer. We interpret this band as the fundamental optical transition that is suppressed by the crystal symmetry. However, the vibronic structure below 2.95 eV is not affected [3]. In order to quantitatively account for the temperature dependent crystalline PL spectra, we have allowed the ”0” transition to vary independently of all other phonon mediated transitions.
First, we recognize that the terms in Eq. (2) are responsible for all the red shifted spectral features associated with the electron-phonon interaction. The time independent term in Eq. (2) gives the intensity of the fundamental optical transition in the presence of the coupled vibrational modes. Second, assuming that the fundamental optical transition has a small finite width of , we calculate its intensity (denoted ) using Eq. (2) while taking into account only those modes whose frequency is smaller than . We then let to be partially suppressed, and write for the crystalline PL spectrum,
| (4) |
where is given by Eq. (1), and is the suppression parameter controlling in the crystalline spectrum. Using Eq. (4), the data of Table I, and =4 meV we show in Fig. Apparent vibrational side-bands in -conjugated systems: the case of distyrylbenzenec a high temperature (200K, =36 ps-1) PL spectrum with totally suppressed fundamental transition, namely =1. This is in excellent agreement with the T=200 K crystalline spectrum (Fig. Apparent vibrational side-bands in -conjugated systems: the case of distyrylbenzenec).
Allowing now for a non-zero intensity (1) together with a smaller , we can account for the finite intensity fundamental transition and the low frequency modulation of the high frequency APM observed in crystalline PL spectra at low temperatures. An illustrative example is shown in Fig. Apparent vibrational side-bands in -conjugated systems: the case of distyrylbenzenec for the T=4 K spectrum, where is 85% suppressed and APML17 meV; again, in very good agreement with the 4 K crystalline spectrum (Fig. Apparent vibrational side-bands in -conjugated systems: the case of distyrylbenzenec).
In summary, we showed that the apparent low frequency vibronic side band in the crystalline PL spectrum is inherent to the DSB chromophore; it is not related to the strength of , as previously suggested for oligothiophene crystals [2]. We interpret the blue shifted small peaks above the 0-0 transition, in the frozen solution spectrum, as due to a ”hot luminescence” process. Using a time dependent model with temperature dependent damping, we showed that the many-mode DSB system is effectively transformed into two- then to a single ”apparent” mode as damping increases. In general, increased damping in multi-vibrational mode -conjugated systems results in effective elimination of vibrational modes from the emission and absorption spectra and the eventual appearance of a nearly regularly spaced progression at an apparent frequency. Knowing the Raman spectrum, it is possible then to account in detail for the emission and absorption spectra of -conjugated systems.
Acknowledgments–Supported by DOE FG-02-04 ER46109 and Israel Science Foundation 735/04.
REFERENCES
- [1] I. Orion, J.P. Buisson, S. Lefrant, Phys. Rev. B57, 7050 (1998).
- [2] F. Meinardi et. al., Phys. Rev. B67, 184205 (2003).
- [3] F.C. Spano, J. Chem. Phys. 114, 5376 (2001); 116, 5877 (2002); 118, 981 (2003); 120, 7643 (2004).
- [4] G. Hadziioannou, in ”Semiconducting Polymers: Chemistry, Physics, and Engineering”, Eds. G. Hadziioannou, P. F. van Hutten, Wiley-VCH, New York (2000), Ch. 7.
- [5] D. Oelkrug et. al., Synth. Metals 76, 249 (1996); J. Phys. Chem. B 102, 1902 (1998); H.-J. Egelhaaf, J. Gierschner, D. Oelkrug, Synth. Metals 83, 221 (1996); J. Gierschner, H.-J. Egelhaaf, D. Oelkrug, Synth. Metals 84, 529 (1997).
- [6] J. Gierschner, H-G. Mack, L. Lüer, D. Oelkrug, J. Chem. Phys. 116, 8596 (2002).
- [7] C.C. Wu et. al, Synth. Metals 137, 939 (2003).
- [8] E.J. Heller, R.L. Sundberg, D. Tannor, J. Phys. Chem. 86, 1822 (1982).
- [9] S. Nakajima, Y. Toyozawa, R. Abe, ”The Physics of Elementary Excitations”, Springer Series in Solid State Sciences, Vol. 12, Springer Verlag, Berlin (1980).
- [10] Similar conclusions (limited though to T=0 K) were reached by L. Tutt, et. al., J. Chem. Phys. 87, 3017 (1983).
- [11] P.A. Lane et. al., Chem. Phys. 257, 41 (2000).