Phase transitions in Ni2+xMn1-xGa with a high Ni excess
Abstract
Ferromagnetic shape memory alloys Ni2+xMn1-xGa were studied in the range of compositions . The experimental phase diagram, constructed from differential scanning calorimetry, transport and magnetic measurements, exhibits distinctive feature in a compositional interval , where martensitic and magnetic transitions merge in a first-order magnetostructural phase transition ferromagnetic martensite paramagnetic austenite. Observed in this interval of compositions a nonmonotonous behavior of the magnetostructural phase transition temperature was ascribed to the difference in the exchange interactions of martensitic and austenitic phase and to the competition between increasing number of valence electron and progressive dilution of the magnetic subsystem which occur in the presence of a strong magnetoelastic interaction. Based on the experimental phase diagram, the difference between Curie temperature of martensite and Curie temperature of austenite was estimated. Influence of volume magnetostriction was considered in theoretical modeling in order to account for the existence of the magnetostructural phase transition over a wide range of compositions.
pacs:
64.70.Kb, 75.30.Cr, 75.50.CcI Introduction
In ferromagnetic shape memory alloys, structural (martensitic) transition from high-temperature austenitic phase to low-temperature martensitic phase takes place in ferromagnetically ordered state. Combination of ferromagnetic properties of the martensite and thermoelastic nature of the martensitic transformation allows realization of a principle for operation of shape and dimension in these materials. This can be achieved either through switching of martensitic domains 1-u ; 2-u or through the shift of martensitic transition temperature 3-c by a magnetic field.
Among a variety of ferromagnetic shape memory alloys 4-v ; 5-v (see also Refs. 6-o, ; 7-s, ), the largest magnetic field-induced strain has been observed in off-stoichiometric Ni-Mn-Ga single crystals. 8-s Observation of giant deformations induced by a magnetic field has stimulated intensive studies of magnetic and structural properties of Ni-Mn-Ga alloys. The results of these studies revealed a rich phase diagram of this Heusler system. In particular, stoichiometric or near-stoichiometric alloys undergo a first-order premartensitic phase transition, resulting in a modulation of the parent cubic structure. 9-z Besides, phase transitions between different crystallographic modifications of martensite can be induced in off-stoichiometric Ni-Mn-Ga alloys by a change of composition, temperature, or stress, or by the combination of these parameters. 10-v
Recent experimental studies revealed that along with the phenomenon of large magnetic-field-induced strains Ni-Mn-Ga alloys exhibit other properties of technological interest, specifically the large magnetocaloric effect. 11-h ; 12-h ; 13-m ; 14-t ; 15-m Magnetic entropy change comparable with that recorded in so-called giant magnetocaloric materials was observed at ambient temperatures in Ni-Mn-Ga characterized by a coupled magnetostructural phase transition. 16-p ; 17-a ; 18-a ; 19-z ; 19a-z It is notable that the giant magnetocaloric materials are also characterized by the simultaneously occurring magnetic and structural phase transitions. 20-p ; 21-w ; 22-t
Coupling of martensitic and magnetic transition temperatures, and , takes place in other ferromagnetic shape memory alloy systems, such as Co-Ni-X (X = Al, Ga) 22a-o ; 22b-o and Ni-Fe-Ga. 6-o ; 22c-o In Ni-Mn-Ga, this coupling seems to be common and occurs for different cross-sections of the ternary diagram. In Ni2+xMn1-xGa system, merging of and was found to occur in a Ni2.18Mn0.82Ga composition. 23-v This effect has also been observed in the alloys with substitution of Mn for Ga, 24-j Ni2Mn1+xGa1-x, and in the alloys where Ni atoms were partially substituted for Ga. 25-l Studies of Ni2+xMn1-xGa and Ni2Mn1+xGa1-x revealed similar tendency of to increase and to decrease with the deviation from stoichiometry. Increase of in these alloy systems is attributable to the increase in electron concentration , i.e., to the Hume-Rothery mechanism. Although first principles calculation of non-stoichiometric Ni2MnGa alloys indicated 26-m that substitution-induced change in electronic structure did not fall into a rigid band filling scenario, empirical dependence between electron concentration and martensitic transition temperature was found to hold for a large number of compositions, 27-c suggesting good applicability of the rigid band model. Decrease of observed in Ni2+xMn1-xGa and Ni2Mn1+xGa1-x has presumably different origin. Since in Ni-Mn-Ga alloys magnetic moment of is located on Mn atoms, lowering of in the Ni2+xMn1-xGa system can reasonably be explained as caused by the dilution of the magnetic subsystem. For the system with Mn excess, Ni2Mn1+xGa1-x, weakening of exchange interaction could be accounted for by antiferromagnetic coupling of excessive Mn atoms, 28-e although such a picture has to be verified experimentally yet. Systematic study of magnetic properties of Ni2+xMn1-xGa alloys 29-k showed that both the interatomic distances and the overlap of electronic orbitals play an important role in the change of exchange parameters at structural transition, and that the exchange interactions are stronger in the martensitic state.
The difference in Curie temperature of martensite and austenite 29-k leads to unusual magnetic properties of compounds with merged magnetic and structural transition temperature. Higher Curie temperature of martensite as compared to that of austenite and intrinsic thermal hysteresis of the martensitic transition results in a well-defined temperature hysteresis seen on temperature dependencies of magnetization in these alloys. 16-p ; 18-a ; 30-k Isothermal magnetization measurements of Ni2.19Mn0.81Ga revealed marked metamagnetic-like anomalies on field dependencies of the magnetization. 31-f They can be either reversible or irreversible, depending on the temperature of the measurements, and are caused by the field-induced transitions from paramagnetic austenite to ferromagnetic martensite.
So far, phase transitions in the Ni2+xMn1-xGa system were studied in the range of compositions . 16-p ; 17-a ; 18-a ; 23-v ; 29-k ; 30-k ; 31-f ; 31a-m ; 31b-k Studies of Ni2+xMn1-xGa alloys with a higher Ni excess are motivated by several reasons. First, it is likely that and are still merged in the alloys with . For better understanding of the phenomenon of coupled magnetostructural transition it is necessary to determine the complete composition interval where it is observed. Since such alloys show attractive magnetocaloric properties, 16-p ; 17-a ; 18-a ; 19-z ; 19a-z this information can also be of technological interest. Second, the phenomenological theory of phase transitions in Ni2+xMn1-xGa predicts 23-v ; 32-b that the magnetostructural transition is realized in interval; in the alloys with a higher Ni excess becomes higher than and the martensitic transformation takes place in paramagnetic state. Construction of the experimental phase diagram for the alloys with high Ni excess provides good opportunity for verification of this theoretical prediction. For this aim we studied Ni2+xMn1-xGa alloys characterized by the Ni excess .
II Sample preparation and measurements
Polycrystalline ingots with nominal compositions in the mentioned above range of were prepared by a conventional arc-melting method. Since the weight loss during arc-melting was small %) we assume that the real compositions correspond to the nominal ones. The ingots were annealed at 1100 K for 9 days and quenched in ice water. Metallographic studies revealed a single phase state in all the compositions except the alloy with the highest Ni excess, . For this composition, optical observation showed the presence of a secondary phase indicating that a phase segregation takes place for alloys with . Because of this, discussion of the experimental results obtained will be restricted for alloys with .
Samples for calorimetric, transport and magnetic measurements were cut from the middle part of the ingots. Characteristic temperatures of the direct and reverse martensitic transformations were determined from differential scanning calorimetry (DSC) measurements, performed with a heating/cooling rate 5 K/min. Curie temperature was determined from temperature dependencies of magnetization, , measured by a vibrating sample magnetometer in a magnetic field T with a heating/cooling rate 2 K/min. For the compositions which exhibit first order magnetic phase transition, was determined as an average between values observed at heating and cooling. Isothermal magnetization was measured at liquid helium temperature in magnetic fields up to 5 T by a Quantum Design superconducting quantum interference device (SQUID) magnetometer. Magnetization saturation was determined by a linear extrapolation of dependencies from the high fields. Measurements of the thermal expansion coefficient were performed by a strain gage technique. A strain gage was glued to the carefully polished flat surface of sample. The measurements were done in a temperature interval from 300 to 380 K with a heating rate 1 K/min.
III Experimental results
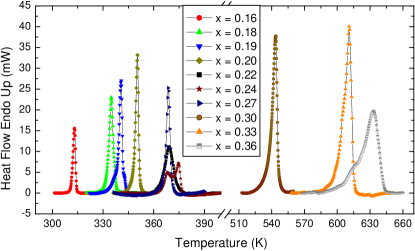
DSC measurements provide simple and effective tool to detect martensitic transformations. Well-defined peaks seen on cooling and heating DSC curves correspond to direct and reverse martensitic transformation, respectively. Direct martensitic transformation is characterized by martensite start () and martensite finish () temperatures. Accordingly, reverse martensitic transformation can be characterized by austenite start () and austenite finish () temperatures. As an example of these measurements, DSC heating scans for the alloys from studied compositional interval are shown in Fig. 1. Complex transformation behavior observed in , and, especially, in samples is presumably caused by the coexisting martensitic phases which transform to the austenitic state at slightly different temperatures. Describing experimental results, we will use the thermodynamic equilibrium temperature of martensitic transformation, , determined as (Ref. 33-t, ).
Our DSC measurements revealed general tendency of the martensitic transformation temperature to increase with Ni excess which is caused by the increase in the number of valence electrons. The increase of is, however, non-monotonous. In a compositional interval the martensitic transformation temperature increases from K to K . Further modification of from to has no essential effect on which remains essentially constant, K, in this compositional interval. A jump-like increase of the transformation temperature is observed as the composition changes from to . In the compositions with the martensitic transformation takes place at temperatures above 600 K (Fig. 1).
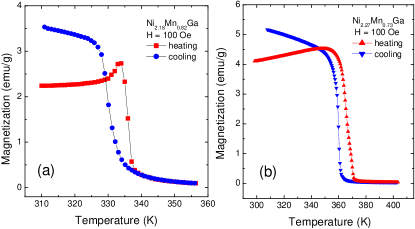
Since previous studies of Ni2+xMn1-xGa 23-v ; 29-k showed that the martensitic and ferromagnetic transition temperatures merge in the composition, the observed non-monotonous behavior of (Fig. 1) could be related to the coupling of martensitic and ferromagnetic transitions. For the alloys studied, Curie temperature was determined as a minimum on the temperature derivative of the magnetization curve, , measured in a field of 0.01 T. Results of these measurements revealed that in the interval of compositions . Moreover, in these alloys exhibits pronounced hysteretic feature as is shown in Fig. 2 for the case of end members of this compositional interval. Because of the temperature hysteresis, of these compounds was determined as the average between values measured at heating and cooling.
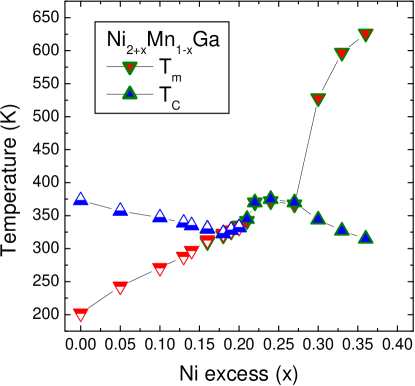
The phase diagram of Ni2+xMn1-xGa in the studied compositional interval, constructed from the DSC and magnetization measurements, is shown in Fig. 3. Three different regions can be distinguished on this phase diagram. The first region is characterized by the Ni excess . In this region and the martensitic transformation takes place when in the ferromagnetic state. Alloys from the second region with the Ni excess are characterized by a coupled magnetostructural transition, i.e., . Ferromagnetic transition in this compositional interval has a characteristic of a first-order phase transition, showing pronounced hysteresis on temperature and field dependencies of magnetization, and . 30-k ; 31-f Such unusual magnetic properties of these alloys have been attributed to simultaneously occurring martensitic and ferromagnetic transitions. 4-v ; 30-k Finally, the third region is characterized by a high martensitic transformation temperature, K, and a low Curie temperature, K. In this region, with the Ni excess , the martensitic transformation takes place when in the paramagnetic state. The occurrence of martensitic transformation at high temperatures makes alloys from this region attractive for application as high-temperature shape memory alloys.
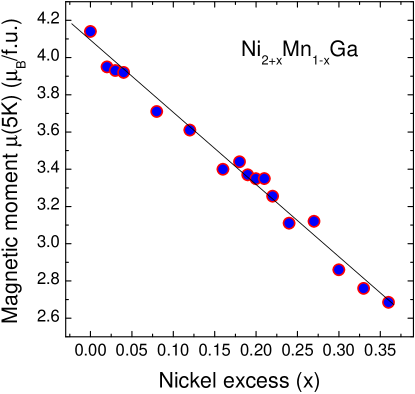
Since substitution of Ni for Mn results in the dilution of the magnetic subsystem, the observed increase of in the alloys manifests a strong interrelation between magnetic and structural subsystems in Ni2+xMn1-xGa. In order to check whether magnetic moment has an anomalous compositional dependence in this range of , field dependencies of magnetization were measured at 5 K. Along with Ni2+xMn1-xGa , was also measured on used in the previous studies 23-v ; 29-k samples with a smaller deviation from stoichiometry and for the stoichiometric Ni2MnGa. Calculated from these measurements magnetic moment per formula unit as a function of Ni excess is shown in Fig. 4. The results obtained indicate that within the experimental error the magnetic moment decreases approximately linearly upon substitution of Mn for Ni in the interval of compositions .
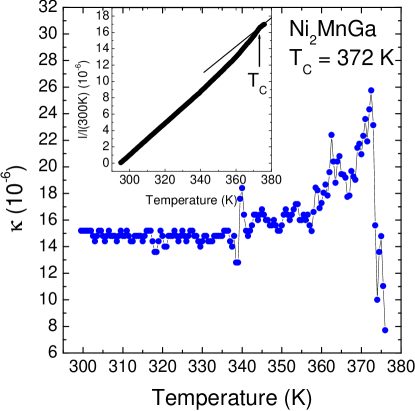
The result on the thermal expansion measurement is shown in the inset of Fig. 5. As the temperature is lowered through the Curie temperature, a small drop in the volume of the specimen is observed indicating that the exchange striction in Ni2MnGa is negative. Similar behavior has been found in other Mn-containing Heusler alloys. 33a-c Temperature dependence of the thermal expansion coefficient , determined from this measurement, is shown in Fig. 5. A noticeable increase in is observed at temperatures above 340 K. exhibits a jump-like drop at Curie temperature K, when the sample transforms to the paramagnetic state.
IV Influence of volume magnetostriction on the phase diagram of Ni2+xMn1-xGa alloys
The influence of anisotropic magnetostriction on structural phase transitions in cubic ferromagnets was theoretically studied in several works (see Ref. 4-v, , and references therein). Taking into consideration the magnetoelastic interactions, it was found that a coupled magnetic and structural (magnetostructural) phase transition exists on the phase diagram of Ni2+xMn1-xGa alloys. Theoretical calculations of the phase diagram revealed, however, that the magnetostructural transition is realized in rather a narrow concentration interval. Contrary to this, the experimental phase diagram reported in this work evidences that and are merged in a considerable interval of compositions, from to (Fig. 3). Since such alloys undergo a transformation from paramagnetic austenite to ferromagnetic martensite, it can be suggested that the influence of the anisotropic magnetostriction can be neglected in the composition interval where the magnetostructural phase transition is realized. Instead, contribution from the volume magnetostriction, which is usually large in the vicinity of magnetic phase transitions, should be considered when describing phase transitions in the framework of Landau’s theory.
For description of a phase transition from cubic paramagnetic to cubic ferromagnetic phase let us consider a Ginzburg-Landau functional containing order parameters responsible for structural and magnetic phase transitions and for the volume change at temperatures close to Curie temperature 34-f ; 35-i
| (1) |
Here are the linear combinations of the deformation tensor components, , , ; is a coefficient proportional to the thermal expansion coefficient, is the bulk modulus, , , , are the linear combinations of second-, third-, and fourth-order elastic moduli, respectively, , , , ; is the magnetization vector ( is the magnetization saturation), is the volume (exchange) magnetostriction constant, is the first cubic anisotropy constant, and are the exchange constants, and is the hydrostatic pressure.
Minimization of Eq. (1) with respect to leads to the following result:
| (2) |
After substitution of Eq. (2) into Eq. (1) the expression for the free energy of ferromagnet is
| (3) |
where
| (4) |
As evident from Eq. (4), coefficient is proportional to the volume magnetostriction constant . For the sake of definiteness we assume in further discussion that , the generalized third- and fourth-order elastic moduli , the magnetic anisotropy constant , and the exchange constant .
Minimization of Eq. (3) with respect to and leads to the following equilibrium phases of the ferromagnet.
(I) Cubic paramagnetic phase (PC)
| (5) |
is stable at , .
(II) Tetragonal paramagnetic phase (PT)
| (6) |
is stable at
| (7) |
(III) Cubic ferromagnetic phase (FC) with magnetization vector along [001]
| (8) |
is stable at
| (9) |
(IV) Tetragonal collinear ferromagnetic phase (FT) with magnetization vector along [001] axis
| (10) |
and deformations
| (11) |
is stable at
| (12) |
It follows from the symmetry consideration that, beside these states, others equilibrium phases having the same energy and areas of stability can be realized in the ferromagnet. These are tetragonal paramagnetic phases with deformations along [100] and [010] axes, ferromagnetic cubic phases with magnetization vectors along [100] and [010] axes, and tetragonal phases with deformations and magnetization vectors along [100] and [010] axes.
The lines of the phase transitions between states (I)-(IV) can be found from the conditions of the phase equilibria. They are determined by the following expressions
| (13) |
On the diagram, the coordinates of starting and ending points of magnetostructural phase transition are
| (14) |
In order to compare the results of the calculations with the experimental data, the phase diagram can be represented in coordinates. Let us assume that . According to the Ginzburg-Landau theory, in the vicinity of Curie point the exchange parameter can be represented as
| (15) |
In the vicinity of structural phase transition point the generalized second-order elastic modulus can be presented as
| (16) |
In Eqs. (15) and (16) we assume simple linear compositional dependencies of and temperatures 23-v
| (17) |
where and are temperatures of ferromagnetic and martensitic phase transitions for the stoichiometric composition, and are coefficients determined from the experiments. Substitution of Eqs. (15)-(17) into expression for the coordinates of the critical points S and E (14) gives coordinates of those points on the phase diagram
| (18) |
The lines of phase transitions (13) between states (I)-(IV) in the coordinates will be as follows
| (19) |
The expressions for the lines of phase transitions and are written in the first linear approximation relatively to temperature and composition. The values of and were estimated by numerical calculations from Eq. 13 (see below). Line is the line of coupled magnetostructural phase transition with .
To construct the phase diagram we need to determine the value of magnetostriction constants and . For this aim we shall consider the phase transition line .
It follows from Eqs. (5) and (8) that in cubic paramagnetic phase and in cubic ferromagnetic phase. In the vicinity of ferromagnetic phase transition, constant can be written as , 34-f where is the thermal expansion coefficient in paramagnetic phase. In this case, constant from Eq. (4) can be represented as
| (20) |
and, therefore,
| (21) |
Using expressions for and from Eqs. (2), (5), and (8) and assuming that we can obtain from Eq. (3) the thermal expansion coefficient in paramagnetic and ferromagnetic phases, and :
| (22) |
| (23) |
The jump of thermal expansion coefficient at Curie point is
| (24) |
Experimentally measured thermal expansion coefficient of Ni2MnGa (Fig. 5) indicates that K-1 at K. Using reported in Ref. 36-m, experimental values of elastic moduli GPa, GPa and considering that at and magnetization module (i.e., ), the volume magnetostriction is
| (25) |
Considering the definition of the parameter [(Eq. 4)] and assuming that the ratio in Ni2MnGa is similar to that in Cu-based shape memory alloys, 36a-g ; 36b-g , we obtain that erg/cm3.
To construct the phase diagram we use the following values for the remaining parameters: erg/cm3, erg/cm3, erg/cm3, erg/cm3, erg/cm3; for : K, K, K, K; for : K, K, K, and K. For the given values of the parameters, empirical expressions for the lines of phase transitions are
Theoretically constructed phase diagram is shown in Fig. 6. Note that a strong deviation from linear dependencies of the phase transition line is observed on the experimental phase diagram for the compositions near . Because of this, the line of this transition is shown in Fig. 6 schematically. The theoretically constructed phase diagram presented in Fig. 6 is in a qualitative agreement with the experimental one (Fig. 3).

For the indicated values of the parameters and Eq. (18) follows that the compositional interval of the magnetostructural phase transition is
V Discussion
The most interesting feature of the experimental phase diagram is the coupling of martensitic and ferromagnetic transitions in rather a wide composition interval, from to . Moreover, the coupled magnetostructural phase transition exhibits a non-monotonous dependence on the Ni excess (Fig. 3). Decoupling of and in is accompanied by a jump-like increase in the martensitic transformation temperature followed by its rapid growth with further deviation from stoichiometry, while Curie temperature exhibits an ordinary decrease. These peculiarities of the phase diagram of Ni2+xMn1-xGa can be explained as follow.
It is well documented in the literature that the compositional dependence of the martensitic transition temperature in Ni-Mn-Ga alloys is related to the valence electron concentration , i.e., can be attributed to the Hume-Rothery mechanism. 27-c The martensitic transition takes place when the contact between the Fermi surface and Brillouin zone boundary occurs. 37-w Such a scenario implies that the change in the number of valence electrons and the alteration of Brillouine zone boundary are primary driving forces for the occurrence of structural instability in these alloys. Neglecting hybridization effects and other factors such as electronegativity difference, 37a-w one can expect to detect a linear change of with composition due to a monotonous change in the number of valence electrons and in the chemical pressure, which has indeed been observed in limited composition intervals of Ni2+xMn1-xGa, 23-v Ni2+xMnGa1-x, 25-l and Ni2Mn1+xGa1-x 24-j systems. However, this picture will be no longer valid when approaching Curie point, because volume magnetostriction considerably affects crystal lattice parameters. In this sense the peak of the thermal expansion coefficient observed at Curie point (Fig. 5) can be regarded as a potential barrier for the increase of which is ”blocked” at the temperature of this peak. Further change of martensitic transition temperature will correlate with the change in Curie temperature , i.e., and will be coupled within some compositional interval. To decouple these phase transitions, it is necessary to reach an value sufficient for overcoming the barrier caused by the volume magnetostriction.
Rather a wide compositional interval of Ni2+xMn1-xGa where and are coupled (Fig. 3) can also be conditioned by the fact that upon this substitution the conduction electron density changes more slowly as compared to the substitution of Ni for Ga or Mn for Ga. Since the increase in the number of valence electrons is larger in the case of substitution of Ni for Ga, the compositional interval of coupled magnetostructural phase transition should be narrower in Ni2+xMnGa1-x as compared to Ni2+xMn1-xGa. It is also worth noting that the chemical pressure which also can influence the width of the compositional interval with merged and has different sign in these two systems (positive in the case of substitution of Ni for Ga and negative when substituting Ni for Mn).
Coupling of magnetic and martensitic transitions leads to an unusual behavior of the magnetic transition temperature. Despite of progressive dilution of the magnetic subsystem occurring upon substitution of Ni for Mn, the decrease of Curie temperature in is followed by its increase in the interval , then becomes independent of composition for . The expected decrease of is observed only for , where is considerably higher then .
The growth of observed in the interval is caused by the fact that the exchange interactions in the martensitic phase is stronger than in the austenitic phase. 29-k ; 38-c This is supported circumstantially by the results of measurements performed at liquid helium temperature (Fig. 4). These measurements indicated that the magnetic moment exhibits approximately linear decrease upon substitution of Ni for Mn; no anomalous behavior is observed in the interval of compositions . Thus, it can be suggested that for Ni2.18Mn0.82Ga corresponds to Curie temperature of austenite , whereas for Ni2.22Mn0.78Ga corresponds to Curie temperature of martensite . Almost constant temperature of the magnetostructural transition, K, observed in the alloys, is probably caused by a competition between increasing electron population and further dilution of the magnetic subsystem occurring in the presence of the strong magnetoelastic interaction.
Assuming that virtual Curie temperature of the austenitic phase (compositions with ) decreases linearly in the same manner as does in the compositional interval , we can estimate the difference between Curie temperatures of austenite and martensite. It follows from our data (Fig. 3) that it can be calculated as a difference between for the composition and the virtual austenitic Curie temperature for this composition, = 370 K – 316 K = 54 K. This value is in good agreement with that estimated from the comparison of reduced magnetization of austenitic and martensitic phases. 29-k Slightly smaller difference between and , K, is obtained when using compositional dependence of the martensitic Curie temperature estimated from the data for . This can be caused by the fact that for the compositions the effect of disordering on was not taken into consideration.
In a critical composition , and are no longer coupled, which results in a drastic increase of the martensitic transformation temperature above 500 K. With further increase in the Ni excess, rapidly grows and in Ni2.36Mn0.64Ga the martensitic transformation occurs at temperatures above 600 K. As evident from our phase diagram (Fig. 3) and from the data summarized for a large number of Ni-Mn-Ga compositions, 27-c compositional dependence of differs in the ferromagnetic and the paramagnetic states. This fact can be related to the difference in the electronic structure of these phases. Indeed, first principle calculations 39-f have revealed sharp distinctions between density of states of ferromagnetic and paramagnetic phases. Specifically, in the ferromagnetic state the Fermi energy passes through a peak of Ni -states, whereas Fermi level of the paramagnetic state is located at a high peak of Mn -states. Although calculations of the electronic structure of paramagnetic tetragonal phase 39-f did not support scenario of a band Jahn-Teller effect as a driving force for the martensitic phase transition, it is necessary to stress that the martensitic transition takes place in paramagnetic state only in the alloys with a large deviation from stoichiometry, whereas the first principle calculations were performed for stoichiometric Ni2MnGa composition.
As compared to the theoretical analysis of phase transitions presented in Ref. 23-v, , the theoretical approach adopted in this work differs in several aspects. It is well known that anisotropic magnetostriction tends to zero in the vicinity of Curie point ; it is also rather small even below as compared to the volume magnetostriction at temperatures near . Fradkin showed 34-f that the volume magnetostriction has an influence on magnetostructural phase transition only if one considers a term connecting order parameter , responsible for a volume change at phase transition, with order parameters and , responsible for symmetry changes at phase transitions. Although volume magnetostriction was considered in Ref. 23-v, in the Landau functional, the term connecting and , order parameters was not taken into account. Because of this, the role of the volume magnetostriction came to a renormalization of the exchange constant and, thus, the interaction between magnetic and structural subsystems was accounted for by the anisotropic magnetostriction only. As a consequence, the theoretical phase diagram 23-v did not account accurately the width of the composition interval with coupled magnetostructural phase transition. Other relevant difference between theoretical analysis of the present work and that given in Ref. 23-v, concerns areas of stability of the phases. Conditions for the phase equilibrium are different due to the fact that in Ref. 23-v, the first cubic anisotropy constant was assumed to be negative (), whereas subsequent experimental results 40-t showed that in fact it is positive ().
Present theoretical study, which assumes a linear decrease of Curie temperature due to the dilution of the magnetic subsystem and a linear increase of martensitic transition due to the increase in electron concentration, showed fair agreement with the experiment for the regions of the phase diagram where and are decoupled. As for the region characterized by the coupled magnetostructural phase transition, the applicability of the theory is limited due to the following reasons. Although consideration of the volume magnetostriction is shown to be useful for describing the width of composition interval of magnetostructural phase transition, just the volume magnetostriction is responsible for the deviation from a linear increase of the magnetostructural transition temperature in . It had been suggested in the above discussion that despite increasing number of valence electrons does not increase due to the influence of volume magnetostriction. Magnetic transition, it its turn, will remain coupled to the structural transition until temperature will not exceed the Curie temperature of martensite . Thus, the behavior of magnetostructural transition temperature in can be understood as a delicate balance between the change of Brillouine zone boundary caused by the volume magnetostriction and an increase in valence electron concentration occurring upon substitution of Ni for Mn, i.e., by the microscopic arguments which can not be accounted in the phenomenological approach.
Strictly speaking, the agreement between theoretical and experimental phase diagram in the interval of compositions is essentially due to the fact that exchange interactions are stronger in the martensitic phase than in the austenitic phase, which leads to the increase of magnetostructural transition temperature up to . In the opposite case of (experimentally observed in a Ni-Mn-Sn system 51-k ) no increase in the magnetostructural transition temperature should be observed.
VI Conclusion
We investigated, experimentally and theoretically, phase diagram of ferromagnetic shape memory alloys Ni2+xMn1-xGa in the range of up to 0.36. Peculiar feature of the phase diagram was found in a compositional interval . For these alloys, martensitic and ferromagnetic transitions are merged in a coupled magnetostructural phase transition from ferromagnetic austenite to paramagnetic martensite. Due to the difference in Curie temperatures of austenite and martensite, the temperature of this phase transition has a non-monotonous dependence on Ni excess , whereas magnetic moment per formula unit exhibits an ordinary decrease with the dilution of the Mn magnetic subsystem. The extended compositional interval of merged and is suggested to be due to the influence of volume magnetostriction. The difference in Curie temperatures of martensitic and austenitic phases estimated from the experimental phase diagram is K, which is in good agreement with the value obtained from the comparison of reduced magnetization of austenitic and martensitic phases. 29-k
In the alloys with , and are no longer coupled, and the martensitic transformation takes place at temperatures above 500 K. Since such materials are important for high-temperature shape memory alloys, it can be suggested that in the alloys further increase in the martensitic transformation temperature can be attained by the substitution of Ga for Ni or for Mn.
Acknowledgments
This work was partially supported by Russian Foundation for Basic Research (Grants Nos. 03-02-17443, 04-02-81058, and 03-02-39006), by the RFBR–JSPS joint project No. 05-02-19935 and by RF and CRDF, post-doctoral grant Y2-P-05-19.
References
- (1) K. Ullakko, J. K. Huang, C. Kantner, R. C. O’Handley, and V. V. Kokorin, Appl. Phys. Lett. 69, 1966 (1996).
- (2) K. Ullakko, J. K. Huang, V. V. Kokorin, and R. C. O’Handley, Scripta Mater. 36, 1133 (1997).
- (3) A. A. Cherechukin, I. E. Dikshtein, D. I. Ermakov, A. V. Glebov, V. V. Koledov, D. A. Kosolapov, V. G. Shavrov, A. A. Tulaikova, E. P. Krasnoperov, and T. Takagi, Phys. Lett. A 291, 175 (2001).
- (4) A. N. Vasil’ev, V. D. Buchelnikov, T. Takagi, V. V. Khovailo, and E. I. Estrin, Uspekhi Fiz. Nauk 173, 577 (2003) [Physics - Uspekhi 46, 559 (2003)].
- (5) A. Vasil’ev and T. Takagi, Int. J. Appl. Electromagn. Mech. 20, 37 (2004).
- (6) K. Oikawa, T. Ota, T. Ohmori, Y. Tanaka, H. Morito, A. Fujita, R. Kainuma, K. Fukamichi, and K. Ishida, Appl. Phys. Lett. 81, 5201 (2002).
- (7) Y. Sutou, Y. Imano, N. Koeda, T. Omori, R. Kainuma, K. Ishida, and K. Oikawa, Appl. Phys. Lett. 85, 4358 (2004).
- (8) A. Sozinov, A. A. Likhachev, N. Lanska, and K. Ullakko, Appl. Phys. Lett. 80, 1746 (2002).
- (9) A. Zheludev, S. M. Shapiro, P. Wochner, A. Schwartz, M. Wall, and L. E. Tanner, Phys. Rev. B 51, 11310 (1995).
- (10) A. N. Vasil’ev, A. R. Keiper, V. V. Kokorin, V. A. Chernenko, T. Takagi, and J. Tani, Int. J. Appl. Electromag. Mater. 5, 163 (1994).
- (11) F. Hu, B. Shen, and J. Sun, Appl. Phys. Lett. 76, 3460 (2000).
- (12) F. Hu, B. Shen, J. Sun, and G. Wu, Phys. Rev. B 64, 132412 (2001).
- (13) J. Marcos, A. Planes, L. Mañosa, F. Casanova, X. Batlle, A. Labarta, and B. Martínez, Phys. Rev. B 66, 224413 (2002).
- (14) O. Tegus, E. Brück, L. Zhang, Dagula, K. H. J. Buschow, and F. R. de Boer, Physica B 319, 174 (2002).
- (15) J. Marcos, L. Mañosa, A. Planes, F. Casanova, X. Batlle, and A. Labarta, Phys. Rev. B 68, 094401 (2003).
- (16) L. Pareti, M. Solzi, F. Albertini, and A. Paoluzi, Eur. Phys. J. B 32, 303 (2003).
- (17) A. Aliev, A. Batdalov, S. Bosko, V. Buchelnikov, I. Dikshtein, V. Khovailo, V. Koledov, R. Levitin, V. Shavrov, and T. Takagi, J. Magn. Magn. Mater. 272-276, 2040 (2004).
- (18) F. Albertini, F. Canepa, S. Cirafici, E. A. Franceschi, M. Napoletano, A. Paoluzi, L. Pareti, and M. Solzi, J. Magn. Magn. Mater. 272-276, 2111 (2004).
- (19) X. Zhou, W. Li, H. P. Kunkel, and G. Williams, J. Phys.: Condens. Matter 16, L39 (2004).
- (20) X. Zhou, W. Li, H. P. Kunkel, and G. Williams, J. Magn. Magn. Mater. 293 854 (2005).
- (21) V. K. Pecharsky and K. A. Gschneidner, Jr., Phys. Rev. Lett. 78, 4494 (1997).
- (22) H. Wada and Y. Tanabe, Appl. Phys. Lett. 79, 3302 (2001).
- (23) O. Tegus, E. Brück, K. H. J. Buschow, and F. R. de Boer, Nature 415, 150 (2002).
- (24) K. Oikawa, T. Ota, F. Gejima, T. Ohmori, R. Kainuma, and K. Ishida, Mater. Trans. 42, 2472 (2001).
- (25) K. Oikawa, L. Wulff, T. Iijima, F. Gejima, T. Ohmori, A. Fujita, K. Fukamichi, R. Kainuma, and K. Ishida, Appl. Phys. Lett. 79, 3290 (2001).
- (26) K. Oikawa, T. Ota, Y. Sutou, T. Ohmori, R. Kainuma, and K. Ishida, Mater. Trans. 43, 2360 (2002).
- (27) A. N. Vasil’ev, A. D. Bozhko, V. V. Khovailo, I. E. Dikshtein, V. G. Shavrov, V. D. Buchelnikov, M. Matsumoto, S. Suzuki, T. Takagi, and J. Tani, Phys. Rev. B 59, 1113 (1999).
- (28) C. Jiang, Y. Muhammad, L. Deng, W. Wu, and H. Xu, Acta Mater. 52, 2779 (2004).
- (29) N. Lanska, O. Söderberg, A. Sozinov, Y. Ge, K. Ullakko, and V. K. Lindroos, J. Appl. Phys. 95, 8074 (2004).
- (30) J. M. MacLaren, J. Appl. Phys. 91, 7801 (2002).
- (31) V. A. Chernenko, Scripta Mater. 40, 523 (1999).
- (32) J. Enkovaara, O. Heczko, A. Ayuela and R. M. Nieminen, Phys. Rev. B 67, 212405 (2003).
- (33) V. V. Khovailo, V. Novosad, T. Takagi, D. A. Filippov, R. Z. Levitin, and A. N. Vasil’ev, Phys. Rev. B 70, 174413 (2004).
- (34) V. V. Khovailo, T. Takagi, J. Tani, R. Z. Levitin, A. A. Cherechukin, M. Matsumoto, and R. Note, Phys. Rev. B 65, 092410 (2002).
- (35) D. A. Filippov, V. V. Khovailo, V. V. Koledov, E. P. Krasnoperov, R. Z. Levitin, V. G. Shavrov, and T. Takagi, J. Magn. Magn. Mater. 258, 507 (2003).
- (36) M. Matsumoto, M. Ebisuya, T. Kanomata, R. Note, H. Yoshida, and T. Kaneko, J. Magn. Magn. Mater. 239, 521 (2002).
- (37) J. Kamarád, F. Albertini, Z. Arnold, F. Casoli, L. Pareti, and A. Paoluzi, J. Magn. Magn. Mater. 290-291, 669 (2005).
- (38) V. Buchelnikov, A. Zayak, A. Vasil’ev, and T. Takagi, Int. J. Appl. Electromagn. Mech. 12, 19 (2000).
- (39) H. C. Tong and C. M. Wayman, Acta Metall. 22, 887 (1974).
- (40) I. A. Campbell and G. Creuzet, in Metallic Magnetism (Ed. H. Capellmann), (Topic in Current Physics, v. 42, p. 207) (Springer-Verlag Berlin Heidelberg, 1987).
- (41) M. A. Fradkin, Phys. Rev. B 50, 16326 (1994).
- (42) Yu. A. Izyumov and V. N. Syromyatnikov, Phase transitions and crystal symmetry (Kluwer Academic Pub., Netherlands 1990).
- (43) L. Mañosa, A. Gonzàlez-Comas, E. Obradó, A. Planes, V. A. Chernenko, V. V. Kokorin, and E. Cesari, Phys. Rev. B 55, 11068 (1997).
- (44) A. Gonzàlez-Comas, L. Mañosa, M. Cankurtaran, G. A. Saunders, and F. C. Lovey, J. Phys.: Condens. Matter 10, 9737 (1998).
- (45) A. Gonzàlez-Comas, L. Mañosa, A. Planes, and M. Morin, Phys. Rev. B 59, 246 (1999).
- (46) P. J. Webster, K. R. A. Ziebeck, S. L. Town, and M. S. Peak, Philos. Mag. B 49, 295 (1984).
- (47) R. E. Watson and M. Weinert, in Solid State Physics, v. 56, p. 1 (Academic Press, 2001).
- (48) V. A. Chernenko, V. A. L’vov, S. P. Zagorodnyuk, and T. Takagi, Phys. Rev. B 67, 064407 (2003).
- (49) S. Fujii, S. Ishida, and S. Asano, J. Phys. Soc. Jpn. 58, 3657 (1989).
- (50) R. Tickle and R. D. James, J. Magn. Magn. Mater. 195, 627 (1999).
- (51) T. Krenke, M. Acet, E. F. Wassermann, X. Moya, L. Mañosa, and A. Planes, Phys. Rev. B 72, 014412 (2005).