The role of stationarity in magnetic crackling noise
Abstract
We discuss the effect of the stationarity on the avalanche statistics of Barkhuasen noise signals. We perform experimental measurements on a Fe85B15 amorphous ribbon and compare the avalanche distributions measured around the coercive field, where the signal is stationary, with those sampled through the entire hysteresis loop. In the first case, we recover the scaling exponents commonly observed in other amorphous materials (, ). while in the second the exponents are significantly larger (, ). We provide a quantitative explanation of the experimental results through a model for the depinning of a ferromagnetic domain wall. The present analysis shed light on the unusually high values for the Barkhausen noise exponents measured by Spasojevic et al. [Phys. Rev. E 54 2531 (1996)].
Keywords: Barkhausen noise (Experiments), Barkhausen noise (Theory)
1 Introduction
Crackling noise is the typical response of many complex systems displaying avalanche dynamics [1]. When perturbed by a slow varying external force or field, these systems respond with impulsive events which span a broad range of sizes. This noise occurs in micro- and meso-scopic systems such as superconductors, ferromagnets, charge density waves, fluids in porous media, fracture, or plasticity, but also on large-scales, as in the tectonic motion of faults responsible of earthquakes.
The existence of a such a wide class of phenomena displaying similar noise features could imply that some general aspects of the dynamics should always be present, irrespective of the microscopic details of the system. One possible explanation is that all these systems are in the proximity of some non-equilibrium critical point and for this reason they display power law distributions over several decades, together with -type noise. To understand this behavior, statistical mechanics models have been proposed. In some case, these are able to predict the values of the critical exponents and provide important tools to analyze and interpret the experimental data [1]. A significative example is the analysis of the average shape of the noise pulse [1, 2], which was predicted theoretically to be asymmetric, while experiments, for instance in magnetic systems, show instead a marked leftward asymmetry [3]. This discrepancy has been recently resolved, showing that the asymmetry is due to the negative effective mass of the magnetic objects (i.e. the Bloch domain walls) responsible for the noise [4]. This example illustrate how simple models can improve our understanding of the magnetization dynamics.
A very important feature of crackling noise is the condition of stationarity during the dynamics. In fact, there are systems which typically respond with avalanches during a transient regime, the clearest example being the acoustic emission prior to fracture in brittle materials [5], but also the magnetic noise emitted during the fracture of steel [6]. In other cases, it is not always obvious to understand wether the system is in a stationary state or not. The question is important because non-stationarity can bias the scaling of the avalanche distributions. A notable theoretical example in this respect is offered by the Random Field Ising Model (RFIM) [7], where the critical exponent of the avalanche size distribution , changes in three dimensions from to in stationary and non-stationary conditions, respectively. The reason behind this result is that in non-stationary condition the distribution is integrated over different values of the control parameter, yielding a larger effective exponent. This mechanism was also discussed in general terms by Sornette in Ref. [8].
Experimentally the problem of stationarity has been addressed with a certain detail in the context of Barkhausen noise, the crackling noise occurring in ferromagnets as the magnetic field is increased. In 1981, Bertotti and Fiorillo [9] suggested to investigate the noise properties only in a limited range of magnetization curve around the coercive field, in order to ensure the stationarity of the detected noise signal. In this regime, the magnetization process is ruled by the jerky motion of domain walls, the interfaces delimiting two domains with opposite magnetization. Before this fact was pointed out, noise experiments had been performed all along the hysteresis loop, i.e. in highly non stationary conditions, leading to results sometimes difficult to interpret theoretically. This new approach to the investigation of Barkhausen noise generated a series of important studies which have highly improved our undestanding of the phenomenon [10]. Nevertheless, this scientific field is still very active, also because the Barkhausen effect is generally considered as one of the cleanest examples of crackling noise [1]. A detailed analysis of the vast scientific literature on the subject can be found in our recent review [11]. The main conclusion is that, despite the large variety of soft magnetic materials, most of the experimentally measured scaling exponents can be grouped into two different universality classes, reflecting the dominating magnetic interactions [12]. Nanocrystalline and polycrystalline materials are dominated by long range interactions, originated by stray fields inside the sample. Amorphous materials, especially when subjected to an external tensile stress [13], are dominated by the short range elastic tension of the domain wall.
As a matter of fact, there is a number of significative experimental results which do not fit into these two classes. A few materials show critical exponents which are within the values found for the two classes, especially in systems where the domain patters is highly fragmented, and dominated by residual stresses. This is the often the case of unstressed amorphous alloys, where the mechanism of production leaves a high degree of disorder and quenched-in stress in the material. Thus one may consider these variations as experimental fluctuations.
A more serious problmem comes from the data reported in the paper of Spasojevic et al. [14], which also employed an amorphous sample in an unstressed state, but where the critical exponents are significantly larger than the ones found in the two classes. This result has often been referred toas the signature of another universality class in soft magnets, although no convincing theoretical explanation has been proposed. In our opinion, it is difficult to believe that this new universality class exists, as it would require that in the sample employed in Ref. [14] domain wall dynamics would be ruled by completely different interactions than in other apparently similar amorphous alloys. We are more inclined to think that in Ref. [14] the experimental conditions are significantly different from the standard ones. Assuming that the noise signal was not stationary, we can try to explain the observed high values of critical exponents. In fact, very similar values of the exponents were measured earlier in NiFe by sampling the noise over the entire hystresis loop [15]. On the other hand, following the recommendation of Ref. [9], the authors of Ref. [14] actually measured the signal in a small magnetization window around the coercive field. While this is certainly true, we will show in this paper that non stationarity can be intrinsic to the experimental setup and material properties.
To corroborate our hypothesis, we perform a series of Barkhausen noise measurements on a similar amorphous sample in non stationary conditions, obtaining critical exponents very close to the ones reported in Ref. [14]. Moreover, we also measured the exponents under stationary conditions, recovering the values typical of amorphous alloys [13, 12, 16]. In addition, we show that there exists at least a single critical exponent which is not affected by non-stationarity. This exponent, not determined in Ref. [14], relates the average size of an avalanche to its duration, and was shown in [2] to coincide with the high frequency exponent of the power spectrum. Hence, we verify that the noise spectrum does not depend on the stationary state of the dynamics. Finally, we show that a model of domain wall depinning [16, 17, 18, 19, 20, 21] can be used to explain quantitatively the scaling exponents for both stationary and non-stationary conditions.
A similar comparison between stationary and non stationary signals can be very important not only for magnetic systems, but for any other complex systems showing crackling noise. The lesson we draw from our analysis is that one need to check carefully for the stationarity of the signal before a detailed comparison between experiments and theory can be attempted.
2 Experimental conditions for stationarity and non-stationarity
In our cited review [11], we have analyzed many experimental papers of the literature to establish a set of practical rules to be able to compare experimental data with the theoretical predictions. A fundamental condition is to utilize an experimental setup which ensures the stationarity of the noise signal. This requires to take care of the possible variations of the experimental conditions during the measurements and/or inside the materials.
A crucial feature, in this respect, is the role of the demagnetizing field which is not constant in non-ellipsoidal samples, being is especially intense close to the ends of the sample. A practical rule is thus to detect the signal in a region where this field is reasonably constant, as, for instance, using a pickup coil with limited width (a few mm, in practice). Another important aspect, as mentioned in the Introduction, is to delimit the acquired signal to a small magnetization region around the coercive field. In practice, this means to consider a region of the hysteresis loop having a roughly constant permeability. Neither of these two conditions are fulfilled in the paper of Spasojevic et al. In fact, their amorphous sample is pretty short (4 cm), and thus the the demagnetizing field has a strong spatial variation which highly affects the magnetization dynamics. In addition, the pickup coil is much larger than the sample length: this implies that the detected noise is the superposition of signals of the coils all along the samples, which correspond to cross sections of the sample having different permeabilities. This measurement is thus roughly equivalent to consider a material with a curvy hysteresis loop, and detect the signal all along the loop.
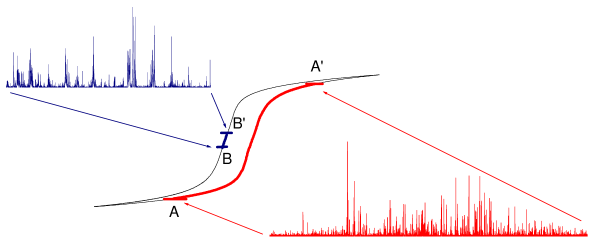
This is exactly the experimental condition we have considered in order to reproduce results similar to Spasojevic et al obtained for a Vitrovac amorphous material. In fig. 1, we depict the typical curvy hysteresis loop and the Barkhausen noise in a highly disordered amorphous ribbon. We have used an Fe85B15 high magnetostrictive amorphous alloy, having dimension of 28 x 1 x 0.002 cm. We have applied a moderate tensile external stress, as the unstressed sample show a poor signal-to-noise ratio, and does not permit to determine the critical exponents with sufficient accuracy. The non stationary signal is detected along a quite extended part of the hysteresis loop, corresponding to about 1.8 T (A-A’ in fig. 1), and the applied stress is about 10 MPa. This region is visibly much larger than the linear region of constant permeability around the coercive field. Thus the stationary signal is detected in a much smaller magnetization region (B-B’ in fig. 1). To improve the signal-to-noise ratio we have slightly increased the tensile stress to 50 MPa.
The details of the experimental setup have been described at length in other papers [12, 11]. Essentially, a 30 cm solenoid provides a constant applied field all along the sample. We apply a triangular field with peak amplitude of 70 A/m, reaching a magnetization of 1 T, smaller than the saturation value. The coercive field is about 6 A/m. To resolve a well defined sequence of avalanches, the frequency of applied field is around 10-20 mHz. The tensile stress is applied using weights of 200 and 1000 g (about 10 and 50 MPa, respectively).
3 Experimental results
The statistical properties of the Barkhausen noise are usually characterized by a set distribution functions, typically displaing scaling. Estimating several scaling exponents in a single material has highly improved the possibility to verify the theoretical predictions and compare different systems. In the present experiment we will try establish what is the set of exponents that depends on the condition of stationarity.
The first step to calculate the distributions is to extract the sequence of avalanches (or pulses) from the noise signal, introducing a small threshold which defines the beginning and the end of each avalanche. The distance between these points is defined as the avalanche duration , while the size is the time integral between the same points. The identification of a small threshold is a procedure which works pretty well in materials where the signal-to-noise ratio is relatively large, as for instant in FeCo based amorphous alloys under tensile stress [4, 12]. For more disordered materials, or with a maze domain structure, as the one used here, the estimation of the critical exponents is a bit less accurate because of the reduced signal-to-noise ratio. In any case, we are interested to see wether there is a significative change of the values of the exponents beyond their uncertainty level.
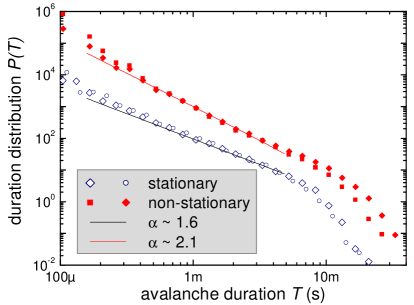
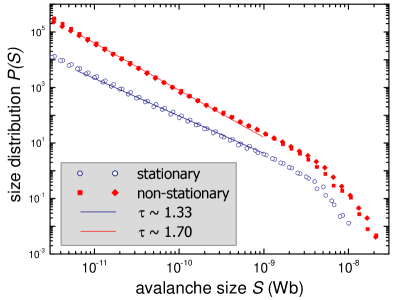
We first consider avalanche duration and size distributions scaling as
| (1) |
and
| (2) |
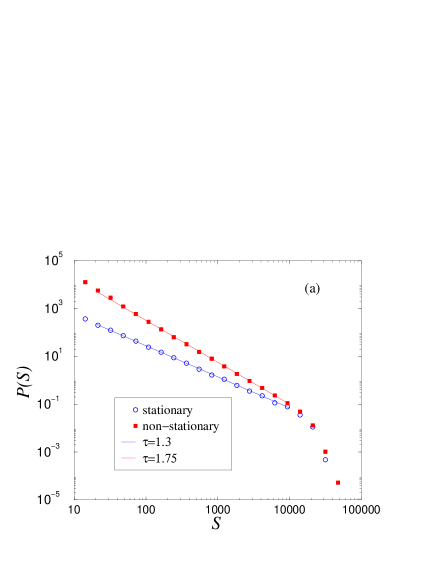
where and are the cutoff values, and and the critical exponents. In Fig. 2 we plot these distributions for both non-stationary and stationary signal, together with an estimate of the critical exponents obtained by fitting the linear part (in the log-log scale) of the data. For the non-stationary signal, we get , and . The larger error for the duration distribution is justified by the limited range of the data (about two decades) and the influence of the background noise in the estimation of shortest avalanches. These values are very close to the ones reported in ref. [14], as , and . For completeness, we have also considered the energy distribution , integrating over time of the squared signal, getting , comparable with the value od obtained in ref. [14].
For the stationary case, we get , and . These values are slightly larger than the values reported for materials belonging to the short range class, where , and . It is likely that this signal is only nearly stationary, and a small contribution of non-stationary avalanches change a little the distribution.
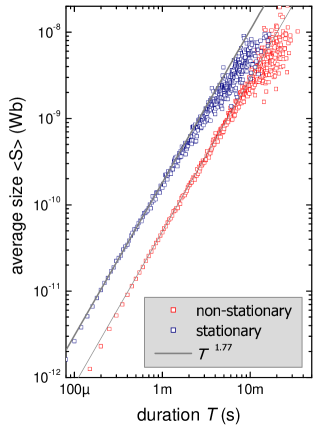
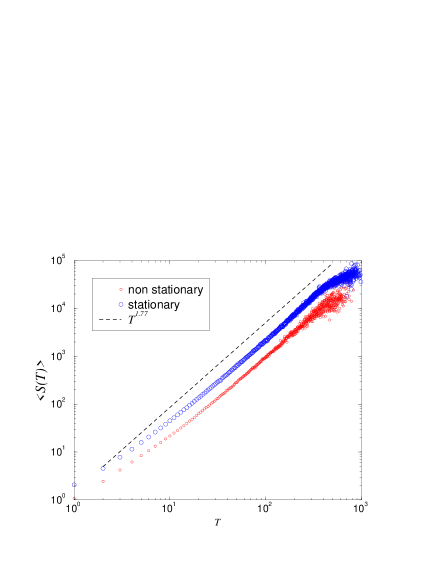
We have also considered another important critical exponent, which relates the average avalanche size to its duration
| (3) |
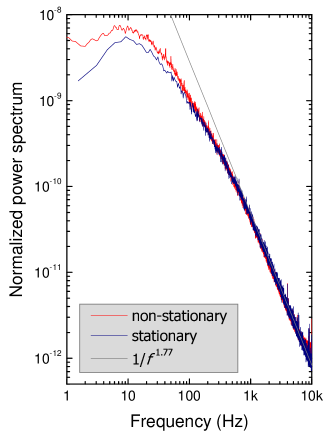
where is the exponent for the avalanche characteristic size, is the correlation length exponent and is the dynamic exponent [7]. The exponent was shown as well to describe with good accuracy the high frequency limit of the power spectra [2, 3, 11]. In fig. 3 we plot both this distribution and the power spectra for better comparison in case of stationary and non-stationary signal. Remarkably, the exponent is the same and coincides with the theoretical value of 1.77 expected for amorphous materials [11]. At the same time, the two power spectra yields at high frequency with the same critical exponent. The power spectra have been normalized by the value of average induced flux rate, proportional to the average magnetization change in the material. The differences at low frequencies are simply due to the different temporal correlations between avalanches, which clearly change in the case of non-stationary signal.
Unfortunately, Spasojevic et al. did not actually estimated the exponent , even if they plotted the joint area-duration distribution. They observed that this distribution is bounded by two lines with exponents 1.3 and 1.63 (see Fig. 6 of Ref. [14]), but it is difficult to estimate the exponent from this.
4 Theoretical considerations and numerical simulations
In order to understand the behavior observed in experiments, we consider a typical domain wall model [16, 17, 18, 19, 20, 21] and discuss how the non-stationarity of the noise signal affects the resulting statistics. We consider a flexible 180∘ domain wall separating two regions with opposite magnetization directed along the axis. In absence of surface overhangs, we can describe the position of the domain wall by a single valued function . The dynamics of the domain wall is determined considering the contribution to the local force due to exchange and magnetocrystalline interactions, magnetostatic and dipolar fields, and disorder [19]. The resulting overdamped equation of motion is given by [16, 17, 18, 19, 20, 21]
| (4) |
where is the eddy current damping constant, is the applied field increasing at constant rate, is an effective demagnetizing factor, is the center of mass of the wall, is the domain wall surface tension and is an uncorrelated Gaussian pinning field. Eq. (4) has been shown to quantitatively reproduce the statistical properties of the Barkhausen noise in amorphous alloys under stress [13, 12].
The observed scaling behavior is related to the underlying domain wall depinning transition, which strictly speaking only occurs for . In this case the wall is pinned unless the external field overcomes a critical field , above which a steady motion ensues. In general, for interfaces close to the depinning transition, the response to small variations of the applied field occurs by avalanches whose sizes are distributed as
| (5) |
indicating that the characteristic avalanche size diverges at the transition with an exponent . Similarly the distribution of avalanche durations scales as
| (6) |
The critical behavior associated to the depinning transition has been studied using renormalization group methods [22, 23, 24, 25] and the avalanche exponents can be obtained by scaling relations [19]. In particular the renormalization group predicts and [11] from two-loop expansion to order O() [25] while simulations yield and . The cutoff exponents are approximately given by and respectively [11]. Finally, the power spectrum exponent is , equivalent to exponent ruling the scaling of the size of an avalanche with its duration [11].
The discussion above refers to the avalanche statistics sampled at a constant applied field close to the depinning transition, but this rarely corresponds to normal experimental conditions for Barkhausen noise measurements (for a notable exception see the experiments reported in Ref. [26] for thin films). Typically the field is ramped at constant rate and , yielding an effective field acting on the domain wall. In these condition, if the domain wall is pinned and the effective field grows until when the domain wall start to move increasing the restoring force provided by the demagnetizing field. Thus the effective field remains close to depinning transition and the domain wall displays a stationary avalanche dynamics, with exponents , , derived above and cutoffs depending now on [12]. These conditions are met for the stationary signal reported here, as well as for many other experiments reported in the literature for amorphous alloys [11], and indeed the exponents are in perfect agreement with the theory.
If one would ramp the field slowly and sample the avalanche distribution over all the values of the effective field, the result will be different. This condition would occur if we set and increase the field up to , but also for if we consider the transient regime before the steady state is reached. To describe this non-stationary regime, we need to integrate Eq. 5 over obtaining
| (7) |
with . Using the values of and reported above, we obtain . A similar discussion can be repeated for the avalanche duration distribution, yielding . The exponent will of course not resent by the integration and hence should be the same both for stationary and non-stationary conditions.
From the discussion above we can conclude that the differences between stationary and non-stationary avalanche signals is simply due to the integration of the scaling function in the latter case. As a further illustration, we have simulated an automaton version of Eq. (4) and computed the avalanche distributions in the steady-state regime and in the initial transient. As shown in Fig. 4, the scaling exponents reproduce quantitatively the experimental results. In particular, we find and in stationary conditions and and for non-stationary conditions. Fig. 5 shows as welll that is does not depend on the stationarity if the signal.

5 Conclusions
We have measured the avalanches distributions in an amorphous material with high quenched-in disorder, performing a comparitive analysis of stationary and non-stationary signals. We have shown that the size and duration distributions are highly affected by non-stationarity, while the scaling relation between the average size and duration is a robust quantity. This result is actually non surprising, since the non-stationarity only changes the probability of having an avalanche (and thus the overall statistics), but does not affect its internal structure.
The present discussion can be extended to other classes of crackling noise where problems of non-stationarity may arise. From our analysis the exponent emerges as the most reliable test for the universality class of crackling noise statistics, while one should be aware of the possible bias in the distribution exponents. For the Barkhausen noise case, we have provided a quantitative explanation of the experiments by analyzing a model for domain wall depinning. The exponents predicted theoretically for the model in stationary and non-stationary conditions reproduce to a very good precision the experimental measurements. A similar resoning would apply to other kind of critical phenomena as discussed in Ref. [8].
Finally, we think to have clearly demonstrated that the experiment of Spasojevic et al. [14] does not imply the existence of a third universality class in the Barkhausen noise, but only that the results were probably obtaining under non-stationary conditions. A similar discussion applies to the earlier measurements reported in Ref. [15], where the distributions were sampled along the entire hysteresis loop.
Acknowledgments
SZ thanks for hospitatility the Kavli Institute for Theoretical Physics, UCSB, where this work was completed and acknowledge partial financial support through NSF Grant PHY99-07949.
References
References
- [1] Sethna J, Dahmen K A and Myers C R 2001 Nature 410 242–244
- [2] Kuntz M C and Sethna J P 2000 Phys. Rev. B 62 11699–11708
- [3] Durin G and Zapperi S 2002 J. Magn. Magn. Mat. 242-245 1085–1088
- [4] Zapperi S, Castellano C, Colaiori F and Durin G 2005 Nature Phys. 1 46–49
- [5] Garcimartín A, Guarino A, Bellon L and Ciliberto S 1997 Phys. Rev. Lett. 79, 3202 ; Guarino A , Garcimartín A and Ciliberto S 1998 Eur. Phys. J. B 6, 13 .
- [6] Kun F, Lenkey G B, Tak cs N and Beke D L 2004 Phys. Rev. Lett. 93 227204
- [7] Sethna J P, Dahmen K and Perkovic O 2005 The Science of Hysteresis: Physical Modeling, Micromagnetics, and Magnetization Dynamics vol II (Amsterdam: Academic Press) chap II ”Random-field Ising models of hysteresis”, pp 107–179 (Preprint on cond-mat/0404512)
- [8] Sornette D 1994 J. Phys. I (France) 4 209
- [9] Bertotti G and Fiorillo F 1981 J. Magn. Magn. Mat. 23 136–148
- [10] Alessandro B, Beatrice C, Bertotti G and Montorsi A 1990 J. Appl. Phys. 68 2901–2908
- [11] Durin G and Zapperi S 2005 The Science of Hysteresis: Physical Modeling, Micromagnetics, and Magnetization Dynamics vol II (Amsterdam: Academic Press) chap III ”The Barkhausen noise”, pp 181–267 (Preprint on cond-mat/0404512)
- [12] Durin G and Zapperi S 2000 Phys. Rev. Lett. 84 4075–4078
- [13] Durin G and Zapperi S 1999 J. Appl. Phys. 85 5196–5198
- [14] Spasojevic D, Bukvic S, Milosevic S and Stanley H E 1996 Phys. Rev. E 54 2531–2546
- [15] Lieneweg U and Grosse-Nobis W Inter. J. Magnetism 3 11–16
- [16] Urbach J S, Madison R C and Markert J T 1995 Phys. Rev. Lett. 75 276–279
- [17] Narayan O 1996 Phys. Rev. Lett. 77 3855–3858
- [18] Cizeau P, Zapperi S, Durin G and Stanley H E 1997 Phys. Rev. Lett. 79 4669–4672
- [19] Zapperi S, Cizeau P, Durin G and Stanley H E 1998 Phys. Rev. B 58 6353–6366
- [20] Bahiana M, Koiller B, de Queiroz S L A, Denardin J C and Sommer R L 1999 Phys. Rev. E 59 3884–3887
- [21] de Queiroz S L A and Bahiana M 2001 Phys. Rev. E 64 066127
- [22] Nattermann T, Stepanow S, Tang L H and Leschhorn H 1992 J. Phys. II (France) 2 1483–1488
- [23] Narayan O and Fisher D S 1993 Phys. Rev. B 48 7030–7042
- [24] Leschhorn H, Nattermann T, Stepanow S and Tang L H 1997 Ann. Physik 6 1–34
- [25] Chauve P, K J Wiese P Le Dussal 2001 Phys. Rev. Lett. 86 1785–1788
- [26] Kim D H, Choe S B and Shin S C 2003 Phys. Rev. Lett. 90 087203