Effect of pinning and driving force on the metastability effects in weakly pinned superconductors and the determination of spinodal line pertaining to order-disorder transition
Abstract
We explore the effect of varying drive on metastability features exhibited by the vortex matter in single crystals of 2H-NbSe2 and CeRu2 with varying degree of random pinning. The metastable nature of vortex matter is reflected in the path dependence of the critical current density, which in turn is probed in a contact-less way via ac-susceptibility measurements. The sinusoidal ac magnetic field applied during ac susceptibility measurements appears to generate a driving force on the vortex matter. In a nascent pinned single crystal of 2H-NbSe2, where the peak effect (PE) pertaining to the order-disorder phenomenon is a sharp first order like transition, the supercooling feature below the peak temperature is easily wiped out by the reorganization caused by the ac driving force. In this paper, we elucidate the interplay between the drive and the pinning which can conspire to make the path dependent ac-susceptibility response of different metastable vortex states appear identical. An optimal balance between the pinning and driving force is needed to view the metastability effects in typically weakly pinned specimen of low temperature superconductors. As one uses samples with larger pinning in order to differentiate the response of different metastable vortex states, one encounters a new phenomena, viz., the second magnetization peak (SMP) anomaly prior to the PE. Supercooling/superheating can occur across both the PE and the SMP anomaly and both of these are known to display non-linear characteristic as well. Interplay between the path dependence in the critical current density and the non-linearity in the electromagnetic response determine the metastability effects seen in first and the third harmonic response of the ac susceptibility across the temperature regions of the SMP and the PE. The limiting temperature above which metastability effects cease can be conveniently located in the third harmonic data, and the observed behavior can be rationalized within the Beans Critical State model. A vortex phase diagram showing the different vortex phases for a typically weakly pinned specimen has been constructed via the ac susceptibility data in a crystal of 2H-NbSe2 which shows the SMP and the PE anomalies. The phase space of coexisting weaker and stronger pinned regions has been identified. It can be bifurcated into two parts, where the order and disorder dominate, respectively. The former part continuously connects to the reentrant disordered vortex phase pertaining to the small bundle pinning regime, where the vortices are far apart, interaction effects are weak and the polycrystalline form of flux line lattice prevails.
pacs:
74.25.Qt, 64.70.Dv, 74.25.Dw, 74.25.SvI Introduction
The richness of the phenomenon of the Peak Effect (PE) in the mixed state of type-II superconductors has engrossed the vortex physics community for over forty years 1 ; 2 ; 3 ; 4 ; 5 . The ubiquitous PE phenomenon is an anomalous enhancement in the critical current density (Jc) of a superconductor as a function of applied field or temperature in the vicinity of the superconducting to the normal state transition 1 ; 2 . The vortex matter can be viewed as an elastic medium in a random pinning environment along with the influence of thermal fluctuations acting on the pinned vortices. According to a heuristic argument due to Pippard 6 and subsequent theoretical work by Larkin and Ovchinnikov 7 , the PE is considered to be triggered by an incipient softening of the elastic vortex lattice as the normal state is approached. The softer lattice presumably gets conformed to its pinning environment more snuggly, thereby producing an enhancement in the pinning (or Jc). The notion that the PE can be associated with an inevitable and eventual softening of the vortex lattice encouraged the widespread belief that the PE is a (precursor) signature of the phenomenon of flux line lattice (FLL) melting 8 ; 9 . It is useful to recall at this juncture that FLL melting phenomenon has been unambiguously verified only in the anisotropic high temperature cuprate superconductors (HTSC) 10 . The PE phenomenon has, however, been widely studied in low Tc superconductors (LTSC) as well as in the HTSC. In the LTSC, the smallness of the Ginzburg number, which measures the relative importance of thermal fluctuations vis-á-vis superconducting condensation energy, makes the thermally driven FLL melting line lie very close to the Hc2(T) line 3 . The investigations in a variety of samples of LTSC reveal that the anomalous behavior pertaining to the PE could surface up sufficiently below the Hc2(T)/Tc(H) values and the separation between the onset position of the PE anomaly and Tc(H) line correlates well with the level of effective disorder in the sample 11 . Such observations seem to suggest that, generically, the PE as a phenomenon needs a clarification and distinction from the pristine thermally driven FLL melting transition.
In any realistic sample of a type II superconductor, the inevitable presence of residual quenched random disorder is anticipated to compromise the perfect translational symmetry of the Abrikosov flux line lattice state. However, it was argued by Larkin and Ovchinnikov (LO) 12 that in the presence of pinning, the spatial order in the vortex matter could survive within a domain having dimensions much larger than the intervortex spacing, but smaller than the typical sample size. In recent times, Giamarchi and Le Doussal 13 have shown that the spatial correlations in the weakly pinned vortex matter could decay much more slowly, in an algebraic manner, such that a good positional and high orientational order, equivalent to a quasi-long range order (notionally a ‘Bragg glass’ state), can be observed over length scales comparable to the sample dimensions. A contemporary view that has gained acceptance about the PE anomaly is that it represents a transition from a weakly pinned Bragg glass state to a stronger pinned multi (or micro) domain vortex glass state. Bulk ac susceptibility studies in a very weakly (nascent) pinned superconducting specimen of 2H-NbSe2 had pointed towards the association of the PE with the first order nature of the underlying transition in the pinned vortex matter 14 . Eventually, the local ac susceptibility measurements by scanning micro-Hall bar microscopy 4 in the typically weakly pinned single crystals of 2H-NbSe2 directly elucidated the presence of an interface separating the weaker and stronger pinned regions across the peak effect region, thereby endorsing its first order nature and the associated metastability effects.
The presence of a first order transition line in the magnetic phase (H, T) diagram of a weakly pinned superconductor imbibes in it the notion of supercooling and superheating effects across it 15 ; 16 ; 17 . An STM imaging study 18 alongwith an analysis of the instantaneous positions of the individual vortices in a very weakly pinned crystal of 2H-NbSe2 led to the surmise that neighboring vortices execute collective motion below the onset temperature of the PE, which transforms to positional fluctuations (random excursions) of individual vortices above it. A small angle neutron scattering (SANS) study 19 in a typically weakly pinned crystal of Nb could reveal the superheating of the ordered Bragg glass phase above the onset temperature of the PE alongwith the usual supercooling of the disordered vortex glass phase below it. An elucidation of the superheating effects across the PE in a variety of single crystals of 2H-NbSe2 by bulk transport measurements using a fast current ramp procedure 20 has resulted in the demarcation of a generic spinodal line corresponding to the limit of the superheating of the ordered state. Above the spinodal line, the threshold force needed to depin and drive the lattice (i.e., critical current density Jc) is independent of the thermomagnetic history of the underlying pinned vortex matter.
The work of Xiao et al. 20 on the spinodal line in conjunction with the correlation between the effective disorder, the structure across the PE and the metastability effects 14 ; 17 ; 21 raises an issue relating to the possible connection between the quenched random disorder and the details characterizing the spinodal nature. In the present report, we shall focus on the results pertaining to this issue. It had been shown earlier 14 ; 17 ; 21 that with the gradual enhancement in the quenched random pinning, the first order nature of the order-disorder transition associated with the PE is not severely compromised; only the process of disordering starts to comprise several distinct steps. In a nascent pinned sample 14 , the interface separating the weaker and stronger pinned regions is perhaps very fragile, and the metastability effects in such a sample get wiped out easily by an infinitesimally small driving force. In typically weakly pinned specimen of LTSC systems (like, Nb crystal used in SANS experiment 19 , or the 2H-NbSe2 crystals used in micro-Hall bar microscopy 4 ), the metastable states are more robust and the thermomagnetic history effects can be conveniently probed via contactless ac susceptibility measurements, with a minimal level of an ac driving force. By performing broad band noise measurements in the in-phase ac susceptibility () and the third harmonic () measurements, one can demarcate the limits of metastability and determine the spinodal line in the vortex phase diagram. We elucidate the above stated behavior in the samples of two very different superconducting compounds 21 , viz., 2H-NbSe2 (Tc 6 K) and CeRu2 (Tc 6.3 K) to establish the generic nature of the spinodal line, so determined.
II Experimental
The ac susceptibility studies have been carried out using a conventional double coil arrangement affixed coaxially inside a superconducting magnet coil and employing a mutual inductance bridge 22 . Most of the data have been recorded in the frequency interval of 21 Hz to 211 Hz and with an ac amplitude (hac) lying in the range of 0.5 Oe to 3.5 Oe (r.m.s.). The samples studied include the crystals X, Y′, Y, Z and Z′ of 2H-NbSe2 14 ; 17 ; 23 and a single crystal of CeRu2 21 . The crystal X of 2H-NbSe2 is the most weakly pinned sample, with a Tc(0) = 7.225 K, the crystals Y′ and Y are somewhat stronger pinned than the crystal X with Tc(0) = 7.25 K and 7.17 K, respectively. The crystals Z and Z′ have Tc(0) values in the neighborhood of 6 K and they probably contain few hundred ppm of Fe impurity in them 21 . From the sample X to Z′, the Jc values at 4.2 K in the low field region ( 1kOe) vary from about 10 A/cm2 to 103 A/cm2 23 . We reckon that the FLL correlations in the vortex matter in the crystals Z and Z′ of 2H-NbSe2 are like those in the typically weakly pinned crystals of other low Tc superconducting compounds, e.g., CeRu2, Ca3Rh4Sn13, etc. 21 ; 24 .
III Results and Discussions
III.1 AC susceptibility measurements in the crystals of 2H-NbSe2 with varying pinning
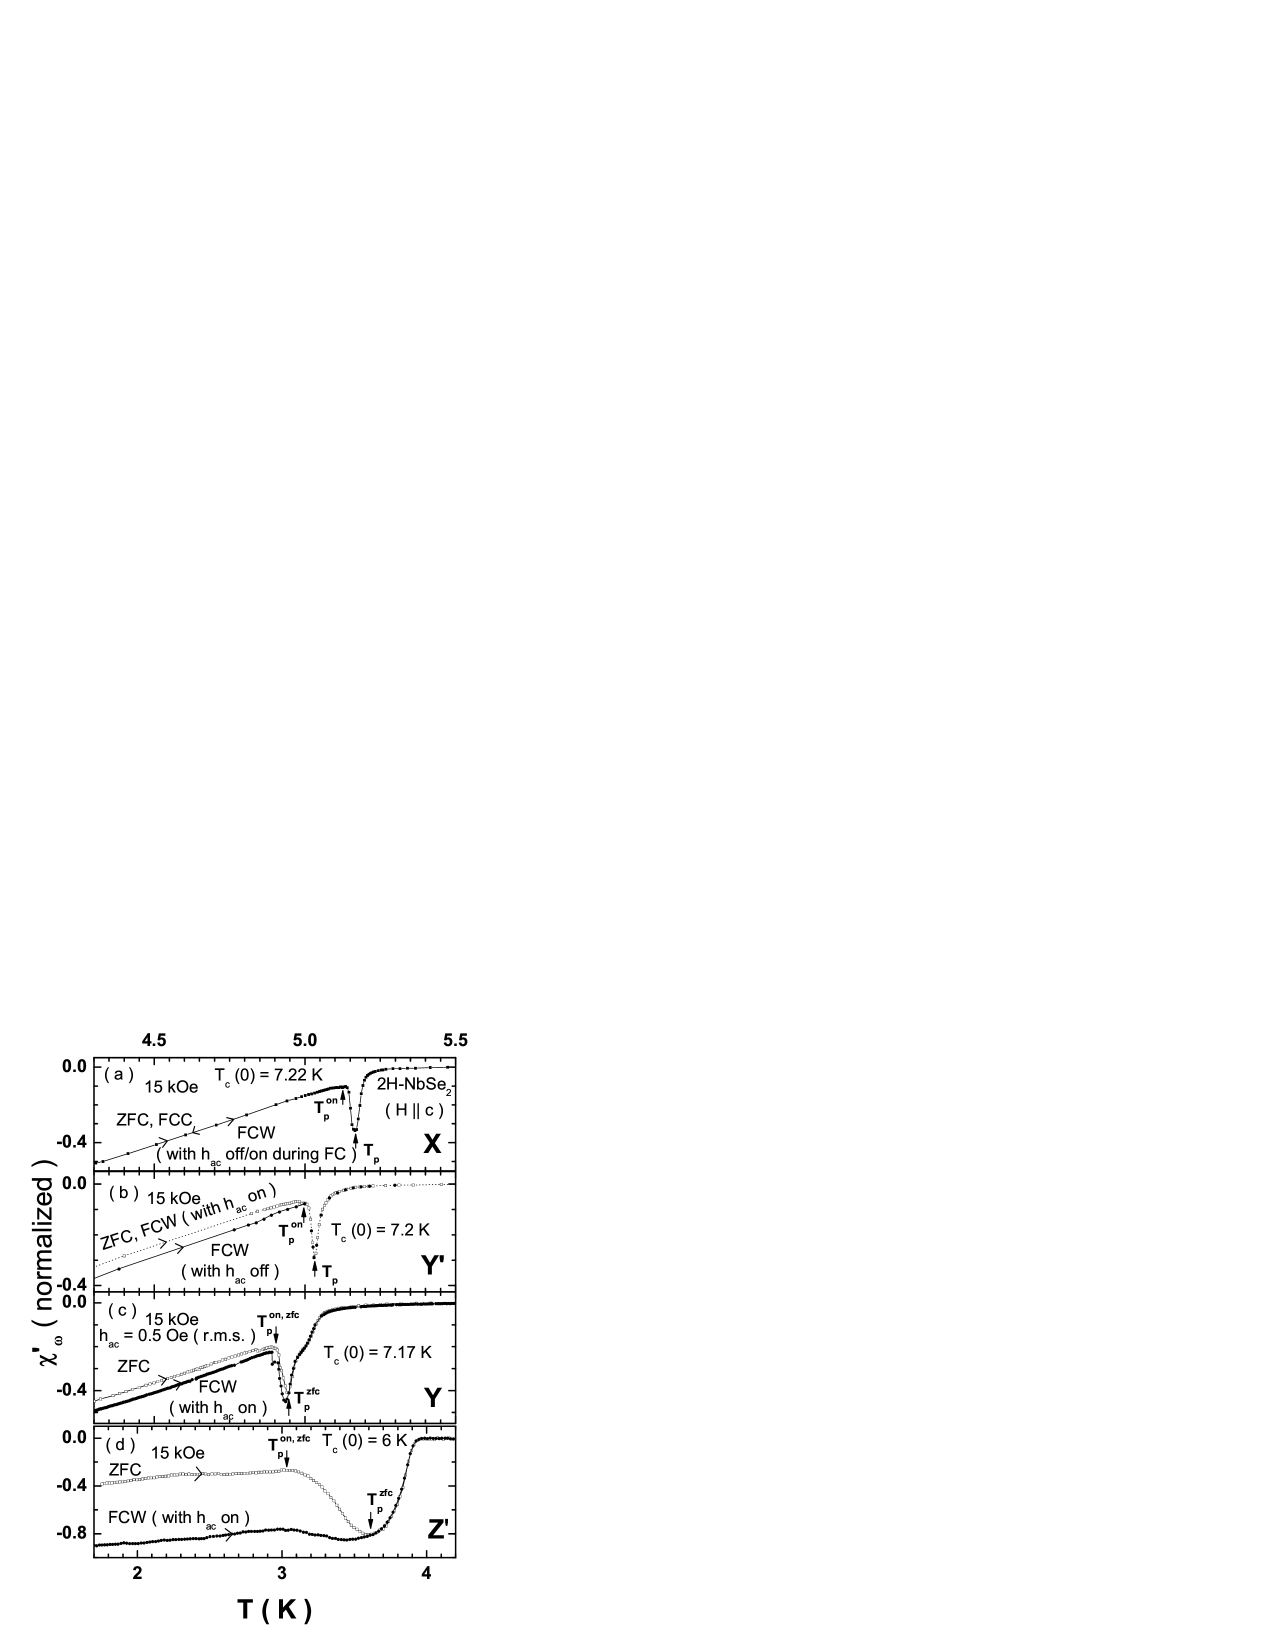
Figure 1 shows the in-phase ac susceptibility response, , in the different crystals X, Y′, Y, Z and Z′ of 2H-NbSe2 in a field of 15 kOe. The ac susceptibility response varies as 25 , , where is a geometry and size dependent factor. This implies that the response closely mimics the behavior of the Jc in the sample. In different samples, we compare the Jc values of the vortex states corresponding to different thermomagnetic histories, viz., the zero field cooled (ZFC) state and the two field cooled (FC) modes. The response of a FC state is first measured while cooling down (FCC), and later measured while warming up (FCW).
Figure 1(a) shows the response in the cleanest crystal X for the vortex states in the ZFC, FCC and FCW modes. All the three responses are observed to overlap, such that no distinction can be made amongst them. In this crystal, we find the PE to be a very sharp feature (which occurs over a width of 20-40 mK or so). Considering that the crystal X has the least amount of disorder, one may argue that the properties of the first order nature of the PE transition should get best exemplified in this crystal. It was, therefore, expected that a substantial hysteresis in the responses should have been evident between the ZFC and the FCC states due to the possible supercooling effect below the onset temperature of the first order transition. While the data shown in figure 1(a) for the vortex states in a field of 15 kOe is a representative one for the crystal X, we found the absence of any thermomagnetic history dependence in the response (i.e., differences between the ZFC and the FCC or the FCW states) across the PE transition at all magnetic fields in this sample (all data not being shown here). A possible reason for the absence of the hysteresis between the ZFC and the FC states in the sample X is a subtle effect of the superimposed ac magnetic field hac. We elucidate next an additional facet of hac in the ac susceptibility measurements on the pinned vortex matter, which is different from its obvious role in measuring the shielding response from the macroscopic screening currents induced by its imposition on the sample.
Figure 1(b) displays the response of the vortex state with two different thermomagnetic histories, viz., the ZFC and the FCW, in the crystal Y′ at 15 kOe. We observe that the sharpness of the PE in this crystal is comparable to that in the crystal X, but the response of the ZFC and FC vortex states can be made to differ, unlike the situation observed in the crystal X. We find that for the ZFC and FCW modes, the responses in the crystal Y′ coincide if the hac is kept ‘on’ while the sample is initially cooled down in a dc magnetic field to the lowest temperature (which was 4.3 K in the present case). Such a situation is identical to that in the sample X. However, if the sample Y′ is field cooled with the hac switched off during the cooling, and it is switched back on only when one begins the FCW measurement, then one observes a measurable difference in the ZFC and the FCW responses. This behavior is indeed different from that observed in the crystal X. These imply that depending on the pinning in the sample, hac has the potential to modify the path dependence in Jc. Such an attribute becomes further exemplified as we examine the results on the samples with higher pinning, viz., the crystals Y and Z′. In these samples, it is significant to note that the differences in the responses of the ZFC and the FCW states survive, whether the hac is kept on or off during the initial field cooling procedure (see figures 1(c) and 1(d)). Note that the limiting temperature below which the response exhibits thermomagnetic history dependence (cf. the positions of arrows marked in the different panels of figure 1) could be a function of hac and the extent of effective pinning in the sample. To emphasize another observation, the notional peak position of the PE in the ZFC (or the FCW) mode does not necessarily mark the limiting temperature above which the thermomagnetic history effects in the response cease.
¿From the responses in figures 1(c) and 1(d), it is evident that J J. To understand the behavior of Jc corresponding to the vortex states with different thermomagnetic histories, we take recourse to a contempory view 4 that in the PE region the vortex state comprises an admixed inhomogeneous phase, with the coexistence of ordered and disordered regions. The ZFC state prior to the PE represents an ordered weakly pinned state, which is characterized by a low Jc value. The FCW state on the other hand could correspond to the phase above the peak temperature, viz., a predominantly disordered, strongly pinned vortex state that can get supercooled down to the low temperatures during field cooling. The FCW state, therefore, carries a higher Jc value. We have elucidated through the results in figure 1(b) that the non-observation of metastable phases in the response need not imply the absence of path dependence in Jc.
In the presence of very weak pinning, the metastable states of the vortex matter could be very fragile. Any attempt to couple the system to the external environment perturbs the underlying vortex matter such that it is driven into a different state, thereby masking (i.e., altering) the pristine information pertaining to the metastability. The process of keeping hac switched ‘on’ during field cooling the vortex matter can also help the disordered regions in exploring the possibilities of transformation into the ordered regions of the ZFC mode. This is best exemplified by the data in figure 1(a), wherein in the crystal X, the response is identical, irrespective of whether the hac was kept ‘on’ or ‘off’ during initial field cooling. In the sample X, even while hac was kept off during FC, the application of a small hac to measure the response during the FCW mode resulted in driving the field cooled state towards the ordered state of the ZFC mode.
In the sample Y′, where the pinning is somewhat stronger than that in sample X, the option of keeping the hac switched on/off during the initial field cooldown procedure demonstrates the competition between progressive enhancement in pinning and the annealing effect of hac. The enhanced pinning in sample Y′ arrests the hysteresis across the PE and allows the difference between the ZFC and the FCW state to be observed clearly before the onset temperature of the peak effect (T). The inevitable dynamical changes which accompany the PE phenomenon make the responses for the ZFC and the FCW states nearly identical for T T in the sample Y′. The progressive increase in the pinning can therefore aid the metastability of the supercooled (FC) phase against the thermal fluctuations and the possible perturbations from hac. To search for the true location, where the path dependence in Jc ceases, in other words to determine the spinodal temperature (T∗) which is not influenced by the driving forces, one needs to resort to a sample with optimal pinning. Therefore, to generate metastability in the vortex matter and to sustain its imprint in a measurement, one requires a crucial balance between the strength of the driving force (hac/transport current), disorder/pinning and the temperature. At this juncture, it may also be pertinent to recall and compare the results of the electrical transport data of Xiao et al. 26 in a crystal of 2H-NbSe2 with response as in our samples Y and Y′. It has been reported that the transport Jc value for the FC state in a very weakly pinned specimen differs from that in the ZFC state only during the first ramp-up of the current while recording the I-V data. The Jc values determined during the ramp-down cycle or during the subsequent ramp-up cycles were found to be equal to that for the ZFC state. The passage of transport current presumably reorganizes the disordered state of the FC mode towards the ordered ZFC mode, when the pinning effects are in the nascent stage. Xiao et al. 20 had to later adopt the procedure of fast current ramp to explore the metastable states above the notional onset temperature of the PE. They found that the superheating of the ordered state could be observed upto a limiting temperature T∗, which exceeds the notional peak temperature of the PE for the vortex state prepared in the ZFC mode 20 .
The plots in figure 1(d) appear to imply that the metastability effects in the response would cease above the peak temperature Tp, as was conventionally believed 9 ; 27 ; 28 . The FC state in this sample can be ascribed to a freezing in of the disordered vortex state at the peak position of the PE, where the lattice was believed to be homogenously amorphous 21 ; 28 . However, the recent work by Xiao et al. 20 desires a serious revision of the above presumption. A transformation that sets in at T results in an admixed state of ordered and disordered phases. Both these fractions carry different Jc values and possess different temperature dependences. As the temperature increases from T towards Tp, the fraction of the ordered vortex phase decreases and that of the disordered phase increases, correspondingly the observed Jc value also increases. The relative fractions of these two phases and their temperature dependences determine the peak position (i.e., Tp/Hp) of the PE anomaly. In view of this, the relationship, if any, between Tp and the limiting temperature at which the metastability effects cease is not very apparent. We have set out to clarify this issue via the ac susceptibility measurements.
III.2 Comparison of AC susceptibility data in the crystals of 2H-NbSe2 and CeRu2
As stated earlier, in order to study the features associated with a first order transition one should in principle attempt to select a sample with the least amount of disorder. However, the data in figure 1 show that to study features related to the spinodal temperature T∗ via the ac susceptibility measurements, we were compelled to choose the samples of Z and Z′ category, which have significantly higher level of disorder than the sample X. While it is clear that with an enhanced pinning, the metastability features of the vortex matter stand preserved, it is not however apparent as to whether the first order character of the PE transition stands retained at comparatively higher levels of disorder. A trend which emerges from the response in figures 1(a) to 1(d), is that between T and Tp, the PE phenomenon undergoes a broadening with progressive increase in the effective pinning. It could be argued that this indicates that a sharp first order like PE transition is being transformed into a continuous transition. However, in this context, it is useful to recall that a novel notion of (multi-step) fracturing had been demonstrated earlier 21 ; 24 . The first order nature of the PE transition is not destroyed in samples with higher pinning, it only transforms into multiple small first order like jumps, which comprise the notion of fracturing.
Figure 2 shows a comparison of the ac susceptibility response at different ac amplitudes in a crystal Z of 2H-NbSe2 with that in a crystal of CeRu2 (cubic system with T 6.3 K), with a level of pinning comparable to that in the crystal Z 21 . In both these samples, we observe in figures 2(a) and 2(c) that although the PE is a broad feature, yet it is characterized by multiple sharp jumps commencing at T in the (T) response, characterizing the fracturing transition. A well ordered vortex phase is considered to transform into a multi-domain like state, with pockets of ordered and disordered regions created, possibly via the progressive permeation of topological defects like dislocations, into the ordered vortex phase. At each first order like jump, some particular pockets with a collection of well ordered vortices (with a pocket characterized by a low Jc value), transform into a disordered phase with a higher value of Jc, locally. More the number of such domains, with intervening disordered vortex phase, the average Jc of the sample increases leading to a PE like feature above T. The coexisting ordered and disordered phases are not nucleated by merely supercooling the vortex matter below a first order transition, they can also get generated due to the staggered nature of the first order transition as a consequence of the fracturing phenomenon. The fraction of domains with disordered vortices is larger while field cooling below the fracturing transition, and this result in prominence of the metastability effect.
The above description finds an echo in the plots contained in the figures 2(b) and 2(d). We observe that in the samples of 2H-NbSe2 and CeRu2, there is a substantial difference between the ZFC and the FCW states for hac = 0.5 Oe (cf. figures 2(a) and 2(c)). For larger hac values (i.e., between 2 Oe and 3.5 Oe, as shown in the plots for figures 2(b) and 2(d), the PE becomes a narrower transition and the fracturing features can get suppressed and, consequently the metastability response (as reflected by the differences between the ZFC and FCW responses) also stands reduced. The connection between the weakening of the fracturing transition and the decrease in metastability is presumably related to the annealing effect of the hac drive in modifying the relative fractions of the ordered and disorder regions between T and Tp. With a larger hac drive used for measurements, the residual disordered pockets in the ordered vortex matter get transformed into the ordered ones, prior to the onset of the PE. The vortex matter thus approaches a single domain like picture of the ordered vortices as in the samples X and Y′ of 2H-NbSe2, which then undergoes a sharp PE transition, rather than a multi-step fracturing transition. It is also pertinent to note that with the enhancement in the ordered fraction of vortices in presence of a driving force, the disordered domains of vortices can permeate and survive in the midst of the ordered vortex matter only at relatively higher temperature (cf. the T and Tp values in the figures 2(b) and 2(d) with those in the figures 2(a) and 2(c), respectively). It is also instructive to compare FCW responses in the figures 2(a) and 2(c) with those in the figures 2(b) and 2(d), respectively. The supercooled state in the FCW mode need not undergo order-disorder transition across the PE region; such a behavior is evident when hac is small (cf. figures 2(a) and 2(c)). However, a larger hac drive can reorganize the initial FCC state during warm-up and eventually depict an order-disorder transition across the temperature region of PE, as evident in figures 2(b) and 2(d).
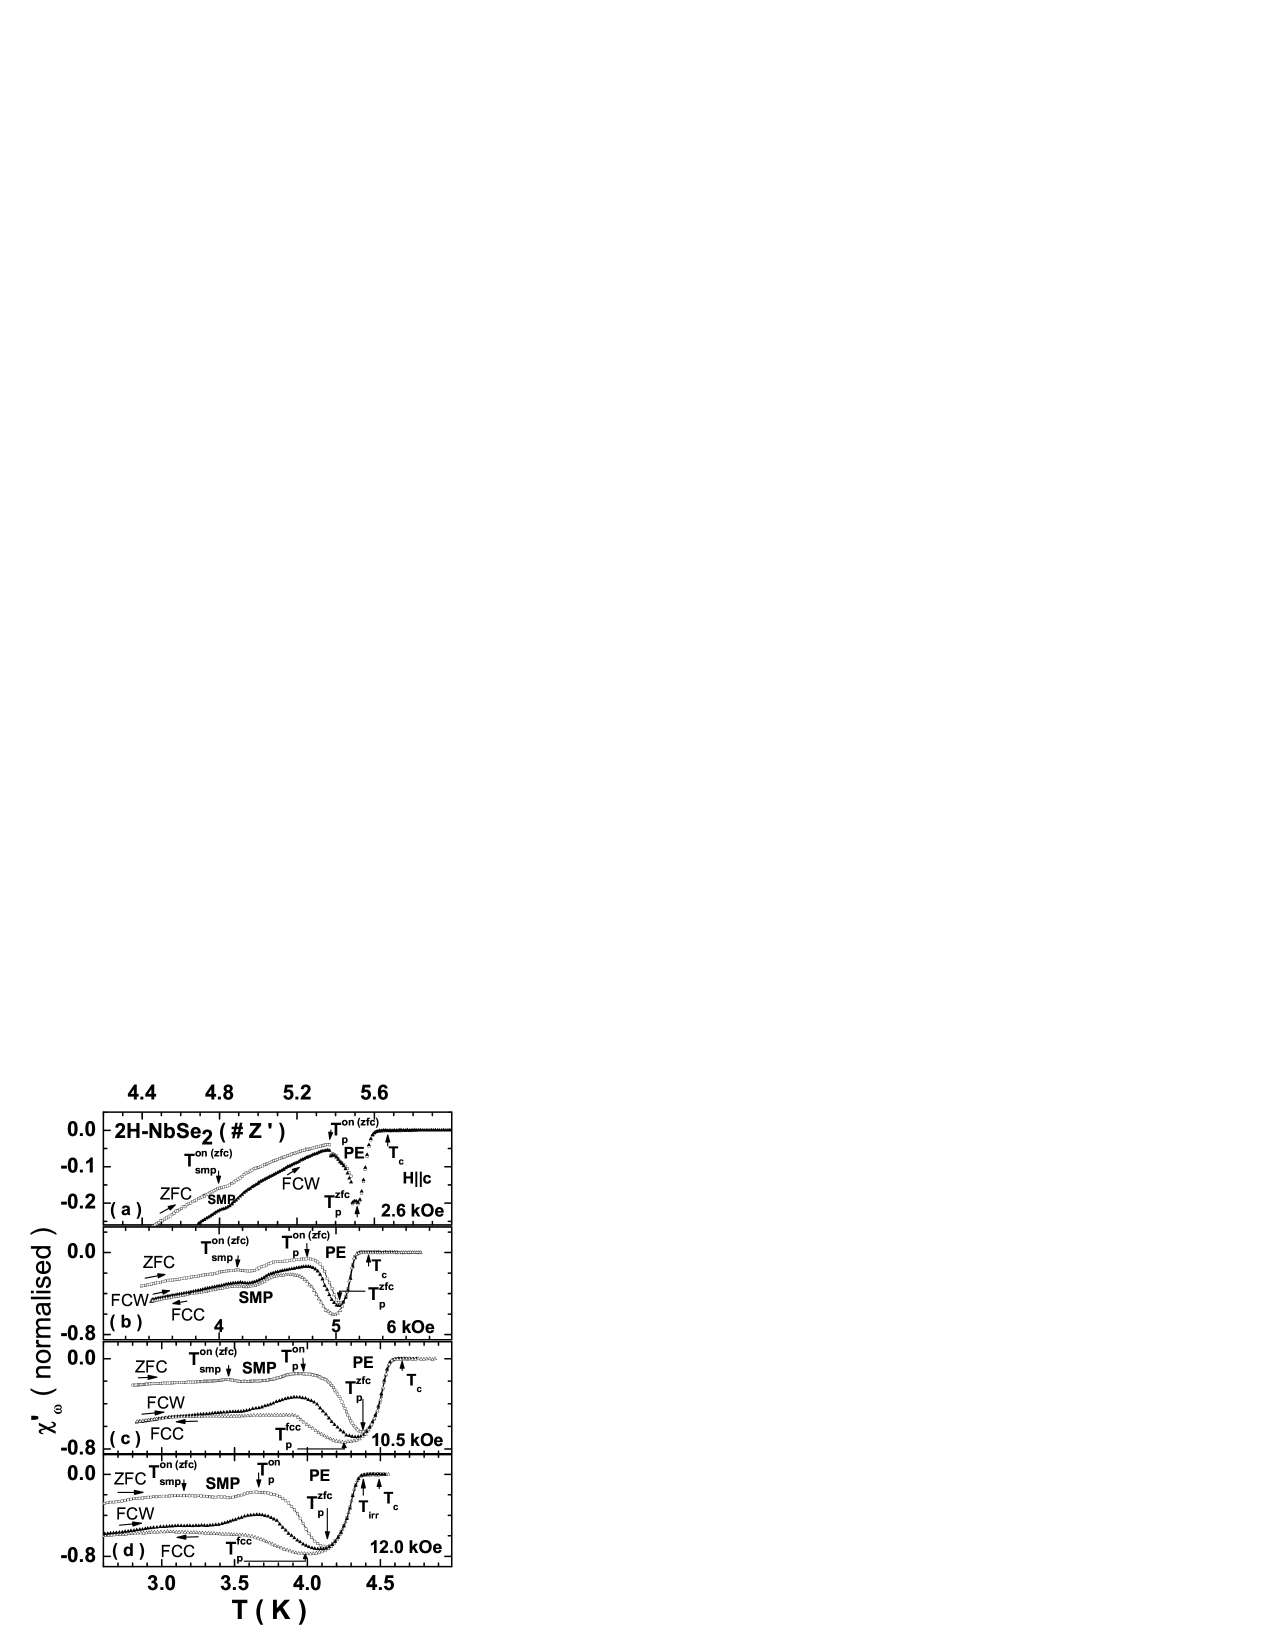
Having explained the metastability features associated with the fracturing transition seen in samples with higher pinning, and determining the optimum range of parameters for hac, disorder and temperature, we now dwell on the demarcation of the limit of metastability in the vortex phase diagram. Figure 3 shows the (T) response at different applied fields for ZFC, FCC and FCW modes in the sample Z′ of 2H-NbSe2. Note that at the lowest temperature, the FCW and FCC responses are identical, at higher temperatures the FCW state is more ordered in comparison to the FCC state. Apart from the behavior of metastability and the PE, we observe an additional anomaly in the behavior of the response on the ZFC branch. In samples having a level of pinning as in the crystal Z′, we can notice the occurrence of an anomalous enhancement in Jc deep in the mixed state beginning at T, corresponding to the second magnetization peak (SMP) feature observed in the isothermal magnetization hysteresis (M-H) loops well before the onset of the usual PE at T 29 . The SMP feature is different from the fracturing phenomenon which gets triggered at (or near) T (see figure 3(a)). It suffices to recall and state here that the (two) anomalies of the SMP and the PE are distinct and different 29 . It may be worthwhile now to ask as to at what stage does the phase coexistence of ordered and disordered phase commence, in the presence of a SMP anomaly. A conventional notion as alluded to in the description earlier would imply that the phase coexistence region commenced from the onset position of the PE. We shall now show that such a notion desires a revision in view of the data presented in the panels of figure 3. Closely associated with the notion of phase coexistence and the first order nature of the PE is that of the metastability.
While examining the metastability response, it is instructive to focus on the interesting behavior illustrated in the data recorded at 6 kOe (cf. figure 3(b)). Note that the peak temperature of the PE is different for different thermomagnetic histories, the highest value being in the ZFC state, T. Similar trend can be noted at other magnetic fields (cf. figures 3(c) and 3(d)). Such a behavior for the response for the vortex states with different thermomagnetic histories, is analogous to that reported for the transport critical current Ic(T) data in a crystal of 2H-NbSe2 by Xiao et al. (cf. figure 1 of Ref.20 ). Vortex states with different histories are characterized by the different fractions of the ordered and the disordered phases. The observation that T T T implies that the limiting temperature at which the sample is homogenously filled with the disordered phase does not lie in the temperature interval, from T to T.
The (T) response for a given H is essentially dictated by Jc(T). The temperature above which (T) (or, Jc(T)) becomes independent of the thermomagnetic history of the specimen appears to lie even above the (highest) peak temperature, i.e., at T T. Figure 4(a) focuses attention onto the plots showing () and () at 12 kOe in the sample Z. In this panel one can identify the limiting temperature T∗ above which the response becomes path independent, viz., where the differences () and () vanish. In the sample Z, due to the relatively strong pinning and the fracturing phenomenon, the determination of the limit of metastability effects is insensitive to perturbations from hac. We believe that the above procedure yields a reasonable estimate of the spinodal temperature, T∗, for 2H-NbSe2 samples with Jc ( 1 kOe, 4.2 K) 1000 Amps/cm2. However, the above procedure may not suffice for all weakly pinned samples, like, the crystals X and Y′ of 2H-NbSe2. It is therefore desirable to explore an alternative way to determine the value of T∗.
III.3 Spinodal temperature T∗ and the third harmonic ac susceptibility measurements
The critical state model (CSM) relates the macroscopic Jc to the hysteretic magnetization response of a superconductor 30 ; 31 . It is well documented 32 ; 33 ; 34 ; 35 ; 36 that new features get added to the pristine relationship between the Jc(H) and the magnetization hysteresis, when Jc(H) does not remain single valued function of H. For instance, the minor hysteresis loops can display anomalous characteristics, like, an asymmetric shape 34 ; 35 , excursions beyond the envelope M-H loop 36 , etc., when the Jc(H) turns path dependent. In the back drop of these observations, it is instructive to examine the response of the third harmonic of the ac susceptibility across the SMP and PE regions, i.e., from below the onset temperature of the first of the two anomalous variations in Jc upto the irreversibility temperature (Tirr), where the (bulk) Jc ceases. To be specific, consider the cool down of a weakly pinned type-II superconducting sample from above a given Tc(H) value to below its Tirr(H), where the finiteness of Jc would result in a non-linear magnetization response which could generate a measurable third harmonic signal in the ac susceptibility measurements. Such a third harmonic signal would be expected to follow the increase in Jc(T) for a given H as (Tirr - T) increases, as per a prescription of the CSM for path independent Jc(H, T) 30 ; 31 . The onset of the history dependence in Jc(H) could compromise the above stated notion, arising from the applicability of the CSM. Below T∗, due to the onset of the path dependence in Jc, qualitative changes could occur in the behavior of the nonlinear response at the nucleation of an inhomogeneous phase.
The plots in figures 4(b) to 4(f) explore the limit of the path dependence in Jc(H) via the study of the temperature dependence of the third harmonic ac susceptibility data, , in the sample Z′ of 2H-NbSe2. In figure 4(b), we draw attention specifically to the behavior of just above T∗. Warming up from the low temperature side, as the temperature crosses the limit T∗, (T) is seen to monotonically decrease and eventually vanish at the irreversibility temperature, Tirr ( Tc(H)). There does not appear any simple correspondence between the (T) and (T) for T T T∗ (cf. figures 3(d) and 4(b)). Figure 3(d) shows that the (T) monotonically decreases above T, reflecting the collapse in Jc above the peak position of the PE. The (T), on the other hand in figure 4(b), appears to enhance between T and T∗. The (T) response is seen to turn around only above T∗, and follow the Jc(T) thereafter. Thus, the onset of an inhomogeneous phase at T T∗, produces modulations in the behavior of nonlinearity or in the response.
To establish the assertion on the imprint of the limit of the path independence in Jc in the (T) data, we can examine the above stated behavior at different fields in figures 4(c) to 4(f), and note one to one correlation between values of T∗ determined from (T) data in different thermomagnetic histories and the limiting temperatures above which (T) monotonically decreases. The T, T and T∗ values have been marked for each of the curves in figure 4. At T T∗, the modulations in (T) display complex behavior, dictated by the (intrinsic) changes in the relative fraction of the ordered and disordered phases (path dependence in Jc(T)) and the additional changes induced by the hac value in which the (T) data are recorded. The T∗, however, does not appear to vary in any noticeable manner with the amplitude of hac (all data not shown here). It is also worthwhile to note that the modulation in the (T) signal ceases close to T. In fact, if we approach T from the lower temperature side, the (T) plots appear to show an enhancement in the non-linear response at T T. Such an observation would get rationalized by invoking the notion that the SMP and the PE are non-linear phenomena 9 . In the absence of complications induced by (possible) phase-coexistence and history effects, the (T) would have been expected to follow the modulation as displayed by (T). We believe that the possibility of phase-coexistence commences at T and lasts upto T∗.
III.4 Correlation between (T) and measurement of noise in (T)
To further substantiate that the values of T∗ determined from the response indeed physically correspond to the spinodal temperatures, we explore the correlation between the (T) and the noise signal in (T) 21 , which can be easily recorded using a Lock-in amplifier having a wide band filter option. The above stated noise signal is believed to measure the fluctuations in (T) and it is argued 21 to reflect the possibility of transformations amongst metastable states accessible from a given mode (ZFC/FC).
Figure 5 depicts the plots of (T) (in hac = 3.5 Oe (r.m.s.)) and the noise in (T) in hac = 0.5 Oe (r.m.s.) in a field of 5 kOe in the sample Z of 2H-NbSe2 and in field of 13.5 kOe in the crystal of CeRu2. In different panels of figure 5, we have marked the respective values of T∗ as determined from the onset of nonmonotonic modulations in response. In view of the notion of the existence of a homogenously disordered phase above T∗, it is indeed not a coincidence that the noise signals in the panels (b) and (d) of figure 5 recede to the background value as T T∗. Taking cue from earlier studies of noise in transport experiments 37 ; 38 , Banerjee et al. 21 had argued that the increase in noise at T = T (equivalent to the temperature of the onset of plastic flow, Tpl, in Ref. 21 ) reflects the possibility of enhancement in transformations amongst the coexisting 4 metastable states in a fractured (partially disordered) vortex solid (which exists at T T∗). The setting in of the decrease in the noise signal as T Tp was considered to imply the effect of phase cancellation of a large number of incoherent fluctuations as the vortex matter moves towards the fully disordered state. In such a framework, the possibility of coexistence of ordered pockets embedded in the disordered medium would cease as T T∗, and the noise signal would be expected to recede to the background value. In the context of our present results, the T∗(H) values indeed represent the notion of the spinodal line, Ts(H) 20 ; 39 .
III.5 Magnetic Phase Diagram in a typically weakly pinned crystal of 2H-NbSe2
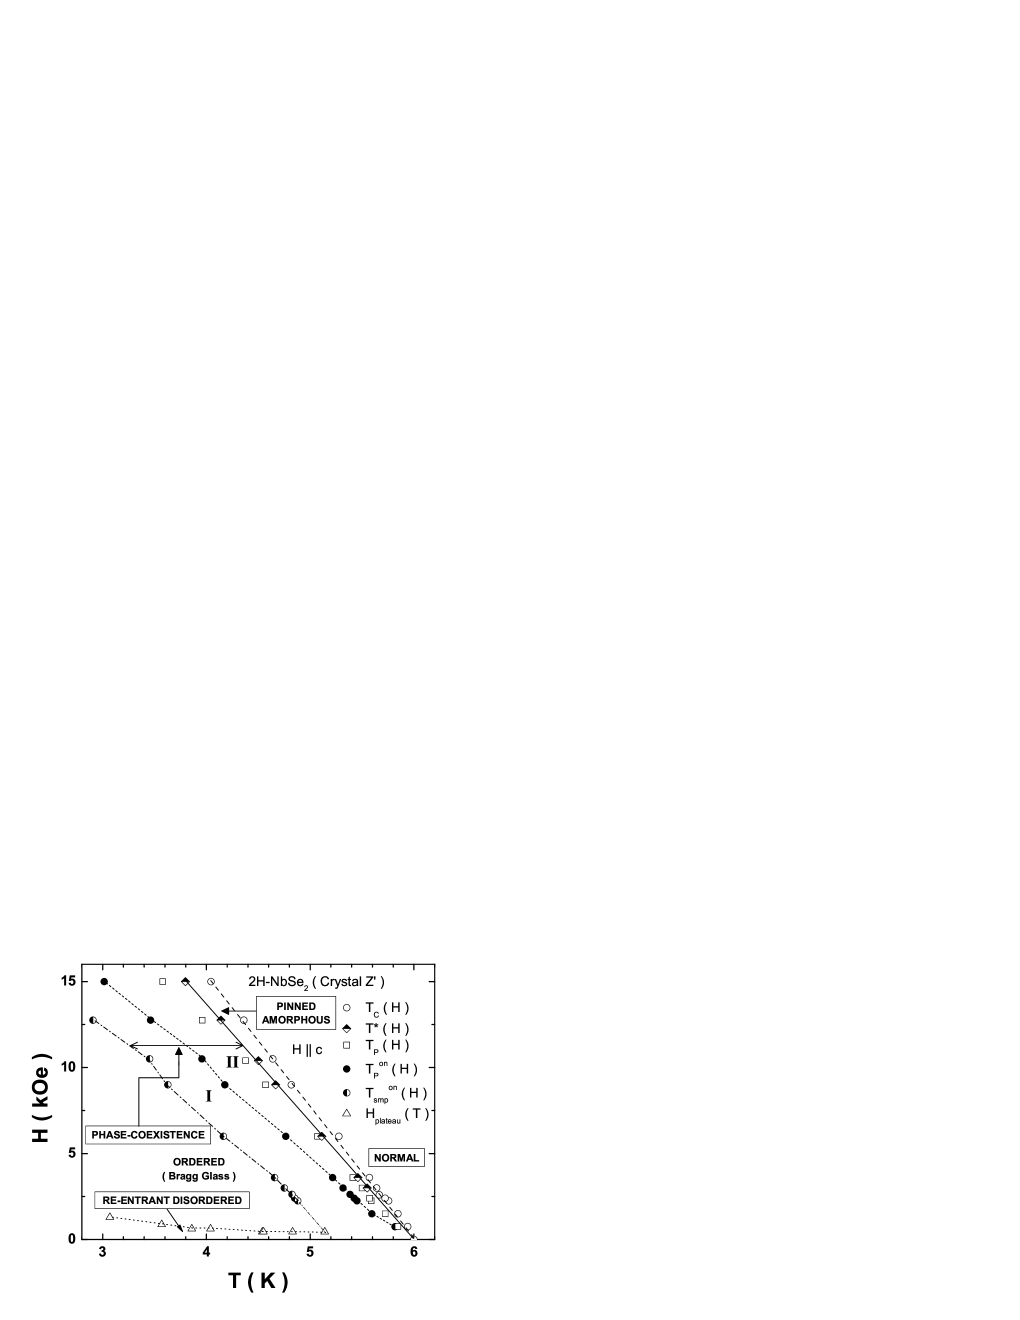
To comprehend a variety of results presented above, we have constructed a field-temperature (H, T) diagram for the sample Z′ of 2H-NbSe2 in figure 6. It includes the values of the onset temperatures of the SMP and the PE anomalies, along with the values of T, T∗(H), Tc(H) and Hplateau(T). In sample Z′ (or Z), there is adequate perceptible difference in T and T∗(H), and this difference enhances as H increases. However, in the samples Y and Y′ of 2H-NbSe2, where the PE manifests as a sharp transition, T∗ values lie in very close proximity of the corresponding peak temperature values. In the vortex phase diagram of figure 6, the plateau line, Hplateau(T), passes through the limiting fields 11 ; 17 below which the collective pinning regime gives way to the small bundle pinning regime. It seems appropriate to identify the (H, T) space between the Hplateau(T) and the T(H) as the Bragg (elastic) glass region 13 . Above the T∗(H) line, where the metastability effects cease, the vortex matter exists in the pinned amorphous phase. The phase diagram demarcates the regime of phase-coexistence 40 . We propose that T(H) line corresponds to the boundary where pockets of disordered phase start proliferating in the ordered vortex state, however, the fraction of the ordered phase exceeds that of the disordered phase upto T. Above T, the balance starts to rapidly tilt in favor of the disordered regions and the strongly pinned phase starts determining the overall electromagnetic response. Above the spinodal line T∗(H), the phase coexistence and metastability features cease and the sample is homogenously filled with the disordered regions. The bifurcation of the coexistence phase space into regions I and II, where the order and the disorder dominate, respectively, finds additional support from the temperature dependence of (T) in the FCW mode in figures 3(c) and (d). Both sets of data show that Jc(T) values for the stronger pinned vortex solid continue to decrease between T and T. It is only above T that the Jc(T) values for ZFC and FCW modes start to increase.
IV Summary
To summarize, we have investigated the effect of drive and disorder on supercooling/superheating effects across the anomalous variations in critical current density in several single crystals of 2H-NbSe2 and compared their results with those in a single crystal of CeRu2. We have mapped out in typically weakly pinned crystals of 2H-NbSe2 and CeRu2 the phase coexistence regime of the stronger and the weaker pinned pockets, where metastability effects manifest in a prominent manner. The termination of the phase coexistence regime at higher field and higher temperature end can be conveniently located in the third harmonic ac susceptibility data. At lower fields ( 1 kOe), the region I of the phase coexistence regime, in which the order dominates, can be seen to continuously connect to the so called reentrant disordered phase 11 ; 17 , where the intervortex spacing presumably exceeds the range of interaction (a0 , where is the penetration depth). Bitter decoration 41 and simulation studies 42 have shown that the reentrant disordered phase comprises polycrystalline form of flux line lattice. So long as the domains are large, with radial correlation length Rc a0, the weaker pinned regions dominate. The electromagnetic response of the sample and the imposition of the external driving forces can shrink the stronger pinned domain wall regions. However, as the domain sizes shrink on crossing over to the region II of the phase coexistence regime, the external driving forces aid the process of complete amorphization of the vortex matter. The vortices remain pinned in the amorphous region between T∗ and Tc values in the typically weakly pinned crystals of low temperature superconductors.
Acknowledgments
We have benefited from discussions with E. Y. Andrei, S. Bhattacharya,
C. V. Tomy, A. Tulapurkar, D. Pal and D. Jaiswal-Nagar. We thank
P. L. Gammel for the crystal Y′ of 2H-NbSe2 and Y. Onuki for
the CeRu2 crystal. We also thank R. S. Sannbhadti and U. V. Vaidya
for technical assistance. One of us (ADT) would like to acknowledge
the TIFR Endowment Fund for Kanwal Rekhi Career Development support.
⋆ Email: ajay@tifr.res.in ; † Email: satyajit@iitk.ac.in
References
- (1) P. W. Anderson, in Basic Notions of Condensed Matter Physics, Addison-Wesley Publication Company, USA (1983).
- (2) M. Tinkham, Introduction to Superconductivity, 2nd ed., McGraw-Hill International Edition (1996).
- (3) G. Blatter, M. V. Feigel’man, V. B. Geshkenbein, A. I. Larkin, and V. M. Vinokur, Rev. Mod. Phys. 66, 1125-1388 (1994) and references therein.
- (4) M. Marchevsky, M. J. Higgins, and S. Bhattacharya, Nature 409, 591 (2001).
- (5) G. Blatter, V. B. Geshkenbein, and J. A. G. Koopmann, Phys. Rev. Lett. 92, 067009 (2004) and references therein.
- (6) A. B. Pippard, Philos. Mag. 19, 217 (1969).
- (7) A. I. Larkin, and Yu. N. Ovchinnikov, J. Low Temp. Phys., 34, 409 (1979).
- (8) W. K. Kwok, J. A. Fendrich, C. J. van der Beek, and G. W. Crabtree, Phys. Rev. Lett. 73, 2614 (1994).
- (9) M. J. Higgins and S. Bhattacharya, Physica C257, 232 (1996) and references therein.
- (10) A. Soibel, E. Zeldov, M. Rappaport, Y. Myasoedov, T. Tamegai, S. Ooi, M. Konczykowski, V. B. Geshkenbein, Nature 406, 282 (2000).
- (11) S.S. Banerjee, T.V.C. Rao, A.K. Grover, M.J. Higgins, G.I. Menon, P.K. Mishra, D. Pal, S. Ramakrishnan, G. Ravikumar, V.C. Sahni, S. Sarkar, and C.V. Tomy, Physica C355, 39 (2001).
- (12) A. I. Larkin and Yu. V. Ovchinnikov, Sov. Phys. JETP 38, 854 (1974).
- (13) T. Giamarchi, and P. Le Doussal, Phys. Rev. B52, 1242 (1995).
- (14) S. S. Banerjee, N. G. Patil, S. Ramakrishnan, A. K. Grover, S. Bhattacharya, P. K. Mishra, G. Ravikumar, T. V. Chandrasekhar Rao, V. C. Sahni, M. J. Higgins, C. V. Tomy, G. Balakrishnan, and D. Mck. Paul, Phys. Rev. B59, 6043 (1999).
- (15) S. B. Roy and P. Chaddah, J. Phys.: Condens. Matter 9, L625 (1997); ibid 10, 4885 (1998).
- (16) G. Ravikumar, P. K. Mishra, V. C. Sahni, S. S. Banerjee, A. K. Grover, S. Ramakrishnan, P. L. Gammel, D. J. Bishop, E. Bucher, M. J. Higgins, S. Bhattacharya, Phys. Rev. B61, 12490 (2000).
- (17) S. S. Banerjee, S. Ramakrishnan, A. K. Grover, G. Ravikumar, P. K. Mishra, V. C. Sahni, C. V. Tomy, G. Balakrishnan, D. Mck. Paul, P. L. Gammel, D. J. Bishop, E. Bucher, M. J. Higgins, and S. Bhattacharya, Phys. Rev. B62, 11838 (2000).
- (18) A. M. Troyanovski, M. van Hecke, N. Saha, J. Aarts, and P. H. Kes, Phys. Rev. Lett. 89, 147006 (2002).
- (19) X. S. Ling, S. R. Park, B. A. McClain, S. M. Choi, D. C. Dender, and J. W. Lynn, Phys. Rev. Lett. 86, 712 (2001).
- (20) Z. L. Xiao, O. Dogru, E. Y. Andrei, P. Shuk, and M. Greenblatt, Phys. Rev. Lett. 92, 227004 (2004).
- (21) S. S. Banerjee, N. G. Patil, S. Saha, S. Ramakrishnan, A. K. Grover, S. Bhattacharya, G. Ravikumar, P. K. Mishra, T. V. Chandrasekhar Rao, V. C. Sahni, M. J. Higgins, E. Yamamoto, Y. Haga, M. Hedo, Y. Inada, and Y. Onuki, Phys. Rev. B58, 995 (1998).
- (22) S. Ramakrishnan, S. Sundarum, R. S. Pandit and G. Chandra, J. Physics E: Sci. Instrum., 18, 650 (1985).
- (23) S. S. Banerjee, Ph. D Thesis, 2000, University of Mumbai, Mumbai, India.
- (24) S. Sarkar, D. Pal, S. S. Banerjee, S. Ramakrishnan, A. K. Grover, C. V. Tomy, G. Ravikumar, P. K. Mishra, V. C. Sahni, G. Balakrishnan, D. McK. Paul, and S. Bhattacharya, Phys. Rev. B61, 12394 (2000).
- (25) X. S. Ling and J. I. Budnick, in Magnetic Susceptibility of Superconductors and other Spin Systems, edited by R. A. Hein, T. L. Francavilla, and D. H. Leibenberg (Plenum Press, New York, 1991), p. 377.
- (26) Z. L. Xiao, E. Y. Andrei, P. Shuk, and M. Greenblatt, Phys. Rev. Lett. 86, 2431 (2001).
- (27) M. Steingart, A.G. Putz, and E.J. Kramer, J. Appl. Phys. 44, 5580 (1973).
- (28) W. Henderson, E. Y. Andrei, M. J. Higgins, and S. Bhattacharya, Phys. Rev. Lett. 77, 2077 (1996).
- (29) S. Sarkar, D. Pal, P. L. Paulose, S. Ramakrishnan, A. K. Grover, C. V. Tomy, D. Dasgupta, B. K. Sarma, G. Balakrishnan, and D. McK. Paul, Phys. Rev. B64, 144510 (2001).
- (30) C. P. Bean, Phys. Rev. Lett. 8, 250 (1962).
- (31) C. P. Bean, Rev. Mod. Phys. 36, 31 (1964).
- (32) L. Ji, H. Sohn, G. C. Spalding, C. J. Lobb and M. Tinkham, Phys. Rev. 40, 10936 (1989).
- (33) Y. Yeshurun, M. W. McElfresh, A. P. Malozemoff, J. Hagerhorst-Trewhella, J. Mannhart, F. Holtzberg, and G. V. Chandrashekhar , Phys. Rev. B 42, 6322 (1990).
- (34) P. Chaddah, S. B. Roy, Shailendra Kumar and K. V. Bhagwat, Phys. Rev. B46, 11737 (1992).
- (35) Shailendra Kumar, S. B. Roy, P. Chaddah, Ram Prasad and N. C. Soni, Physica C191, 450 (1992).
- (36) G. Ravikumar, V. C. Sahni, A. K. Grover, S. Ramakrishnan, P. L. Gammel, D. J. Bishop, and E. Bucher, M. J. Higgins, S. Bhattacharya, Phys. Rev. B63, 024505 (2001).
- (37) A. C. Marley, M. J. Higgins and S. Bhattacharya, Phys. Rev. Lett. 74, 3029 (1995).
- (38) R. Merithew, M. W. Rabin, M. B. Weissman, M. J. Higgins and S. Bhattacharya, Phys. Rev. Lett. 77, 3197 (1996).
- (39) D. Li and B. Rosenstein, Phys. Rev. B65, 220504 (2002); cond-mat/0305258; E. Y. Andrei, Z. L. Xiao, W. Henderson, Y.Paltiel, E. Zeldov, M. J. Higgins, S. Bhattacharya, P.Shuk and M. Greenblatt, Condensed Matter Theories, Nova Science Publishers, New York, USA, vol 16, p241-252 (2001).
- (40) A. D. Thakur, S. S. Banerjee, M. J. Higgins, S. Ramakrishnan, and A. K. Grover, Phys. Rev. B72, 134524 (2005).
- (41) M. Menghini, Y. Fasano, and F. de la Cruz, Phys. Rev. B65, 064510 (2002).
- (42) M. Chandran, R. T. Scalettar, and G. T. Zim nyi, Phys. Rev. B69, 024526 (2004).