Electron transport through single Mn12 molecular magnets
Abstract
We report transport measurements through a single-molecule magnet, the Mn12 derivative [Mn12O12(O2C-C6H4-SAc)16(H2O)4], in a single-molecule transistor geometry. Thiol groups connect the molecule to gold electrodes that are fabricated by electromigration. Striking observations are regions of complete current suppression and excitations of negative differential conductance on the energy scale of the anisotropy barrier of the molecule. Transport calculations, taking into account the high-spin ground state and magnetic excitations of the molecule, reveal a blocking mechanism of the current involving non-degenerate spin multiplets.
pacs:
85.65.+h ,73.23.Hk ,73.63.Kv 75.50.XxDuring the last few years it has been demonstrated that metallic contacts can be attached to individual molecules allowing electron-transport measurements to probe their intrinsic properties. Coulomb blockade and the Kondo effect, typical signatures of a quantum dot, have been observed at low temperature in a single-molecule transistor geometry Park et al. (2002); Liang et al. (2002); Kubatkin et al. (2003). In the Coulomb blockade regime, vibrational modes of the molecule appear as distinct features in the current-voltage () characteristics Park et al. (2000); Yu et al. (2004); Pasupathy et al. (2005). Conformational, optical or magnetic properties of molecules may also affect electron transport. With respect to the latter, an interesting class of molecules is formed by the single-molecule magnets (SMMs). These molecules show magnetic hysteresis due to their large spin and high anisotropy barrier, which hampers magnetization reversal. The prototypal SMM, Mn12-acetate, has total spin and an anisotropy barrier of about 6 meV Sessoli et al. (1993); Not (a). Spin excitations play an important role in the magnetization reversal process through quantum tunneling of the magnetization (QTM) Gatteschi and Sessoli (2003). Although the electronic and magnetic properties of SMMs have been studied intensively on bulk samples and thin films Friedman et al. (1996); McInnes et al. (2002); Cavallini et al. (2005); Mannini et al. (2005); Kim et al. (2004), the effect of the high-spin ground state on electron transport in isolated molecules remains an unexplored topic Kim and Kim (2004).
In this Letter we discuss transport through individual SMMs that are weakly coupled to gold electrodes (see Fig. 1). Experimental data show low-energy excited states with a strong negative differential conductance (NDC) and regions of complete current suppression (CCS). For comparison, we have modelled tunneling through a single Mn12 molecule taking into account its magnetic properties. Sequential tunnel processes can result in spin-blockade of the current, providing a possible explanation for the observed NDC and CCS. This effect is different from conventional spin blockade Weinmann et al. (1995); Hüttel et al. (2003) where there is no spin anisotropy.
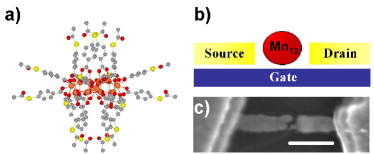
We use the single-molecule magnets [Mn12O12(O2C-R-SAc)16(H2O)4] (Mn12 in the rest of the text), where R=C6H4, C15H30. Both are tailor-made Mn12-acetate derivatives Not (a). These molecules feature thiol groups in the outer ligand shell and consequently exhibit a strong affinity for gold surfaces Mannini et al. (2005); Cornia et al. (2003). Beside ensuring robust tethering of the clusters to the surface, the ligands are also believed to serve as tunnel barriers, so that the molecule is only weakly coupled electronically to the gold. We assume that its magnetic properties are conserved in the vicinity of gold electrodes. The diameter of the molecule (core plus ligands) is about 3 nm for R=C6H4 and 5 nm for R= C15H30. In this paper we focus on the transport features that are measured on the R=C6H4 derivative, which is depicted in Fig. 1(a).
Electromigration Park et al. (1999) produced the nanometer-scale gaps in which the molecules were trapped. We fabricated thin ( nm) gold wires (width 100 nm, length 500 nm) on top of Al/Al2O3 gate electrodes using e-beam lithography. The wires were contacted by thick (100 nm) gold leads. The samples were cleaned in acetone and iso-propanol, descumed with an oxygen plasma, then soaked in a 0.1 mM Mn12-solution containing a catalytic amount of aqueous ammonia (to promote deprotection of the -SAc groups, see Ref. Cornia et al. (2003)) for at least 1 hour. After taking a sample out of the solution it was dried in a nitrogen flux and mounted in a He4 system with a K pot. The bridges were electromigrated in vacuum at room temperature by ramping a voltage across the wire while monitoring the current using a series resistor of 10 . The junctions broke at about 1 V.
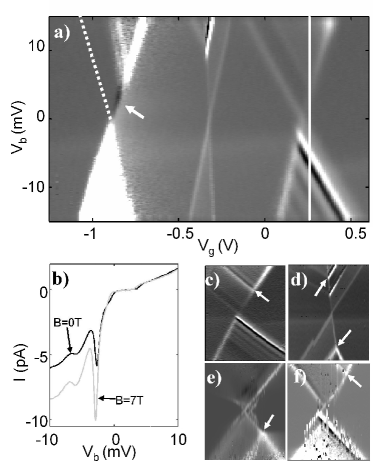
After breaking, the samples were cooled down to K and the junction conductances were measured as a function of gate voltage. Although about 10 of 200 junctions showed Coulomb blockade related features, only four samples were stable enough for detailed measurements Not (b). In Fig. 2(a) we plot the differential conductance as a function of gate () and bias voltage () for one such a device ( K, R=C6H4). The lines separating the conducting regions from the diamond-shaped Coulomb blockade regions have different slopes for the three different charge transport regions. Within orthodox Coulomb blockade theory this implies that the transport regions belong to different quantum dots, since the capacitance to the environment is assumed constant for each dot. However, for molecular quantum dots it is not possible to rule out that these three regions come from three different charge states of the same molecule. Kubatkin et al. found that the charge distribution -and therefore also the capacitance- of a (large) molecule depends on its charge state Kubatkin et al. (2003). In either scenario, however, the current in the non-overlapping transport regions is determined by a single molecule.
Lines in transport regions running parallel to the diamond edges correspond to the onset of transport through excited states of the molecule. We have observed an excitation at meV in all 6 of the stable transport regions that were observed in the four samples. This excitation is indicated with arrows in Fig. 2(c-f) and Fig. 3(a) and appears to be a fingerprint of the molecule. Its origin can be vibrational since the Raman-spectrum is known to exhibit strong peaks beyond this energy, which are associated with vibrations of the magnetic core of the molecule Pederson et al. (2002). A fingerprint is needed since small metal grains that are formed during electromigration can mimic the transport properties of single-molecules Sordan et al. (2005); Houck et al. (2005); Heersche et al. (2006). Moreover, we have studied the electromigration process extensively and found that the gap size can be tuned by the total (on- and off- chip) series resistance van der Zant et al. (2006). A relatively large series resistance () has been used to create a gap larger than nm. Using this technique, we did not measure any conductance up to 1 V in 50 control samples without molecules deposited.
The focus of this paper is on transport features at low-energy ( meV): a region of complete current suppression (CCS) and a strong negative differential conductance (NDC) excitation line in the stability diagrams. Both are visible in Fig. 2(a). At the left degeneracy point in this figure the current is fully suppressed at positive bias voltage above the left diamond edge (dashed line). Transport is restored beyond an excitation that lies at 5 meV. Remarkably, the right diamond edge does continue all the way down to zero bias, defining a narrow strip ( mV wide) where transport is possible. In the right conductive regime in Fig. 2(a), two excitations at an energy of 2 meV and 3 meV are the most pronounced features. The 2 meV excitation is visible as a bright line with positive differential conductance (PDC); the 3 meV excitation as a black line (NDC). The strength of the NDC is clearly visible in the plot in Fig. 2(b).
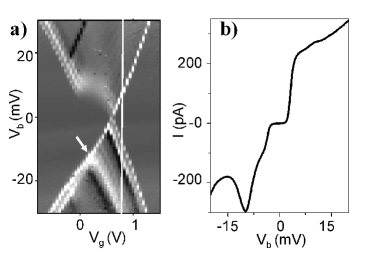
PDC and NDC excitations at 2 meV and 3 meV were also observed in a different device, see Fig. 3. Although the details of CCS and NDC varied from sample to sample, these two features were consistent signatures of measurements in Mn12. In all cases, the 14 meV excitation is visible, suggesting that this feature originates in the core of the molecule (which would not be so strongly affected by lead geometry). We emphasize that we never observed low-energy features in bare gold samples or in samples with other molecules deposited despite measuring over one thousand junctions in total.
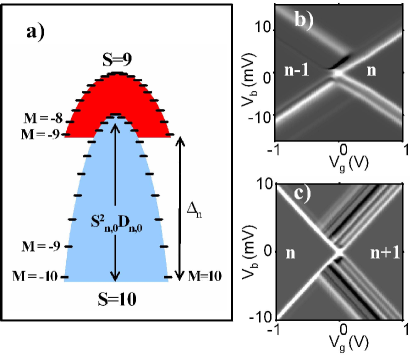
The observations of CSS and NDC lines at low energy that are characteristic of our Mn12 measurements do not follow in a straightforward way from conventional Coulomb blockade theory. This discrepancy should not be surprising, however, because Coulomb blockade transport processes in a high-spin quantum dot (or molecule) have not yet been been worked out in the literature. For qualitative comparison to the experimental data, we have developed a standard sequential tunneling model that incorparates the spin-Hamiltonian description of the high-spin ground state of Mn12 and its ladder of spin excited states (see Fig. 4). Both the total spin of the molecule and its projection on the intrinsic anisotropy axis of the molecule (the -axis) are taken into account.
This model provides one explanation for the observed NDC excitation and CCS. Briefly: the spin-selection rules apply to adding or subtracting an electron. Spin states of the molecule which differ by more than from the ground states are accessible via subsequent tunnel processes, but only if each step in the sequence is energetically allowed. A sequence of tunnel processes can result in a non-equilibrium population of certain excited states that can only be depopulated slowly by a violation of the spin-selection rules induced by QTM. Transport is then hindered or blocked at sufficiently low temperatures leading to NDC or CCS.
Our calculations (see Fig. 4) take as a starting point the basic spin-Hamiltonian for a SMM in charge state ( neutral, oxidized, reduced) and two -states for each charge state (energy splitting ) and total spin :
| (1) |
where is an anisotropy constant and the lowest order QTM perturbation due to deviations from perfect axial symmetry. For this Hamiltonian gives rise to a ladder consisting of the different states, see Fig. 4(a). The states are degenerate ground states of the molecule and are separated by the magnetic anisotropy barrier (MAB). Transition rates between spin states upon adding or subtracting an electron are determined by Clebsch-Gordan coefficients and spin selection rules. We consider weak QTM (small ) where this picture is still correct up to weak violations of the spin-selection rules which are taken into account. Electronic- and spin-excitation relaxation rates are assumed to be much smaller than the tunnel rates Wernsdorfer et al. (2000).
Measurements show that the MAB of the neutral Mn12 molecule equals 5.6 meV Not (a). Recently, it has been demonstrated that the first excited spin state in a neutral Mn12 derivative has and lies about =4 meV above the ground state Petukhov et al. (2004), as theoretically predicted by Park et al. Park and Pederson (2004). Little is known about positively- or negatively- charged Mn12 clusters Park and Pederson (2004), except that one-electron reduced species have a ground state and a lower MAB Chakov et al. (2005). We therefore have performed calculations for various values of the remaining parameters and found that NDC and CCS are generic features whenever (i) the MAB is charge state dependent (ii) the spin multiplets within a charge state overlap in energy ().
An example of CCS obtained from calculations is indicated in Fig. 4(b) for the transition and parameters listed in Ref. Not (c). In contrast to conventional spin-blockade, the current is not blocked in the narrow region where only the ground states of the molecule are accessible. This is also observed experimentally. Excitations with NDC are obtained for the transition (see Fig 4(c)). The mechanism is similar as for CCS, but requires a lower MAB of the charged ground state spin multiplet Not (c). It is important to note that other parameter choices also give rise to CSS and NDC, so that a quantitative comparison cannot be made at the moment.
Other explanations for NDC excitations and CCS have also been considered. Both intrinsic and extrinsic (i.e. properties of the leads) properties could result in the observation of NDC. The observation of an NDC excitation in different samples implies that it results from an intrinsic property of the molecule, such as vibrational excitations. In some rather special situations they are also predicted to result in NDC Koch and von Oppen (2005); Wegewijs and Nowack (2005); Nowack and Wegewijs (2004); Zazunov et al. . A CCS feature of the type observed here, however, has not been reported. Our model naturally gives rise to CCS and NDC due to the intrinsic properties of the magnetic molecule: charge induced distortion of the magnetic parameters and low-lying magnetic and spin-excitations.
The low-energy features of the different transport regions in Fig. 2(a) are not identical, possibly because they correspond to different charge state transitions. In addition, the (magnetic) parameters may be effected by the different coupling to the electrodes. Since the lines in the transport regions correspond to sequences of transitions rather than to a single excitation, the pattern is sensitive to variations of the magnetic parameters (and other parameters like temperature and tunnel coupling).
The effect of a magnetic field in our transport situation is much less obvious than in magnetic measurements on ensembles of molecules. Firstly, the angle of the external field with respect to the easy axis of the molecule is unknown and cannot be controlled in our experimental setup. A transverse field leads to mixing of spin eigenstates, allowing transitions which are inhibited due to spin selection rules in the absence of a field, whereas a longitudinal field will only shift the energies of the states. However, estimates for the anisotropic g factors in the charge states are required to extend our basic model. Furthermore, the electron tunnel couplings can be modified by the field. The increase of the current upon applying a magnetic field, Fig. 2(b), may be related to all of the above effects but a full analysis of the magnetic field effects is beyond the scope of the present paper.
In conclusion, we have measured transport through single Mn12 molecules that are weakly coupled to gold electrodes. Current suppression and negative differential conductance on the energy scale of the anisotropy barrier have been observed. These features can be understood qualitatively with a model, that combines the spin properties of the molecule with standard sequential tunneling theory. These results provide a new direction in the study of single-molecule magnets and possibly lead to electronic control of nano-magnets.
HBH thanks H. Park’s research group (Harvard) for their help and CR and MRW thank H. Schoeller and J. Kortus for discussions. This work was supported by FOM, NWO (HBH, ZdG, HSJvdZ), Pappalardo Postdoctoral Fellowship (JAF), the EU-RTN program on spintronics (MRW), the HP Program RTN-QUEMOLNA, NOE”MAGMANET”, and Italian MIUR (LZ, AC).
References
- Park et al. (2002) J. Park et al., Nature 417, 722 (2002).
- Liang et al. (2002) W. Liang et al., Nature 417, 725 (2002).
- Kubatkin et al. (2003) S. Kubatkin et al., Nature 425, 698 (2003).
- Park et al. (2000) H. Park et al., Nature 407, 57 (2000).
- Yu et al. (2004) L. H. Yu et al., Phys. Rev. Lett. 93, 266802 (2004).
- Pasupathy et al. (2005) A. N. Pasupathy et al., Nano Lett. 5, 203 (2005).
- Sessoli et al. (1993) R. Sessoli, D. Gatteschi, A. Caneschi, and M. A. Novak, Nature 365, 141 (1993).
- Not (a) See EPAPS Document No. [number will be inserted by publisher] for more information on the synthesis and analysis of the Mn12 (R=C6H4) samples.
- Gatteschi and Sessoli (2003) D. Gatteschi and R. Sessoli, Angew. Chem. Int. Ed. 42, 268 (2003).
- Friedman et al. (1996) J. R. Friedman, M. P. Sarachik, J. Tejada, and R. Ziolo, Phys. Rev. Lett. 76, 3830 (1996).
- McInnes et al. (2002) E. J. L. McInnes et al., J. Am. Chem. Soc. 124, 9219 (2002).
- Cavallini et al. (2005) M. Cavallini et al., Angew. Chem. Int. Ed. 44, 888 (2005).
- Mannini et al. (2005) M. Mannini et al., Nano Lett. 5, 1435 (2005).
- Kim et al. (2004) K. Kim et al., Appl. Phys. Lett. 85, 3872 (2004).
- Kim and Kim (2004) G.-H. Kim and T.-S. Kim, Phys. Rev. Lett. 92, 137203 (2004).
- Weinmann et al. (1995) D. Weinmann, W. Häusler, and B. Kramer, Phys. Rev. Lett. 74, 984 (1995).
- Hüttel et al. (2003) Hüttel et al., Eur. Phys. Lett. 62, 712 (2003).
- Cornia et al. (2003) A. Cornia et al., Angew. Chem. Int. Ed. 42, 1645 (2003).
- Park et al. (1999) H. Park et al., Appl. Phys. Lett. 75 (1999).
- Not (b) The yield was similar for both types of derivatives. Two of the stable samples where obtained with the R=C15H30 derivative.
- Pederson et al. (2002) M. R. Pederson, N. Bernstein, and J. Kortus, Phys. Rev. Lett. 89, 097202 (2002).
- Sordan et al. (2005) R. Sordan, K. Balasubramanian, M. Burghard, and K. Kern, Appl. Phys. Lett. 87, 013106 (2005).
- Houck et al. (2005) A. A. Houck et al., Nano Lett. 5, 1685 (2005).
- Heersche et al. (2006) H. B. Heersche et al., Phys. Rev. Lett. 96, 017205 (2006).
- van der Zant et al. (2006) H. van der Zant et al., Faraday discussions 131, 347 (2006).
- Wernsdorfer et al. (2000) W. Wernsdorfer et al., Eur. Phys. Lett. 50, 552 (2000).
- Petukhov et al. (2004) K. Petukhov et al., Phys. Rev. B 70, 054426 (2004).
- Park and Pederson (2004) K. Park and M. R. Pederson, Phys. Rev. B 70, 054414 (2004).
- Chakov et al. (2005) N. Chakov et al., Inorg. Chem. 44, 5304 (2005).
- Not (c) Model parameters (energies in [meV]) , and . Parameters for CCS: , , , , and K. Parameters for NDC: , , , , , and K. The NDC strength can only be reproduced for a temperature lower than the experimental one in Fig. 2, 3.
- Koch and von Oppen (2005) J. Koch and F. von Oppen, Phys. Rev. Lett. 94, 206804 (2005).
- Wegewijs and Nowack (2005) M. R. Wegewijs and K. C. Nowack, Focus on NEMS (New J. Phys., 2005), vol. 7, p. 239.
- Nowack and Wegewijs (2004) K. C. Nowack and M. R. Wegewijs (2004), cond-mat/0506552.
- (34) A. Zazunov, D. Feinberg, and T. Martin, cond-mat/0510066.