Fermi Velocity Spectrum and Incipient Magnetism in TiBe2
Abstract
We address the origin of the incipient magnetism in TiBe2 through precise first principles calculations, which overestimate the ferromagnetic tendency and therefore require correction to account for spin fluctuations. TiBe2 has sharp fine structure in its electronic density of states, with a van Hove singularity only 3 meV above the Fermi level. Similarly to the isovalent weak ferromagnet ZrZn2, it is flat bands along the K-W-U lines of hexagonal face of the fcc Brillouin zone make the system prone to magnetism, and more so if electrons are added. We find that the Moriya coefficient (multiplying in the fluctuation susceptibility ) is divergent when the velocity vanishes at a point on the Fermi surface, which is very close (3 meV) to occurring in TiBe2. In exploring how the FM instability (the =0 Stoner enhancement is ) might be suppressed by fluctuations in TiBe2, we calculate that the Moriya A coefficient (of ) is negative, so =0 is not the primary instability. Explicit calculation of shows that its maximum occurs at the X point ; TiBe2 is thus an incipient antiferromagnet rather than ferromagnet as has been supposed. We further show that simple temperature smearing of the peak accounts for most of the temperature dependence of the susceptibility, which previously had been attributed to local moments (via a Curie-Weiss fit), and that energy dependence of the density of states also strongly affects the magnetic field variation of .
pacs:
Valid PACS appear hereI Introduction
The cubic Laves compound TiBe2 was already shown forty years ago to have quite unusual behavior of the magnetic susceptibility and the Knight shift.saji showed a strong increase with lowering temperature but a clear deviation from Curie-Weiss form, while the Knight shift was temperature dependent and negative. The magnetic properties of TiBe2 have been controversial since Matthias et al.matthias interpreted the susceptibility peak at 10 K in TiBe2 as itinerant antiferromagnetism (AFM) with an associated magnetic moment of 1.64, and Stewart et al. reported a transition at 2 K that seemed characteristic of magnetic ordering.
However, a clear picture has emerged gradually after the idea of weak itinerant antiferromagnetism had been abandoned because of the subsequent lack of experimental evidencerak ; takagi . Many experiments have shown that TiBe2 is instead a strongly enhanced paramagnet acker ; monod ; shaltiel and undergoes a metamagnetic transitionrhodes ; wohlfarth ; acker2 (field-driven ferromagnetism) around 5.5 T. Also one can see similarity to the magnetic behavior of Ni3Ga by comparing the values of the low temperature susceptibility, emu/mole for Ni3Gaschinkel and emu/mole for TiBe2matthias . Based on the magnetization data of Monod et almonod Wohlfarthwohlfarth suggested the transition at 5.5 T should be first order. Wohlfarth’s considerations received at least partial support from theoretical band-structure considerations coupled with the de Haas-van Alphen data of van Deursen et aldeursen .
Clarity began to arise with the extensive experiments of Acker et al. who interpreted their magnetization dataacker in fields to 21T and the magnetization data of Monod et al. monod as evidence for exchange-enhanced paramagnetism or spin fluctuations in TiBe2. They found the system TiBe2-xCux to become FM at a critical concentration . Stewart et al.stewart measured the specific heat of TiBe2 (mJ/mole K2) at low temperature in 0 and 7T and interpreted the behavior as evidence of spin fluctuations.
The isoelectronic isostructural material ZrZn2 is considered a classic example of an weak itinerant ferromagnet. Magnetic measurements find very small magnetic moments (values from 0.12 to 0.23 )ZrZn1 ; ZrZn2 , hence the characterization as a weak ferromagnet. The magnetization of ZrZn2 increases substantially with field, but unlike TiBe2 with its metamagnetic transition, the increase continues smoothly to fields as high as 35 T. The Curie temperature TC drops approximately linearly with pressure, from 29 K at to 4K at kbar, which extrapolates to a quantum critical point (QCP) at kbar. The report of superconductivity coexisting with ferromagnetism in ZrZn2 near this QCPPfleiderer enlivened both theoretical and experimental attention, but more recently it has been shownsurfaceSC there is no bulk superconductivity. TiBe2, on the other hand, has been nearly addressed only rarely for the past twenty years.
The complex temperature-field behavior of TiBe2 has led to many speculations about the microscopic mechanisms. Of course spin fluctuations play a central part, and the highly enhanced susceptibility suggests this system is near a quantum critical point (at slightly enlarged lattice constant, say, as well as for the Cu alloying). If FM fluctuations dominate, then a metamagnetic transition (field-driven FM state) around 5 T would make sense. If AFM fluctuations dominate, application of a field suppresses the fluctuations, providing another way to interpret specific heat under applied field.stewart2 The anomalies in the conduction electron spin resonance (CESR) linewidthioshpe around 2 K have been interpreted in terms of a thermal spontaneous magnetism,theory and a decrease in the resistivity is also seen at that temperature.acker All of these scenarios are sensitive to the Fermi surface shape, velocity spectrum, and possibly the energy dependence of the density of states near the Fermi energy, and it is these questions that we address in this paper.
Band structure intricacies by themselves also can come into play. Shimizu showedtheory that an independent electron system with magnetic coupling can undergo a first-order transition to a “spontaneous thermal magnetism” state (within a range ) if it is highly enhanced and if the Fermi level lies within a local minimum in the density of states. The effects of magnetic fluctuations should of course be addedmoriyaueda to the free energy of both the ordered and disordered phases to make this treatment more realistic.
Local density approximation (LDA) energy band studies of TiBe2 have been reported previously freeman1 ; freeman2 ; groot . Those studies revealed a split narrow peak in in the density of states (DOS) N(E) near the Fermi energy (EF), with calculated Stoner factors greater than unity, giving the Stoner instability to FM. Here is the Stoner exchange interaction averaged over the Fermi surface. Thus, as for a few cases that have come to light more recently,djs1 ; djs2 ferromagnetism is incorrectly predicted, indicating the need to account for magnetic fluctuations not included in LDA that will suppress magnetic ordering. By comparing the calculated value of N(EF) with the measured susceptibility, a Stoner enhancement S = [1 - ] 60 was obtained, making TiBe2 a more strongly exchange enhanced metal than Pd.
All of these calculations, carried out 25 years ago, used shape approximations for the density and potential, and for a detailed investigation of the weak ferromagnetism precise electronic structure methods are required. In this work, the precise self-consistent full potential linearized-augmented-plane-wave (FLAPW) method and full potential local orbital minimum basis band structure scheme (FPLO) are employed to investigate thoroughly the electronic and magnetic properties of TiBe2 based on the density functional theory. We compared and checked the calculation results of the both methods. We consider the effect of magnetism on the band structure and Fermi surface, Fermi velocity and compare with experiment and previous band calculations.
II Crystal Structure
TiBe2 crystallizes into a cubic Laves phase C15 crystal structure. The C15 (AB2 ) structure is a close packed structure and the site symmetry is high for the two constituents. Ti atoms occupy the positions of a diamond sublattice while the Be atoms form a network of interconnected tetrahedra, with two formula units per cell. Since the major contributions to come from Ti, the local environment of Ti atoms is particularly important to keep in mind. Each Ti is surrounded by 12 Be neighbors at a distance of 2.66 and tetrahedrally by four Ti neighbors a distance 2.78 away. The TiBe2 structure belongs to the Fd3m space group with Ti occupying the site, and Be the site. The site symmetry of Ti is (tetrahedral) and Be has site symmetry. The atomic positions are symmetry determined, and we used experimental lattice constant 6.426 for all calculations.
III Method of Calculations
We have applied the full-potential nonorthogonal local-orbital minimum-basis (FPLO) scheme within the local density approximation (LDA).koepernik In these scalar relativistic calculations we used the exchange and correlation potential of Perdew and Wang.perdew Ti states and Be were included as valence states. All lower states were treated as core states. We included the relatively extended semicore states of Ti as band states because of the considerable overlap of these states on nearest neighbors. This overlap would be otherwise neglected in our FPLO scheme. Be 3d states were added to increase the quality of the basis set. The spatial extension Of the basis orbitals, controlled by a confining potential , was optimized to minimize the total energy.
The self-consistent potentials were carried out on a mesh of 50 k points in each direction of the Brillouin zone, which corresponds to 3107 k points in the irreducible zone. A careful sampling of the Brillouin zone is necessary to account carefully for the fine structures in the density of states near Fermi level EF. For the more delicate numerical integrations, band energies were extracted from FPLO in an effective mesh of 360 k points in each direction. A separate tool was developed to extract energy isosurfaces with gradients from the scaler energy grid. The isosurfaces were then used to calculate density of states and velocity moments.
To check carefully the fine structure that we will discuss, we also repeated several calculations with the general potential linearized augmented plane wave (LAPW) method,singh as implemented in the WIEN2K code.wien Relativistic effects were included at the scalar relativistic level. However, we verified that the magnetic moment with the experimental structure is not sensitive to the inclusion of the spin-orbit interaction. For the generalized gradient approximation (GGA) calculations, we used the exchange-correlation functional of Perdew, Burke, and Ernzerhof. burke We choose the muffin-tin spheres a.u. for Ti, a.u. for Be and a basis set determined by a plane-wave cutoff of , which gives good convergence. The Brillouin zone samplings were done using the special k point method with 1280 points in the irreducible zone.
IV Results and Discussions


For orientation we first show the full nonmagnetic band structure of TiBe2 in Fig. 1, which is consistent with earlier calculations of freeman1 ; freeman2 ; groot . The Be bands lie between -8 eV and -2 eV. Above them the bands are of mixed character, centered on the Be as well as the Ti site. Near the Fermi level there are several bands with weak dispersion, being of primarily Ti character. The bands at K and L are hybridized strongly, while at X the character is the main character. As noted also by Jarlborg and Freeman,freeman1 ; freeman2 one band at L falls extremely close to EF (3 meV below). This band is doubly degenerate along -L, and the L point forms the maximum of band 15 and a saddle point for band 16. As the Fermi energy rises (for added electrons, say) the Fermi surface sweeps through the L point saddle, where the band has a vanishing velocity by symmetry. This vanishing velocity is discussed below. There is another doubly degenerate band very near Ef at the W point.
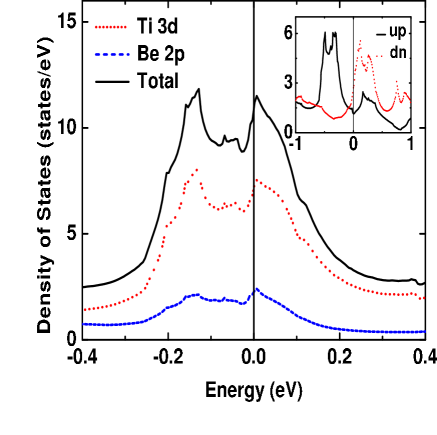
The density of states (DOS) is shown near EF in Fig. 3. The Fermi energy falls extremely close to the edge of a very narrow peak in the DOS. The DOS peak arises from Ti bands hybridized with Be states. Flat bands close to Fermi level centered mostly in regions near the L-W-U and W-K directions, i.e. the hexagonal faces of the Brillouin zone, cause the sharp peak. Stewart et al.stewart measured the linear specific heat coefficient for TiBe2 of =42 mJ/K2 mole-formula unit. The calculated value of =5.33 states/eV/f.u. for TiBe2 corresponds to a bare value =12.6 mJ/K2 mole(formula unit), leading to a thermal mass enhancement 1+=3.3, or =2.3 arising from phonons, magnetic fluctuations, and Coulomb interactions.
Density functional calculations are usually reliable in calculating the instability to ferromagnetism. The enhanced susceptibilityjanak is given by
| (1) |
where is the bare susceptibility obtained directly from the band structure and is the Stoner exchange interaction constant. Here N(EF) refers to both spins, and hence forward we quote susceptibility in units where . The calculation of is from fixed spin moment calculationsmohn , in which the energy is calculated subject to the moment being constrained to be . The behavior at small is from which eV can be extracted from Eq. 1. This value of gives , larger than unity and very close to that calculated earlier,freeman2 corresponding to a Stoner ferromagnetic instability.
As for a few other compounds, TiBe2 is incorrectly predicted by LDA to be ferromagnetic. Since spin-orbit coupling is small in magnets, we neglect it, so the direction of magnetic polarization is not coupled to the lattice. We have calculated a consistent magnetic moment for TiBe2: /f.u.(FPLO, LDA), /f.u.(LAPW, LDA), /f.u.(LAPW, GGA). This value is considerably larger than an earlier calculationfreeman1 (which also reported a much smaller value for ZrZn2 than obtained from more recent calculationsmazin ). We address the overestimate of the tendency to magnetism below.
IV.1 Fermi Surface and Fermi Velocity
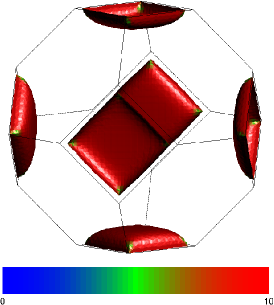
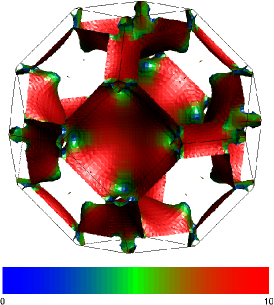
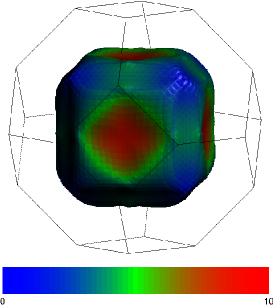
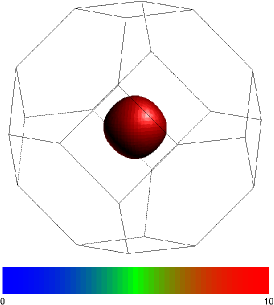
In Fig. 4 we show the nonmagnetic Fermi surfaces shaded by the Fermi velocities. The position of near L and W points sensitively determine the exact shape of some Fermi surfaces. The shapes can be characterized as (a) small -centered electron sphere from band 17, (b) large -centered electron pseudocube from band 16, (c) multiply connected surface mostly enclosing holes around the X point from band 15, which we refer to as the jungle gym, and (d) flat hole pillows centered at each of the three X points. The doubly degenerate bands crossing EF along -X and X-W guarantee touching of certain surfaces along these lines.
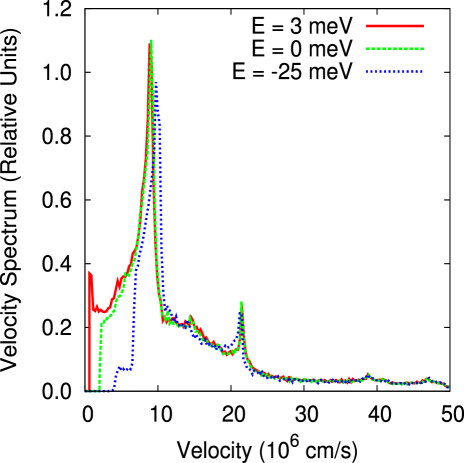
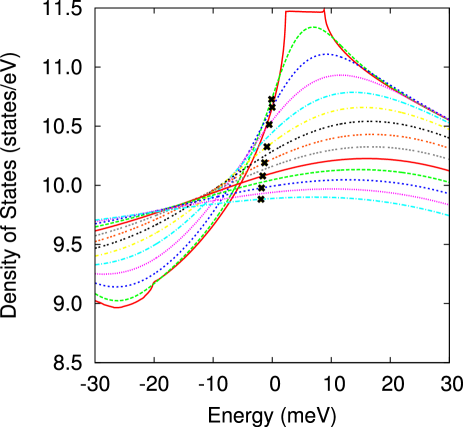
The DOS peak at and above EF is due to the band near the L point where the cube-shaped surfaces are about to form bridging necks. Figure 5 shows how the Fermi velocity spectrum changes with energy at the peak just above , at , and at the first minimum below . The Fermi velocity spectrum is defined as
with normalization . Here is the line of intersection of the constant energy surface with the constant velocity surface . The gradient of the velocity in the denominator makes this distribution delicate to calculate accurately. was calculated numerically by extracting a triangulated energy isosurface from the band structure, then obtaining a velocity histogram of the states associated with the isosurface.
The spectrum in Fig. 5 shows, at EF, velocities extending down to the very low value of 2 cm/s, and up to 5 cm/s, a variation of a factor of 25. Roughly half of the weight lies below cm/s. At the van Hove singularity at +3 meV, the only noticeable difference is additional velocities extending down to zero due to the vanishing velocity at L (we have not worried about reproducing the behavior precisely). At -25 meV, which is just below the narrow peak at EF, the strong weight in the spectrum appears only at 7 cm/s. Note that there is very little change in the high velocity spectrum over small changes in energy.
V Analysis of Velocity Distribution and Susceptibility
V.1 Renormalization due to Spin Fluctuations
Following the work of Larson, Mazin, and SinghMSA_Pd for Pd which builds on Moriya theory, we first attempted to identify the relevant band characteristics in order to evaluate the spin fluctuation reduction of in TiBe2. For this, one begins with the bare susceptibility in the small and small limit, given by
| (3) |
while the screened susceptibility using the RPA approximation is given by
| (4) |
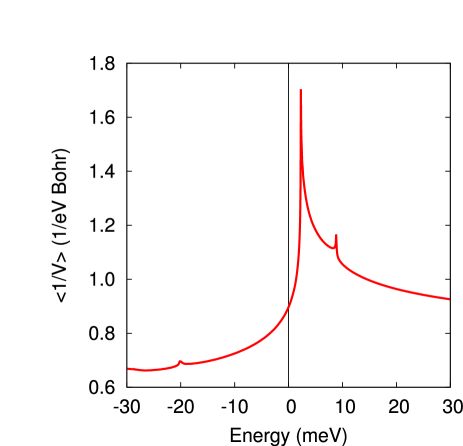
The Moriya parameter , expressed in dimensionless form here, and mean inverse Fermi velocity (the second Moriya parameter, discussed below) are derived from velocity moments and DOS of the band structure, and like the density of states, they are greatly influenced by the Fermi surface topology and its velocity spectrum. Specifically, changes in topology which give rise to points of zero velocity in the band structure near the Fermi surface become an important factor. The mean inverse Fermi velocity which governs the imaginary part of is given by
| (5) |
evaluated at EF. The difference between and 1/ is one measure of the velocity variation of the Fermi surface. The bottom or top of a three-dimensional band (corresponding to the appearance or vanishing of a Fermi surface) gives only a discontinuity proportional to the square of the band mass. At a saddle point, such as the merging of the corners of the pseudocube Fermi surfaces, undergoes a divergence because the associated Fermi surface area does not vanish. This “van Hove singularity” in is evident for the band edge 3 meV from EF in TiBe2 in Fig. 6. We calculated 1/ 106 cm/s for TiBe2.
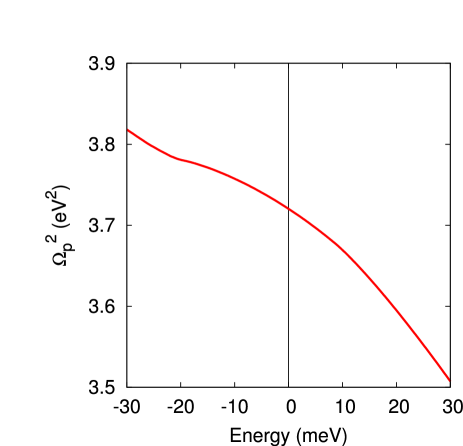
For cubic structures, the parameter in Eq. 3 is given by
| (6) | |||||
Thus it is proportional to the second derivative of the square of the Drude plasma energy (i.e. is absorbed into , so here explicitly has energy units; sums are understood to be normalized over the zone). The second moment of velocity is finite everywhere, but its second derivative is not (for example, for free electrons this diverges as the band edge). Derivatives have the unfortunate property of amplifying noise in numerical evaluations. We have addressed the noise issue by using a large number of k points in the numerical integration (360 360 360). By fitting with a polynomial near the Fermi energy, we obtain the above-mentioned value . The Fermi velocity was calculated to be eV bohr = 1.8 cm/s.
V.2 q-dependent Susceptibility
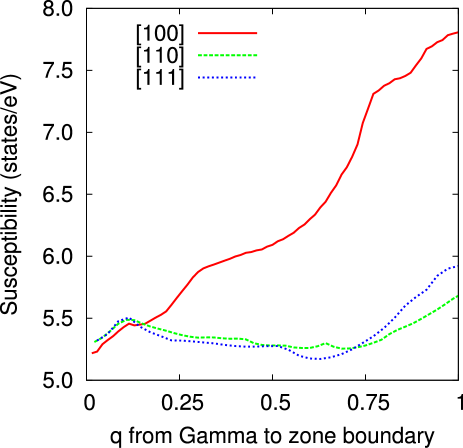
The negative value of the parameter indicates, from Eq. 3, that the primary magnetic instability in TiBe2 does not lie at =0 but rather at finite , so it is more susceptible to AF instability (including possibly a spin spiral) rather than ferromagnetic. The sign of has been verified independently by explicit calculation of the real part of , with results shown in Fig. 7.
The calculation of between bands and was performed by an isosurface slicing method. The susceptibility can be written, after inserting a factor , as
| (7) | |||||
where is a susceptibility density calculated from the isosurface defined by the Fermi functions and the energy function. The Brillouin zone was divided into a grid of cubes. Within each cube the integral is calculated as a discrete sum, using variable step sizes in corresponding to 1/30 of the maximum difference in energies within the cube.
The susceptibility rises equally along all three symmetry directions (as required by cubic symmetry), but only for along the cubic axis does continue to increase strongly beyond the small- region. The maximum of occurs at the X point, where the intraband part has increased by nearly 50% over its =0 value. In such cases where =0 is not the maximum, it is necessary to apply the extension of weak ferromagnets to the AF case.weakAF
The band-by-band contributions to have been evaluated both to verify the code and to identify the source of the important contributions and structures. The sphere FS gives rise to a Lindhard type form with 2 (but is not perfectly round). The pillows lead to a cusp for for , and along all three directions decreases for . For the jungle gym and the pseudocube, increases by a factor of two at the zone boundary along , with much less variation in the other two directions. The contributions to N(EF) from each of the bands is: sphere, 1.4%; pillows, 7%; jungle gym, 33%; pseudocube, 58%.
Away from =0 the interband contributions to contribute, and it is known in other transition metals and their compounds that the -dependence of matrix elements can be important. We have calculated also the interband for several bands around the Fermi level, finding that they contribute a broad maximum at intermediate . It seems unlikely, however, that interband contributions will move the maximum away from the X point.
Peaking of at the zone boundary implies a short wavelength AF instability (incipient, since no AF phase is observed). With the fcc lattice and two Ti atoms in the primitive cell, there several possibilities for the most unstable mode, which will involve antialignment of spins or charge density wave variation, but also may involve noncollinear alignment of the spins. We have tried to obtain a AF state within LDA, with atomic moments antialigned on the bipartite Ti lattice, but the moment vanished when this was tried. We have not investigated possible = X point AF states.
V.3 Temperature Dependence of Susceptibility
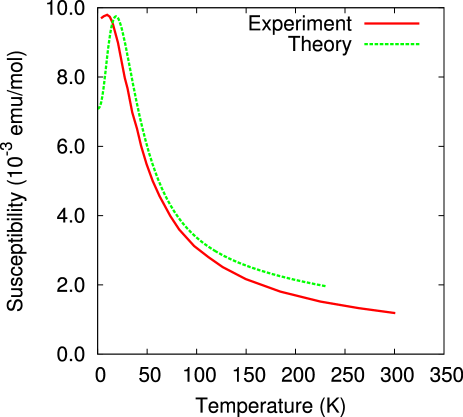
The high narrow peak in the DOS near EF suggests an explanation of the T-dependence of mentioned in the Introduction, or at least part of it. To understand what part arises from simple thermal smearing, we have evaluated
| (8) |
where the chemical potential is adjusted at each temperature to keep the number of electrons (occupied states) constant. The result is shown as a series of curves for T ranging from zero to 300 K. It is necessary to include the variation in , and the value of decreases by 8%.
The resulting change in the physical, enhanced susceptibility is given by
| (9) |
Adjusting I to reproduce the peak height (at 10 K, experimentally), which requires I=0.183 eV (=56 at the maximum of ), the resulting enhanced is compared with the data in the lower panel of Fig. 8. It is evident that this simple temperature smearing accounts for much of the observed temperature dependence. Additional indirect temperature smearing will come from phonons and from electronic and magnetic interactions as these excitations are increasingly excited upon raising the temperature. We conclude that TiBe2 contains no appreciable contribution to the susceptibility from local moments.
V.4 Field Dependence of Susceptibility
For an energy-dependent DOS and a highly enhanced susceptibility, a field-dependent susceptibility is expected. In TiBe2 a strong effect of this kind has been seen, which can be characterized as field-driven ferromagnetism. The differential susceptibility where is given by the difference in electron occupations . A many-body treatment shows that the spin imbalance can be expressedwepPRL in terms of the spin-dependent thermal (energy E surface averaged) Green’s function
| (10) | |||||
here is the fermionic Matsubara discrete energy variable and is a positive infinitesimal. The simplest form of (Stoner) self-energy should be appropriate ().
Taking the field derivative of but keeping H finite, and using (in this approximation)
| (11) |
we obtain the result at zero temperature
This clearly reduces to the usual T=0 result at H=0. A slightly better treatment would have also some H-dependence of S due to the structure in and the delicate situation here that is approaching unity, but at this point we neglect such details.
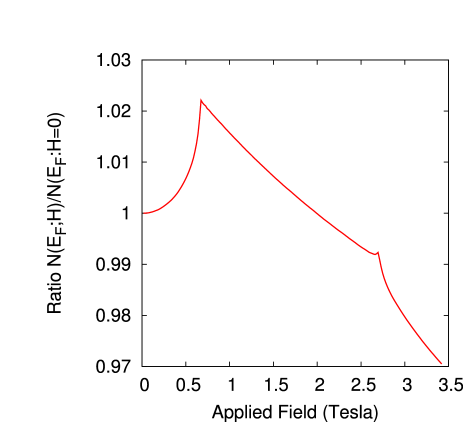
The result for the relative correction
| (13) |
is shown in Fig. 9. The effect on the ratio (thus on the differential susceptibility) is clear, however even with the factor of S=60 enhancement of the energy scale () the peak occurs at a field one order of magnitude smaller than seen in experiment. This difference seems to indicate that the field influence on the spin fluctuations dominates; however the variation in N(E) will need to be accounted for in any quantitative explanation.
VI Summary
The complex and sometimes confusing data on the enhanced paramagnet were discussed in the Introduction. It seems clear that magnetic fluctuations will be required to understand the underlying mechanisms. Here we have presented a precise calculation and analysis of the electronic structure, especially focusing on the Fermi surfaces and velocity spectrum at and near the Fermi level that underlies not only the single particle excitations but also the spectrum of magnetic fluctuation in the itinerant limit, which clearly seems to be the case in TiBe2.
Our calculations have confirmed the sharp structure in the density of states around the Fermi level that had been noted earlier, and quantified the tiny energy scale that is involved: the Fermi level lies in a region of steep DOS, just 3 meV from an abrupt van Hove singularity. This singularity is derived from a doubly degenerate band at the L point of the zone. We have shown how to calculated the spectrum of velocities (speeds) over the Fermi surface, and find the spectrum to be peaked at (the low value of) cm/s, with much of the weight below that value. Moriya theory for weak ferromagnets requires, for the imaginary part of the inverse susceptibility, the moment ; we have illustrated that diverges at the van Hove singularity signaling possible problems with applying Moriya theory to TiBe2.
Moriya theory for weak ferromagnets also requires the dimensionless quantity at the Fermi energy, where is the conventional transport Drude energy. We find that this quantity is not positive, as it must be for an incipient ferromagnet; rather it is negative indicating the dominating (nearby) magnetic instability is finite : antiferromagnetic, spin wave, spin spiral, etc. Direct calculation of the generalized susceptibility confirms the sign of , and reveals the dominant instability to lie at the X point of the Brillouin zone, making TiBe2 an incipient antiferromagnet.
We have shown that the sharp structure in has other consequences. First, it leads to a T-dependent chemical potential. Together with the temperature broadening of and the Stoner enhancement , this simple temperature broadening can account for most if not all of the temperature dependence of the susceptibility, which some investigators had interpreted as Curie-Weiss-like. As a result, the occurrence of local moments in TiBe2 can be ruled out. Similarly, we have shown that this sharp structure in , again together with the large Stoner enhancement, has a substantial effect on the field-dependence of the differential susceptibility. There is still the question of how much of the measured field dependence is due to this induced exchange splitting, and how much is due to the effect of the field on the magnetic fluctuations.
Many of the results we have obtained here are strongly dependent on details of the band structure and the position of the Fermi level. That these results reflect realistically the mechanisms underlying the many fascinating observations obviously requires that the band structure formalism is applicable in detail to such systems and that the calculations are accurate. Another requirement is that of high sample quality, that the stoichiometry is precise and that defect concentration must be very low (simple impurity broadening will affect behavior). These questions must be addressed in deciding whether to press onward to a more complete and more challenging explanation that includes effects of both magnetic fluctuations and the energy dependence of the density of states.
VII Acknowledgments
We acknowledge illuminating communication with Z. Fisk, I. I. Mazin, G. R. Stewart, and D. J. Singh about weak ferromagnetism and materials issues. This work was supported by DOE grant DE-FG03-01ER45876.
References
- (1) H. Saji, T. Yamada ya and M. Asama, J. Phys. Soc. Jpn. 21, 255 (1966).
- (2) B. T. Matthias, A. L. Giorgi, V. O. Strobing, and J. L. Smith, Phys. Lett. 69, L441 (1978).
- (3) V. C. Rakhecha, G. P. Fletcher, S. K. Singh, J. L. Smith and B. T. Matthias, Solid State Comm. 33, 495 (1980).
- (4) S. Teacake, H. Asoka, C. Y. Huang, and J. L. Smith, J. Phys. Soc. Jpn. 50, 2137 (1981).
- (5) F. Acker, Z. Fisk, J. L. Smith and C. Y. Huang, J. Magn. Magn. Mater.22, 250 (1981).
- (6) P. Monod, I. Felner, G. Ghouteau, and D. Shaltiel, J. Phys. Lett. 41, L551 (1980).
- (7) D. Shaltiel, P. Monod, and L. Felner, J. Phys. Lett. 41 L-567 (1980).
- (8) E. P. Wohlfarth and P. Rhodes, Philos.Mag. 7, 1817 (1962).
- (9) E. P. Wohlfarth, J. Magn. Magn. Mater. 20, 77 (1980).
- (10) F. Acker, R. Huguenin, M. Pelizzone, and J. L. Smith, Phys. Rev. B 24, 5404 (1981).
- (11) C. J. Shinkel, F.R.de Boer and B.de Hon J. Phys. F 3, 1463 (1973).
- (12) A. P. J. van Deursen, A. R. de Vroomen and J. L. Smith, Solid State Commun. 36, 305 (1980).
- (13) G. R. Stewart, B. T. Matthias, A. L. Giorgi, E. G. Szklarz, and J. L. Smith. Solid. State. Comm 30, 709 (1979). The structure in the specific heat at 2 K was an experimental artifact (G. R. Stewart, private communication).
- (14) G. S. Knapp, F. Y. Fradin, and H. V. Culbert J. Appl. Phys.42, 1341 (1971).
- (15) P. G. Mattocks, D. Melville, J. Phys. F: Metal Phys.8, 1291 (1978).
- (16) C. Pfleiderer, M. Uhlarz, S. M. Hayden, R. Vollmer, H. v. Lohneysen, N. R. Bernhoeft and C. G. Lonzarich, Nature 412,58 (2001).
- (17) E. A. Yelland, S. M. Hayden, S. J. C. Yates, C. Pfleiderer, M. Uhlarz, R. Vollmer, H. v. Lohneysen, N. R. Bernhoeft, R. P. Smith, S. S. Saxena, and N. Kimura, cont-mat/0502341.
- (18) G. R. Stewart, J. L. Smith, and B. L. Brandt, Phys. Rev. B 26, 3783 (1982).
- (19) D. M. Ioshpe, Mod. Phys. Lett. B 5, 721 (1991).
- (20) M. Shimizu, Proc. Phys. Soc. 86, 147 (1965).
- (21) T. Moriya and K. Ueda, Ref. Prof. Phys. 66, 1299 (2003).
- (22) T. Jarlborg, A. J. Freeman and D. D. Koelling. J. Magn. Magn. Mater. 23, 291 (1981).
- (23) T. Jarlborg, A. J. Freeman. Phys. Rev. B. 22, 2332 (1980).
- (24) R. A. de Groot, D. D. Koelling and F. M. Mueller J. Phys. F: Metal Phys. 10, L235 (1980).
- (25) A. Aguayo and D. J. Singh, Phys. Rev. B 66 020401 (2002).
- (26) A. Aguayo, I. I. Mazin, and D. J. Singh, Phys. Rev. Lett. 92, 147201 (2004).
- (27) K. Koepernik, and H. Eschrig, Phys. Rev. B 59, 1743 (1999); H.Eschrig, Optimized LCAO Method and the Electronic Structure of Extended Systems (Springer,Berlin,1989).
- (28) J. P. Perdew and Y.Wang, Phys. Rev. B 45, 13244 (1992).
- (29) D. J. Singh, Planewaves, Pseudopotentials and the LAPW method (Kluwer Academic, Boston, 1994).
- (30) P. Blaha, K. Schwarz, G. K. H. Madsen, D. Kvasnicka, and J. Luitz, WIEN2k, An Augmented Plane Wave + Local Orbitals Program for Calculating Crystal Properties (K.Schwarz, Tech. University Wien, Austria, 2001 ), ISBN 3-9501031-1-2. Phys. Rev. B 45, 13244 (1992).
- (31) J. P. Perdew, K. Burke, and M. Ernzerhof, Phys. Rev. Lett. 77, 3865 (1996).
- (32) J. F. Janak, Phys. Rev. B 16, 255 (1977).
- (33) K. Schwarz and P. Mohn, J.Phys. F 14, L129 (1984)
- (34) I. I. Mazin and D. J. Singh, Phys. Rev. B 69, 020402 (2004).
- (35) P. Larson, I. I. Mazin, and D. J. Singh, Phys. Rev. B. 69, 064429 (2004).
- (36) T. Moriya and K. Ueda, Rep. Prog. Phys. 66, 1299 (2003) provides a recent summary on this subject.
- (37) W. Gerhardt, J. S. Schilling, H. Olijnyk and J. L. Smith, Phys. Rev. B 21, 5814 (1983).
- (38) W. E. Pickett, Phys. Rev. Lett. 48, 1548 (1982); Phys. Rev. B 26, 1186 (1982).