ESR study of the single-ion anisotropy in the pyrochlore antiferromagnet Gd2Sn2O7.
Abstract
Single-ion anisotropy is of importance for the magnetic ordering of the frustrated pyrochlore antiferromagnets Gd2Ti2O7 and Gd2Sn2O7. The anisotropy parameters for the Gd2Sn2O7 were measured using the electron spin resonance (ESR) technique. The anisotropy was found to be of the easy plane type, with the main constant =140 mK. This value is 35% smaller than the value of the corresponding anisotropy constant in the related compound Gd2Ti2O7.
pacs:
75.50.Ee, 76.30.Kg1 Introduction.
Rare earth pyrochlore magnets R2M2O7 (R — rare earth ion, M — transition metal) have attracted recently a lot of attention due to the specific geometry of exchange bonds. Rare earth ions in a pyrochlore structure form a network of corner-sharing tetrahedra. The nearest-neighbors antiferromagnetic (AF) exchange interaction is strongly frustrated in this lattice (see, e.g., [1]) and the classical ground state of this system should remain macroscopically degenerate down to T=0.
Selection of a unique ground state in the real magnets should occur due to other interactions like further neighbor exchange interactions, dipole interactions, single-ion anisotropy or due to the lifting of degeneracy by fluctuations. Single-ion anisotropy is known to have a strong effect on the formation of the ground state: strong axial anisotropy favors an unusual spin-ice state in Dy2Ti2O7 [2] while in the case of a strong easy-plane anisotropy in Er2Ti2O7 a Néel state is formed by the quantum order-by-disorder mechanism [3].
Gd-based pyrochlore magnets Gd2Ti2O7 and Gd2Sn2O7 were considered to be real examples of an AF Heisenberg pyrochlore. Both compounds demonstrate a magnetic ordering at a temperature near 1 K, but their spin structures are quite different. In the case of Gd2Ti2O7, two successive transitions are observed at 1.02 K and 0.74 K [4]. The low-temperature magnetic structure is a complicated noncollinear multiple- structure [5]. In the case of Gd2Sn2O7, a unique phase transition is observed [4] and the magnetic structure is a non-collinear with [6].
Up to now, single-ion anisotropy effects were not considered for these compounds since the Gd3+ ion is an S-state ion with =0 [7]. However, a considerable anisotropy was found in Gd2Ti2O7 [8]. A crystal field splitting of the ionic levels occurs because of a strong spin-orbit coupling among -electrons, which breaks the simple -scheme of the energy levels and leads to the admixture of the states into the ground state of the Gd3+ ion. The main anisotropy constant was found to be equal to 74 mK in Gd2Ti2O7, which makes the overall crystal field splitting 2.7 K comparable with the exchange energy 3.7 K. Thus, it is important to determine the values of the single-ion anisotropy constants in Gd2Sn2O7 as well. A difference in the single-ion anisotropy could be important for understanding the above mentioned difference of the magnetic ground states in Gd2Ti2O7 and Gd2Sn2O7.
To study single-ion effects, we used the non-magnetic isostructural compound Y2Sn2O7 with a small amount (nominally 0.5%) of gadolinium substituting for yttrium. This enables one to determine the single ion anisotropy parameters since magnetic ions are in the same surrounding [9, 10, 11] as in the concentrated magnet. We found the presence of a single-ion anisotropy, evidenced by the obvious splitting of the ESR absorption spectrum, and we determined the values of the main anisotropy constants.
2 Experimental details and samples.
Polycrystalline samples of (Y0.995Gd0.005)2Sn2O7 were prepared by heating a stoichiometric mixture of Y2O3 (99.99%), Gd2O3 (99.999%) and SnO2 (99.9%) in air. The samples were heated between 1400∘C and 1450∘C for several hours with intermediate regrindings. The x-ray diffraction pattern obtained at room temperature with a Bruker D8 diffractometer corresponds to the pure phase with a small amount (1%) of SnO2. A magnetic susceptibility curve was measured with a field of 80 Oe in the temperature range 20 K-250 K. Sample magnetization corresponds to the Curie law with the effective moment of 7.9 per Gd3+ ion, assuming the nominal Gd concentration of 0.5%.
The ESR study was performed at frequencies 18-100 GHz using a set of home-made transmission-type ESR spectrometers equipped with a He-cooled cryomagnet. The ESR absorption spectra were recorded as field dependences of the transmitted microwave signal.
3 Experimental results and discussion.
Electron spin resonance is a sensitive method for the determination of the spin-Hamiltonian constants (see, e.g., [12]). The microwave absorption power per spin is:
| (1) |
where is the microwave field of the frequency , , are the energies of the corresponding spin states, and .
The microwave field is polarized perpendicular to the external magnetic field in our experiments. Thus, only dipolar transitions with are observed ( is the spin projection onto the magnetic field direction). In the absence of single-ion anisotropy, a single resonance line should be observed at the resonance frequency . The presence of a single-ion anisotropy results in a multi-component absorption spectrum. The amplitudes and the signs of the spin-Hamiltonian parameters may be determined from the positions and the relative intensities of these components.
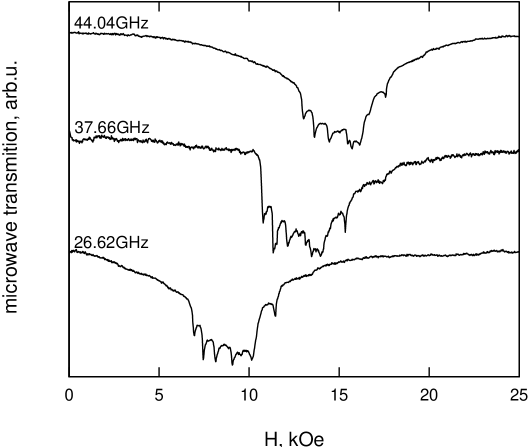
ESR absorption spectra measured at different microwave frequencies and at different temperatures are shown in Figures 1, 2. The absorption spectrum is clearly multi-component, which indicates the presence of crystal field splitting of the single-ion energy levels.
For powder samples the absorption is averaged over all possible orientations of the crystallographic axes. The point symmetry of the Gd ion surroundings is , and the main term in the anisotropy energy is the second order axial term with the anisotropy axis along the direction. Measurements on the single crystals of the pyrochlore titanate have shown that this term is the most important [8]. As a first step of the present analysis, we will consider a simplified model restricted to this term only:
| (2) |
Treating the anisotropy term in the first order of perturbation theory, for the magnetic field applied at the angle with respect to the anisotropy axis , we obtain for the energies, up to a constant term:
| (3) |
where is the spin projection on the direction of the magnetic field. The resonance field corresponding to the dipolar transition is
| (4) |
where is a free spin resonance field. When averaging over the orientation, grains with the anisotropy axis perpendicular to the field direction enter with the higher weight. For the case of a narrow resonance line, this averaging yields:
| (5) |
where , . The magnetic fields, at which the resonance absorption is observed, are limited by the values and , corresponding to grains with and , respectively. Thus, the averaged ESR absorption line corresponding to a given transition should demonstrate sharp edges both at the left and at the right of the paramagnetic resonance position. At the end corresponding to grains with it should have a step-like edge, while at the other end ( grains), it should demonstrate a sharp increase of absorption corresponding to the square root divergency in (5). Whether this increase in absorption is to the left or to the right from the free spin resonance position depends, for a given , on the sign of the constant only.
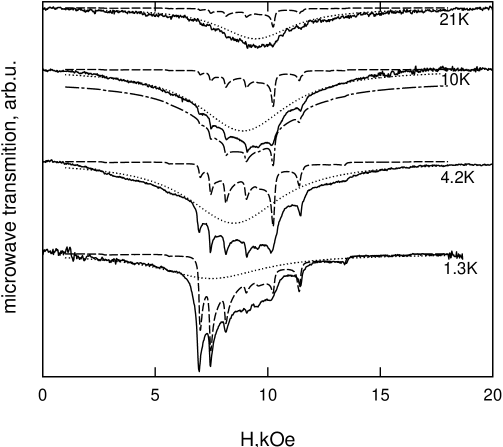
We have studied the ESR absorption at different temperatures (see Figure 2). At low temperatures, the contributions to the absorption arising from the states with a large negative ( and ) dominate. In Figure 2 one can clearly see that an intense absorption at low temperatures occurs on the left edge of the ESR spectra, while on the right edge there are several step-like features of smaller amplitude. This distribution of the intensities corresponds to a positive sign for the constant, i.e. to an easy-plane anisotropy.
The above considerations suggest a way to identify the ESR absorption spectrum features corresponding to . Intense slightly asymmetric peaks observed at the left of the paramagnetic resonance position at low temperatures and peaks of similar shape that become more intense on heating correspond to . Step-like changes of the absorption observed at the left and at the right of the paramagnetic resonance position, and intense features observed at low temperatures at the right of the paramagnetic resonance position correspond to grains with .
The frequency-field diagram of the observed transitions is shown in Figure 3. Note that the components do not form equidistant lines. This indicates the presence of higher order contributions to the anisotropy energy. The general form of the spin-Hamiltonian for the S=7/2 Gd3+ ion in the surroundings of symmetry is:
| (6) |
where the Stevens operators [12] are functions of the components of the total angular momentum , with and . In the notations of (2): .
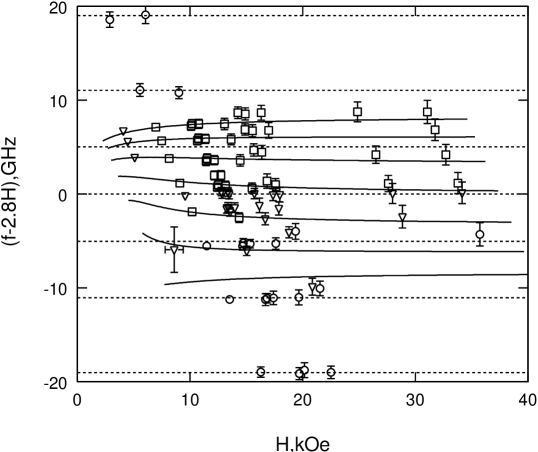
We will consider only the second and fourth order axial terms, and we will suppose in the further analysis. The and constants can be found from the positions of the well-defined components corresponding to the and transitions (two lowermost lines in Figure 3). Deviations of these transitions frequencies from the paramagnetic resonance position are GHz and GHz correspondingly. This gives the following values for the spin-Hamiltonian constants: mK and mK. The amplitude of the second order anisotropy constant (=140 mK) is 35% smaller than the corresponding value in Gd2Ti2O7 ( mK). The frequency-field dependences for calculated for these parameter values are shown in Figure 3. Additionally, we have modeled the ESR absorption line using (1). The simulation was performed by exact numerical diagonalization of the Hamiltonian matrix combined with the averaging over the orientations of the grains crystallographic axes. The results are presented in Figure 2. The calculated frequency-field dependences are in a good agreement with the observed ones. The simulated absorption spectra also demonstrate good agreement with the experimental data — they correctly reproduce the details of the line shape as well as the tendencies of the line shape change with the temperature.
Note that the correspondence between the simulated and observed absorption spectra can be improved by adding a broad absorption line located near the paramagnetic resonance position (see Figure 2). This additional contribution cannot be attributed to isolated Gd3+ spins in the crystal field. The intensity of this additional absorption component increases with increasing temperature at low temperatures: the integral intensity of this broad line at 4.2K is twice as large as its integral intensity at 1.3K. The ratio of the intensities of the suggested broad absorption line and of the crystal-field split absorption is also temperature dependent: at 1.3K the most of the integral intensity is due to the crystal-field split absorption lines, while at 20K the broad absorption line dominates. A possible origin of this broad absorption line is the formation of antiferromagnetically coupled pairs of Gd ions. The ground state of a pair is a nonmagnetic singlet, the total splitting between the S=0 ground state and the highest energy state (S=7) is about K. The dominating intensity of the broad line at 20K suggests a high concentration of these pairs, which indicates a tendency toward formation of Gd clusters in Y2Sn2O7 matrix. However, the characteristic multi-component signal corresponding to the isolated S=7/2 Gd3+ ions can be distinguished and analyzed at low temperatures. The presence of exchange coupled pairs has also been observed by 170Yb Mössbauer spectroscopy in Y2Ti2O7 doped with Yb [13].
4 Conclusions.
We report on the ESR in powder samples of (Y0.995Gd0.005)2Sn2O7. The observed splitting of the ESR absorption line allows to determine the values of the single-ion anisotropy constant for the Gd ion. We find the value of the main anisotropy constant is about 35% smaller than that in titanate Gd2Ti2O7. Possibly, this change of the anisotropy energy is responsible for the strong difference of the ordered state formed in Gd2Ti2O7 and Gd2Sn2O7 at low temperatures.
References
- [1] Ramirez A P 2001 Handbook of Magnetic Materials 13 p 423
- [2] Higashinaka R, Fukazawa H and Maeno Y 2003 Phys. Rev.B 68 014415
- [3] Champion J D M, Harris M J, Holdsworth P C W, Wills A S, Balakrishnan G, Bramwell S T, Cizmar E, Fennell T, Gardner J S, Lago J et al 2003 Phys. Rev.B 68 020401(R)
- [4] Bonville P, Hodges J A, Ocio M, Sanchez J P, Vulliet P, Sosin S and Braithwaite D 2003 J. Phys.: Condens. Matter15 7777
- [5] Stewart J R, Ehlers G, Wils A S, Bramwell S T and Gardner J S 2004 J. Phys.: Condens. Matter16 L321
- [6] Sanchez J P, Wills A S, Bonville P, Dalmas de Réotier P, Yaouanc A and Zhitomirsky M E 2005 to be published
- [7] Ramirez A P, Shastry B S, Hayashi A, Krajevski J J, Huse D A and Cava R J 2002 Phys. Rev. Lett.89 067202
- [8] Glazkov V N, Zhitomirsky M E, Smirnov A I, Krug von Nidda H-A, Loidl A, Marin C and Sanchez J P 2005 Phys. Rev.B 72 020409(R)
- [9] Kennedy B J, Hunter B A and Howard C J 1997 J. Solid State Chem. 130 58
- [10] Tabira Y, Withers R L, Minervini L and Grimes R W 2000 J. Solid State Chem. 153 16
- [11] Helean K B, Ushakov S V, Brown C E, Navrotsky A, Lian J, Erwing R C, Farmer J M and Boatner L A 2004 J. Solid State Chem. 177 1858
- [12] Abragam A and Bleaney B 1970 Electron Paramagnetic Resonance of Transition Ions (Oxford: Clarendon Press).
- [13] Hodges J A, Bonville P, Forget A, Rams M, Królas K and Dhalenne G 2001 J. Phys.: Condens. Matter13 9301