Static and dynamic Jahn-Teller effect in the alkali metal fulleride salts A4C60
(A = K, Rb, Cs)
Abstract
We report the temperature dependent mid- and near-infrared spectra of K4C60, Rb4C60 and Cs4C60. The splitting of the vibrational and electronic transitions indicates a molecular symmetry change of C which brings the fulleride anion from to either a or a distortion. In contrast to Cs4C60, low temperature neutron diffraction measurements did not reveal a structural phase transition in either K4C60 and Rb4C60. This proves that the molecular transition is driven by the molecular Jahn-Teller effect, which overrides the distorting potential field of the surrounding cations at high temperature. In K4C60 and Rb4C60 we suggest a transition from a static to a dynamic Jahn-Teller state without changing the average structure. We studied the librations of these two fullerides by temperature dependent inelastic neutron scattering and conclude that both pseudorotation and jump reorientation are present in the dynamic Jahn-Teller state.
pacs:
61.48.+c, 71.70.Ch, 71.70.Ej, 78.30.NaI Introduction
The insulating character of the A4C60 (A = K, Rb, Cs) compounds has been a longstanding puzzle in fullerene science. The successful description involves a combination of the molecular Jahn-Teller (JT) effect and the Mott-Hubbard band picture resulting in the theory of the nonmagnetic Mott–Jahn–Teller insulating state.Fabrizio and Tosatti (1997) This theory has been used effectively for the explanation of EELSKnupfer et al. (1996); Knupfer and Fink (1997) and NMRBrouet et al. (2002) measurements on A4C60. Recently, a sophisticated experimentWachowiak et al. (2005) by scanning tunneling microscopy has revealed JT distorted molecules in K4C60 monolayers. In macroscopic crystals, however, the distortion could only be detected directly in one case: anions with symmetry were found in Cs4C60 by neutron diffraction.Dahlke and Rosseinsky (2002) In Cs4C60, X-rayDahlke et al. (1998) and neutron diffraction measurements also found an orthorhombic-tetragonal ( to ) phase transition between 300 and 623 K. The crystal structure of K4C60 and Rb4C60 was determined to be at room temperature,Kuntscher et al. (1997); Bendele et al. (1998) although atomic positions were not refined. In the case of K4C60 mid-infrared (MIR) and near-infrared (NIR) measurements showed a splitting that indicated a JT distorted anion.Iwasa and Kaneyasu (1995) The distortion was found to be temperature dependentKamarás et al. (2002) and the possibility of a similar phase transition as that in Cs4C60 has been put forward.
Vibrational spectroscopy is uniquely sensitive to the change in molecular symmetry (i.e. the exact shape of the molecule) through the splitting of vibrational bands. Because it detects the motion of atoms, it naturally goes beyond the spherical approximation used for crude models of the electronic structure. In this respect, molecular vibrations are more intimately connected to structural studies which show the average position of the atomic cores, than to methods probing magnetic and electronic excitations where an analogy to atomic orbitals is often sufficient to describe the results. In this paper, we follow the distortions of fulleride ions in three A4C60 salts (A=K, Rb, Cs) with temperature. Our conclusions are mainly drawn from mid-infrared vibrational spectra, but we also study the effect of these distortions on electronic orbitals of the C ions, through NIR spectra probing both intra- and intermolecular electronic excitations. To clarify whether the distortions are caused by crystal potential or molecular degrees of freedom, we performed temperature-dependent neutron diffraction studies, complemented by inelastic neutron scattering in order to detect molecular motion. We find no structural phase transition to a cooperative static Jahn-Teller state in either K4C60 or Rb4C60 down to 4K; changes in vibrational spectra reflect the change in molecular symmetry and thus a transition from static to dynamic Jahn-Teller state as the temperature is raised.
II The Jahn-Teller effect in fulleride salts
To understand the precise nature of the distortions occurring in fulleride salts, we have to elaborate on the details of their crystal and molecular symmetry. An entire monograph has been devoted to this question,Chancey and O’Brien (1997) here we will only repeat the main statements.
The Jahn-Teller effect is caused by the interaction of a degenerate electronic state with molecular vibrations.Jahn and Teller (1937) In C60 anions, the electronic states involved are those of the triply degenerate orbitals and the vibrations are the ten fivefold degenerate modes. These interactions result in a change of shape of the molecule and consequently a change in the splitting of the electronic orbitals. Electrons will occupy the lowest-energy levels and thus, if the splitting is large enough, overcome Hund’s rule and form nonmagnetic systems.
In most solids containing open-shell species, the energy bands are much broader than the JT splitting; this is why the A3C60 salts are metals.Hebard et al. (1991) In this case the electrons cannot be assigned to individual molecules and therefore Jahn-Teller coupling is not possible. The insulating character of A4C60 salts has been proposed to be caused by Mott localization which enables Jahn-Teller coupling between the localized electrons and the vibrational degrees of freedom. This state has been termed the ”Mott-Jahn-Teller nonmagnetic insulator”.Fabrizio and Tosatti (1997) As we will see, our results fully support this picture, so we describe the A4C60 systems in this framework.
In the atomic orbital-like classification used by Chancey and O’Brien,Chancey and O’Brien (1997) the C molecular ion is a system, where the allowed Jahn–Teller distortions for isolated ions are , and . The predicted shape of the distortions is ”pancake-type”: a flattening along a , or molecular axis.Chancey and O’Brien (1997) We illustrate these possible distortions in Figure 1a. The adiabatic potential energy surface (APES) of these systems has minima at either or symmetry, and saddle points at symmetry.O’Brien (1996) If the geometries are minima, then the are maxima and vice versa. There are six possible distortions and ten distortions in different directions; transitions between them occur through tunneling which results in a different molecular shape without the rotation of the molecule itself.Dunn and Bates (1995) This motion is called pseudorotation. Proof of such dynamic distortions has indeed been presented recently by a sophisticated experiment on monoanions produced in a storage ring.Tomita et al. (2005) The distortion can only be realized when an external potential lowers the energy of this distortion. Forming a solid from fulleride ions with counterions creates such a potential field.
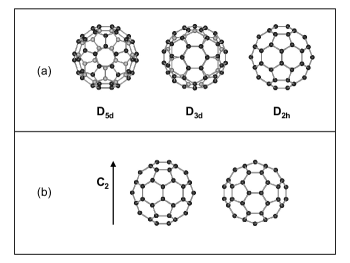
Apart from the intrinsic JT distortion, forcing an icosahedral C60 molecule into a crystal inevitably lowers its symmetry. For all crystal systems with orthogonal principal axes and one molecule per primitive unit cell the symmetry axes of the molecule are aligned with the crystallographic axes, but the molecule can assume two different orientations as shown in Figure 1b. These are the standard orientations originally defined for orientationally ordered C60.Harris and Sachidanandam (1992) Thus, for a C anion the and molecular axes are not equivalent, reflecting the lack of a fourfold axis in icosahedral symmetry. Nevertheless, the misconception prevailed in the early fullerene literature that in a tetragonal distorting field, the individual molecular ions can be uniaxially distorted into the pointgroup with the crystal axis as principal axis.Lukyanchuk et al. (1995); Forró and Mihály (2001); Kerkoud et al. (1996) This approach treats the fulleride ions as a sphereOzaki and Takahashi (1986) (a ”giant atom”), and takes the effect of the distorting crystal field to be the same as the inherent JT distortion of the balls, leading to the conclusion that the two are indistinguishable. It is apparent from structural studies, however,Kuntscher et al. (1997); Bendele et al. (1998) that in a tetragonal system the C60 molecules cannot be equivalent. Orbital overlap between cations and anions determines whether the balls are ordered or disordered, i.e. the crystal is tetragonal or orthorhombic,Fischer and Heiney (1993); Dahlke and Rosseinsky (2002); Yildirim et al. (1993) but the molecular symmetry is the same in both cases. The consequence is that the threefold degenerate orbitals will show a threefold splitting in both an orthorhombic and tetragonal environment. An orthorhombic crystal is formed by simply arranging the D2h distorted molecules in an ordered fashion, while the overall tetragonal symmetry of the crystal can only be maintained as an average with some sort of disorder, either static or dynamic.Bendele et al. (1998) In the following we try to summarize the possible arrangements and relate them to the crystal structures as classified by Fabrizio and Tosatti.Fabrizio and Tosatti (1997) Note that we consciously avoid the use of the term merohedral disorder throughout the discussion: this concept is correctly used for A3C60 systemsStephens et al. (1991) but is incorrect for A4C60.
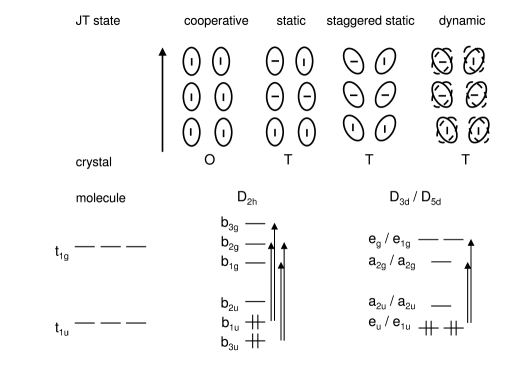
The ordered orthorhombic structure mentioned above is the so-called cooperative static Jahn-Teller state. For the overall symmetry to become tetragonal, we have to assume there exists an average (spatial or temporal) of several molecules. We summarize the situation in Figure 2. The static disorder means that all molecules align their axes in the c direction, but the hexagon-hexagon bonds are randomly oriented along either the a or b axes (static Jahn-Teller state). This scenario is, however, not the only possible geometry whose spatial average results in a tetragonal crystal. Molecules distorted either along the or the axis can form an ordered array resulting in a fourfold axis in the direction (staggered static Jahn-Teller state). The molecular principal axis of a or anion cannot be parallel with the crystallographic axes, but must be arranged such that the overall average gives an structure. The transition from static to staggered static state occurs through pseudorotation and vibration, i.e. the coordinates of the individual carbon atoms change only slightly and there is no reorientation of the molecule as a whole. If there are several configurations with small energy barriers between them (compared to the energy of thermal motion), the balls can assume many of these configurations dynamically and thus the dynamic Jahn-Teller state is formed. The significance of pseudorotation increases as the amplitude of thermal motion becomes larger.
The detection of the distortion by diffraction methods demands extreme sensitivity, as the magnitudes in question are small. Paul et al.Paul et al. (1994) found a quasi-axial elongation of 0.04 Å in (PPN)2C60, where the symmetry of the C dianion is lowered to . In the monovalent decamethylnickelocenium salt,Wan et al. (1995) the symmetry was found close to , with a difference between maximum and minimum radii of 0.05 Å. These are static distortions in which the role of the bulky organic counterions and the inherent JT effect cannot be separated.Reed and Bolskar (2000) The largest distortion (defined as the difference between the smallest and the largest distance from the center of the ball) so far has been found in the ordered orthorhombic phase of Cs4C60; 0.076 Å at 300 K.Dahlke and Rosseinsky (2002) In K4C60 Kuntscher et al.Kuntscher et al. (1997) put an upper limit of 0.04 Å on the difference between ”equatorial” and ”polar” radii. One must take into account, though, that in the case of a staggered static arrangement the directions of maximum and minimum radii are not necessarily the crystal axes, and in the dynamic case the difference is smeared out completely.
In Figure 2(bottom), we show the corresponding splitting of the molecular orbitals. In the icosahedral C60 molecule the LUMO (which becomes the HOMO in the molecular ions) is a threefold degenerate orbital. We obtain a threefold splitting of this orbital in the cooperative static and static JT states and a twofold splitting in the staggered static and dynamic states. The lowest-energy final states for dipole transitions also derive from a threefold degenerate orbital, the even-parity one. Incidentally, the four infrared-active vibrations of C60 also show symmetry, therefore the discussion can proceed along the same lines.
Further complications arise if we take into account that the fullerene balls are capable of rotation around several axes. The simplest scenario would be that occasional reorientational jumps between the two standard orientations (around the axis) would average out the symmetry from to . We know from inelastic neutron scattering in K3C60,Neumann et al. (1993) however, that the rotation between standard orientations occurs with a much higher probability around a axis. Structural studies and modelingKuntscher et al. (1997) in A4C60 indicated that rotation around the axis is hindered because of unfavorable alkali atom – carbon distances. Thus, we suggest that dynamic disorder in A4C60 salts is the result of reorientation around the threefold axes.
III Experimental
A4C60 systems have been prepared previously either by solid-state synthesisFleming et al. (1991); Murphy et al. (1992); Poirier et al. (1995) or by a liquid ammonia route.Dahlke et al. (1998) We used a solid-state synthesis for all three alkali salts by reacting stoichiometric amounts of the alkali metal with C60 at 350 ∘C in a steel capsule. The reaction was followed using powder X-ray diffraction and MIR spectroscopy. The reaction mixture required heating for 10 to 14 days with one intermediate sample regrinding in the case of K4C60 and Cs4C60, and 20 days with three regrindings for Rb4C60, to achieve complete conversion. No impurities were observed in the K4C60 and Rb4C60 samples, while X-ray diffraction found less than 5 % Cs6C60 in Cs4C60.
Since fullerides are air sensitive, the synthesis and sample preparation was conducted in a dry box. For the MIR and NIR measurements, KBr pellets were pressed and transmittance spectra measured with the sample inside a liquid nitrogen cooled flow-through cryostat under dynamic vacuum. Spectra were recorded with resolution of 1 or 2 cm-1 in the MIR range using a Bruker IFS 28 spectrometer and 4 cm-1 in the NIR using a Bruker IFS 66v/S spectrometer.
Neutron scattering measurements were performed at the NIST Center for Neutron Research. Large amounts of materials were prepared for these experiments (2.4 g of K4C60 and 1.1 g of Rb4C60) to achieve good counting statistics. Temperature dependent neutron diffraction data were collected on the BT1 diffractometer using a wavelength of = 1.5403 Å and a Q-range of 0.2 Å-1–8.1 Å-1 with the Cu(311) monochromator set at a 90 take-off angle and using in-pile collimation of 15 minutes of arc. Lattice parameters were extracted using the LeBail method.Larson and Dreele (2000); Toby (2001); A. Le Bail and Fourquet (1988)
Low energy molecular librations were studied using the BT4 triple-axis spectrometer. We collected constant momentum transfer(Q) scans at Q=5.5 Å-1 with a fixed incident energy of 28 meV. The incident beam was produced using a Cu(220) monochromator and a graphite filter for removal of higher order contamination. The scattered beam was analyzed using a graphite(004) crystal. The measured resolution with 60’-40’-40’-40’ collimation was 0.97 meV full width at half maximum. Samples were loaded in indium-wire-sealed aluminum and vanadium cylindrical cans. Sample temperature was controlled between 4 K and 300 K with a closed cycle helium refrigerator. In the analysis of librational spectra, background runs were first subtracted, the intensities were corrected for changes in the scattered energy contribution to the spectrometer resolution, and then the spectra were symmetrized for the thermal Bose factor. The corrected data were subsequently fitted using a Gaussian resolution function at zero energy transfer and two identical Lorentzians symmetrically located about the elastic line, and convoluted with the instrumental resolution function. Details of similar librational studies on other fullerides can be found in Ref. Neumann et al., 1993.
IV Results
IV.1 Structure
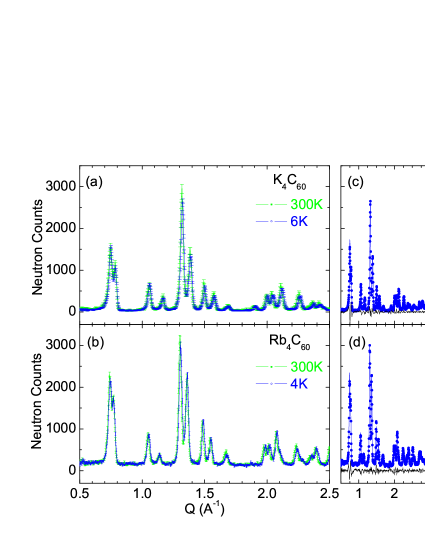
Room temperature X-ray diffraction showed the crystal symmetries to be in K4C60 and Rb4C60, and in Cs4C60, in agreement with published results.Kuntscher et al. (1997); Dahlke et al. (1998) Temperature-dependent structural studies were reported only for Cs4C60,Dahlke and Rosseinsky (2002) revealing an orthorhombic-tetragonal transition between 300 K and 623 K. Previously, based on vibrational spectra in K4C60,Kamarás et al. (2002) we suggested a similar transition in the two other alkali compounds. In order to draw a definitive conclusion on this hypothesis, we performed low-temperature neutron diffraction measurements on K4C60 and Rb4C60. The resulting low- and high-temperature diffraction patterns are compared in Figure 3. We found that the structure of both K4C60 and Rb4C60 remain tetragonal down to the lowest temperatures measured. The 4 K and 300 K lattice parameter values from the LeBail analysis are given explicitly in Table 1. The room-temperature data agree with those of Kuntscher et al.Kuntscher et al. (1997) for K4C60 and Rb4C60.
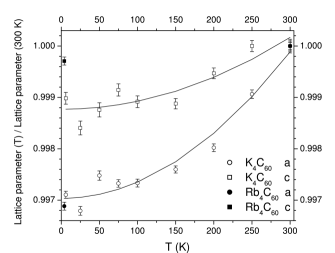
We investigated the K4C60 salt in detail, at several temperatures, to make sure we did not miss a possible tetragonal-tetragonal phase transition, similar to the one found in Rb4C60 with increasing pressure.Sabouri-Dodaran et al. (2004) The lattice parameters extracted at each temperature and normalized to the room-temperature values are shown in Figure 4. As no significant change can be seen except for a small thermal contraction (an order of magnitude smaller than the pressure-induced change reported in Ref. Sabouri-Dodaran et al., 2004), we can rule out even a tetragonal-tetragonal phase transition in K4C60.
| T | Rb4C60 | K4C60 | ||
|---|---|---|---|---|
| a (Å) | c (Å) | a (Å) | c (Å) | |
| 4-6 K | 11.912(1) | 11.007(1) | 11.827(1) | 10.746(1) |
| 300 K | 11.949(1) | 11.011(1) | 11.862(1) | 10.757(1) |
IV.2 Molecular vibrations
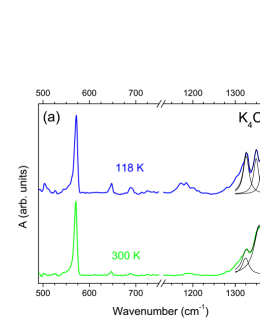
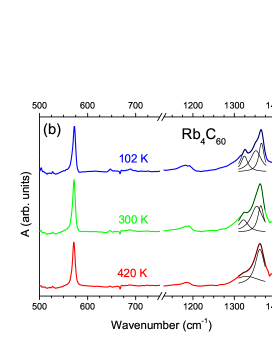
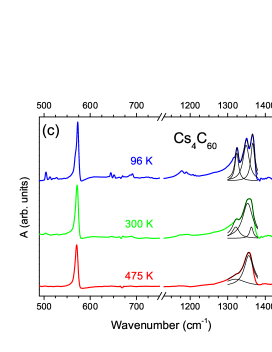
The MIR spectra of the three salts measured at room temperature and at characteristic temperatures unique for each salt are shown in Figure 5. Since C60 is an icosahedral molecule, it has only four infrared active vibrations (at 528, 577, 1183 and 1429 cm-1)Krätschmer et al. (1990), all of which belong to the representation. The shift and the splitting of the highest frequency (4) mode has been used as the most sensitive indicator for charge transfer,Pichler et al. (1994) symmetry changeKamarás et al. (1997) and bondingRao et al. (1997) in fullerene compounds. The most prominent feature of our spectra is the splitting of this mode (shifted to 1350 cm-1 because of charge effects) indicating a lowering of symmetry from icosahedral. All spectra could be fitted with either two or three Lorentzians in this frequency range, and the results are summarized in Table 2. The temperature dependence of the splitting of the (3) mode around 1182 cm-1 was found to be the same as for the (4) mode. In contrast, the two lower-frequency modes were not split at our resolution, instead, we observed a decrease in peak height and increase in linewidth of the (2) mode at 571 cm-1 (Fig. 6). (We note that in pristine C60 below the orientational phase transitionHomes et al. (1994) no splitting was observed in the (2) mode even at 0.4 cm-1 resolution and the splitting of the (1) mode was less than 1 cm-1. The latter mode is almost unobservable in the C ion.Pichler et al. (1994)) The symmetry lowering from also activates previously silent modes, appearing between 600-750 cm-1. The intensity of these peaks increases on cooling. The temperature dependence of this increase can also be used to follow the symmetry change of the Canion.
| K4C60 | Rb4C60 | Cs4C60 | ||||||
|---|---|---|---|---|---|---|---|---|
| 118 K | 300 K | 102 K | 300 K | 420 K | 96 K | 300 K | 475 K | |
| (cm-1) | 1326 1 | 1324 1 | 1324 1 | 1322 1 | 1330 7 | 1324 1 | 1321 1 | 1323 3 |
| (cm-1) | 15 2 | 17 4 | 19 2 | 28 3 | 82 31 | 11 2 | 21 2 | 55 12 |
| 3 1 | 2 1 | 2 1 | 2 1 | 4.3 4.1 | 4 1 | 31 | 43 | |
| (cm-1) | 1350 1 | 1358 1 | 1352 1 | 1354 2 | 1361 1 | 1349 1 | 1354 1 | 1356 1 |
| (cm-1) | 14 2 | 33 2 | 32 4 | 33 3 | 27 2 | 20 2 | 34 2 | 27 2 |
| 31 | 93 | 21 | 52 | 52 | 92 | 152 | 101 | |
| (cm-1) | 1365 1 | 1365 1 | 1363 1 | 1366 1 | 1363 1 | |||
| (cm-1) | 12 2 | 15 2 | 17 2 | 12 2 | 10 2 | |||
| 31 | 21 | 31 | 61 | 1.20.7 | ||||
From Figure 2, it follows that the modes split twofold in the and point groups, and threefold in the point group and since all split modes are IR active, this directly indicates the geometry. It is also clear that in all compounds, the distortion changes from the latter to the former upon warming. The temperature where this occurs depends on the counterion. From Figure 6 the transition temperatures for K4C60, Rb4C60 and Cs4C60 are approximately 270 K, 330 K and 400 K, respectively, increasing with increasing cation size.


IV.3 Electronic transitions
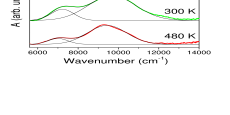
MIR spectra indicated a molecular symmetry change from to / on heating in all of the three compounds and electronic transitions should exhibit similar splitting. A splitting has been reported in NIR spectra of K4C60Iwasa and Kaneyasu (1995) and was systematically investigated by transmission electron energy loss spectroscopy in a series of A4C60 compounds.Knupfer et al. (1996); Knupfer and Fink (1997) The KBr pellet technique is not a particularly good method for quantitative evaluation in a broad frequency range, due to scattering effects in the pellets and inadequate determination of the optical path length. We nevertheless measured the NIR spectra of all the compounds at several temperatures and relate our findings to the EELS measurements by Knupfer and Fink.Knupfer and Fink (1997) Oscillator strengths in thin film transmission EELS studies can be compared more reliably between different materials; the frequency resolution of this method, on the other hand, is only 928 cm-1 compared to 4 cm-1 in the IR spectra. Therefore, we concentrate on the number and position of electronic excitations and will not attempt to draw any conclusion regarding line width or intensity.
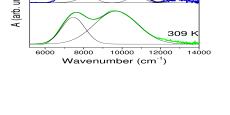
Figure 7 shows overall (MIR/NIR) spectra of the three salts and C60. It is apparent that there is a finite spectral weight even at low frequency, and its relative intensity decreases with increasing cation size. Knupfer and FinkKnupfer and Fink (1997) have identified this low-frequency excitation around 4000 cm-1 ( 0.5 eV), as a transition between Jahn-Teller split states (e.g. in Figure 2) on different molecules. Intramolecular excitations between JT states are dipole forbidden, but in a Mott-Jahn-Teller picture, this energy, renormalized due to intermolecular interactions, becomes the effective Hubbard repulsion term .Fabrizio and Tosatti (1997) Such transitions have been observed in one-dimensional organic conductors.Torrance et al. (1975)
| K4C60 | Rb4C60 | Cs4C60 | ||||||||
|---|---|---|---|---|---|---|---|---|---|---|
| 93 K | 309 K | Ref.Knupfer and Fink,1997 | 89 K | 300 K | 480 K | Ref.Knupfer and Fink,1997 | 151 K | 298 K | 513 K | Ref.Knupfer and Fink,1997 |
| 76184 | 74643 | 7421 | 72757 | 72243 | 70066 | 7904 | 77303 | 76953 | 70716 | 7904 |
| 949910 | 96923 | 10082 | 96717 | 96823 | 94393 | 10324 | 973322 | 971924 | 95524 | 10324 |
| 107278 | 1068050 | 1060667 | ||||||||
| 1298215 | 12582 | 12824 | 1257119 | 1257017 | 12824 | |||||
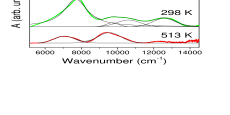
In order to better resolve the split NIR lines, we performed a baseline correction between 6000 and 14000 cm-1 and fitted the remaining lines with Gaussians. The resulting fits are depicted in Figure 8, and the parameters summarized in Table 3. Four dipole allowed intramolecular transitions are expected in the case of , and two in the case of / (see Figure 2). This is indeed seen in K4C60 and in Cs4C60 and corresponds to the MIR measurements at all temperatures. However, in Rb4C60, while the low-temperature spectra can be fitted with four Gaussians, the decomposition was not unambigous since these lines are broad and their splitting seems to be small. Comparing our parameters with those reported in Ref. Knupfer and Fink, 1997 (Table 3), we have the best agreement for Cs4C60, but instead of their three peaks we can identify four, as expected from symmetry. In the case of K4C60 Ref. Knupfer and Fink, 1997 found three similar lines as in Cs4C60, but we see two at low temperature and four at high temperature. We assume that the discrepancy originates in the baseline correction of the EELS data for the higher-lying electronic transition of C. (Visual inspection of the spectra shown in Ref. Knupfer and Fink, 1997 reveals that the 1.5 eV peak is much less pronounced in K4C60 than in Cs4C60 and Rb4C60.)
To summarize the above, vibrational and electronic spectra in all three salts indicate distorted C ions at low temperature and / distorted ones at higher temperature at the time scale of the optical measurements. These methods cannot distinguish between individual configurations in the static or the staggered static Jahn-Teller state, nor can they detect transitions between them. These transitions occur via librational motion, which can be studied by inelastic neutron scattering.
IV.4 Librations
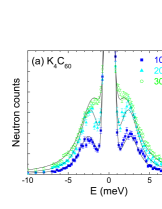
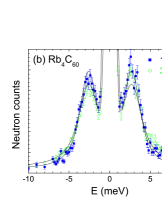
Inelastic neutron scattering (INS) spectra were measured as a function of momentum transfer, , and energy transfer, , at several temperatures for K4C60 and Rb4C60. Figure 9a and b show spectra at 100 K, 200 K and 300 K for K4C60 and at 100 K and 300 K for Rb4C60 at a constant momentum transfer of 5.5 Å-1. The solid symbols are the corrected experimental data and the lines are fits as described in the experimental details section. Well-defined peaks are observed at non-zero energy transfer at all temperatures in both fullerides and may be assigned to librational modes of C ions based on the momentum transfer dependence of their intensities and peak widths. The -dependence of the integrated intensity of the librational modes in fullerides is characteristic of the form factor of the C60 molecule and has been studied in detail in many fullerides; it provides unambiguous evidence for the assignment as librations.Neumann et al. (1992); Christides et al. (1993); Reznik et al. (1994) Figure 9c shows -dependent data at fixed energy transfers of 2.4 meV and 5 meV for K4C60. The momentum transfer spectrum at meV is a reasonable substitute for the -dependent integrated intensity because the librational peak position and width are insensitive to according to our energy transfer spectra at a few other selected momentum transfers. The 2.4 meV peak displays the characteristic -dependence of the librational modes of fullerides with a small peak around 3.5 Å-1 and a larger peak around 5.7 Å-1. These peaks are attributed to the non-zero Legendre polynomials with coefficients of and , respectively.Copley et al. (1992) In contrast, the momentum transfer spectrum at 5 meV energy transfer does not show this behavior since it has much less librational character.
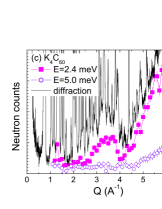
The main motivation for the low temperature diffraction experiments was to search for a possible structural phase transition similar to the order-disorder transition in Cs4C60.Dahlke and Rosseinsky (2002) Additional proof that there is no ordering of the C between room temperature and 6 K in K4C60 is presented by the large and temperature independent diffuse background. Figure 9c compares the diffuse background to the fixed energy transfer scans discussed above. As observed for other fullerides, the -dependence of the diffuse background of the diffraction is very similar to that of the librational peak, indicating disorder of the C anions.Christides et al. (1992)
| (meV) | (meV) | (∘) | |
|---|---|---|---|
| K4C60 100 K | 2.57 0.10 | 27722 | 3.55 0.01 |
| K4C60 300 K | 2.00 0.10 | 16817 | 7.85 0.02 |
| Rb4C60 100 K | 2.65 0.10 | 29422 | 3.44 0.07 |
| Rb4C60 300 K | 2.64 0.10 | 29322 | 5.96 0.01 |
The librational energies obtained by fitting the inelastic peaks can be found in Table 4. Following the arguments of Neumann et al.,Neumann et al. (1992) the rotational barrier between the two orientations can be estimated assuming that a simple sinusoidal hindrance potential can describe the rotational motion of the C60 anion. For small amplitudes of libration, the potential barrier is calculated as
where is the reorientation angle between neighboring potential minima, eV is the rotational constant for C60, and is the librational energy at a given and temperature. For we assume 44.5∘, meaning that a rotation about the axis of the molecule – which is approximately in the [111] direction – brings the molecule from one standard orientation to the other. We obtain a value for the potential barrier meV for K4C60 and 294 meV for Rb4C60 based on the observed at 100 K. These estimated potential barriers are comparable to C60 and much smaller than in K3C60 or Rb6C60,Neumann et al. (1993) indicating smaller crystal fields in A4C60. The smaller crystal field is a consequence of the larger free volume in the A4C60 compounds compared to A3C60 or A6C60.Sabouri-Dodaran et al. (2004)
The mean amplitude of the libration can also be calculated within the harmonic approximation from the librational energy via
The obtained values are shown in Table 4. The value of K4C60 at room temperature is fairly large, which is readily seen when comparing it with the 7∘ value of C60 near its phase transition.Copley et al. (1992) For C60, 7∘ is considered the critical angle for orientational melting. There are additional similarities between the temperature dependence of the librational peak in K4C60 and C60. The librational mode of K4C60 softens and widens with increasing temperature as in C60 Copley et al. (1992) and in the monomer phase of Na2RbC60 below their phase transition temperature during which the rotation of the molecules becomes free.Copley et al. (1992); Tanigaki et al. (1994); Christides et al. (1992) In Rb4C60 at room temperature, the librations increase only to 6∘ and the other trends are also absent.
Based on the above similarities in the temperature dependence of the librations between K4C60 and C60 we raise the possibility that K4C60 is close to an orientational melting transition at room temperature. This transition would be in accordance with the observed change of symmetry in the motion of C found at 250 K by NMR in K4C60.Zimmer et al. (1994) High temperature INS experiments are planned in order to search for this transition.
V Discussion
Two separate effects determine the distortion of fulleride anions in a lattice: the JT effect of the molecule and the crystal field of the external potential caused by the counterions. Our structural and spectroscopic results help to determine the relative importance of these two effects depending on cation size and temperature. We also discuss the importance of the two dynamic processes, pseudorotation and molecular reorientation, based on spectroscopy and neutron scattering.
The low-temperature phase of all three A4C60 salts studied can be modeled by the constructive interaction of the JT effect and the external potential, resulting in distorted fulleride ions. The molecular point group is identical to the crystal space group () of Cs4C60 and the largest common subgroup of and () of K4C60 and Rb4C60. Accordingly, Cs4C60 forms a true cooperative static Jahn-Teller state and the other two salts a static Jahn-Teller state with distorted ions randomly occupying the two standard orientations. Since the molecular symmetry is identical and the molecules are static at the time scale of the spectroscopic measurements, vibrational and electronic spectra are independent of the crystal structure. The reason why these structures are different has been given by Dahlke et al.Dahlke and Rosseinsky (2002) following Yildirim et al.:Yildirim et al. (1993) to minimize repulsive interaction between cations and anions due to orbital overlap.Fischer and Heiney (1993) According to this model, the orientational order in the orthorhombic phase of Cs4C60 appears to avoid close Cs–C contacts, which would arise in the disordered structure.Dahlke and Rosseinsky (2002) In the other two compounds where the free volume is larger, the two standard orientations remain but reorientation between them slows down. Dahlke et al.Dahlke and Rosseinsky (2002) estimated the critical value of the controlling parameter (closest cation-anion center distance minus the cation radius) to fall between the low-temperature phase of Cs4C60 and Rb4C60. With increasing temperature, Cs4C60 reaches this critical value and a phase transition to a tetragonal phase happens between 300 K and 623 K.Dahlke and Rosseinsky (2002) The crystal structure of Cs4C60 at high temperature and K4C60 and Rb4C60 at all temperatures are similar.Dahlke and Rosseinsky (2002); Kuntscher et al. (1997) According to our infrared results, the molecular point group in each compound is changing from to / upon warming, the transition temperature increasing with cation size. Lacking structural data at intermediate temperatures, we cannot tell whether the symmetry change in Cs4C60 coincides with the structural transition, but in K4C60 and Rb4C60, we definitely observe a change of molecular geometry without changing the crystal structure.
The distortion can only be realized when an external potential, like that of the surrounding cations, lowers its energy. As the temperature is raised, the lattice expands, and at the same time pseudorotation becomes more probable, both contributing to a competition between the molecular Jahn-Teller effect and the external potential. As the molecular ions decouple from the lattice, the tendency to behave as isolated ions gets stronger and thus the possibility of / distortions increases. The estimated distortion of C ions is the largest among the fulleride ions, larger than in C,Dahlke and Rosseinsky (2002) which further explains the difference in electronic properties between the two types of compounds. The significance of this effect relative to the crystal field increases with increasing temperature and increasing cation – anion distance. The scaling of the transition temperatures with cation size corroborates this assumption.
In the following we consider four possible structural models, depicted schematically in Figure 10. The dark background symbolizes the volume into which the molecule is confined by the crystal field; the growth of this area from model (1) to (4) indicates a decreasing strength of the crystal field due to heating or smaller cation size. The light blue areas represent the fulleride ions; the direction of the minor axis of an ellipse refers to the direction of the principal molecular axis. In the case of a distortion this principal axis intercepts two hexagon-hexagon bonds, while in the case of and distortions it goes through the centers of two hexagons and two pentagons, respectively (see Figure 1a). Thus the direction of the principal axis determines the point group of the molecule standing in a given orientation. This way the horizontal ellipse in the figure of model (3) corresponds to the pancake-shaped distortion. Ellipses in other directions should be considered as representing or distortions.
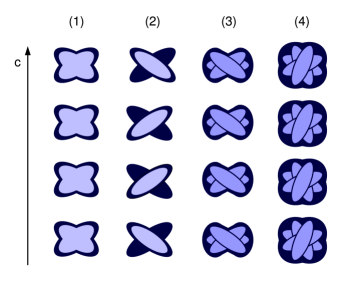
If the crystal field is very strong (model (1)), it causes a static distortion. It is possible, although not probable, that this distortion is identical to the pancake shape corresponding to the saddle point on the APES of isolated molecules. In a general case – like that of Cs4C60 – the distorted molecule has a different shape. The clover shape of the light blue region in the figure represents that of the anion found in Cs4C60 by neutron diffraction.Dahlke and Rosseinsky (2002) Model (1) works for both orthorhombic and tetragonal crystal field since the molecular point group is the same in both cases. The tetragonal crystal structure requires the average of the atomic positions over the crystal to exhibit D4h symmetry. As it has been mentioned earlier, one molecule cannot distort into this point group, but the spatial average of molecules randomly distributed over two standard orientations will produce the required fourfold axis.
In models (2) and (3), the crystal field is weaker than in the previous case, thus it allows the appearance of the squeezed / distortions, which are the minima of the molecules’ APES. The conversion between equivalent / distortions with the principal axis pointing in different directions could take place by pseudorotation through a pancake-shaped distortion.
In model (2), the intermediate distortion still leads to too short A–C distances, thus pseudorotation is not possible and the distortion is static. The distorted molecules can be arranged in the crystal either ordered in some way (staggered static state) or totally disordered regarding the direction of their principal axis.
In model (3) the crystal field is considerably weaker in some directions (e.g. in and ) than in others, thus molecules can extend in these directions. This way distortions can appear not only in different directions but also with different point groups. The pancake-shaped distortion is present as the most favored distortion of the crystal field and the / distortions are present because they are preferred by the molecular JT effect. Although the molecule is not free to take up distortions in any direction, the allowed distortions can convert dynamically among themselves. The MIR spectrum of this state would contain five lines originating from each molecular mode: three corresponding to molecules and two to / molecules. Similarly, sixfold splitting should appear in the NIR spectrum. Since fitting spectra with many more parameters invariably yields a better fit, we cannot distinguish between states with only and with both and / distortions.
In model (4) the crystal field is very weak, thus the molecule can perform free pseudorotation in the crystal just like an isolated molecule. As the potential is very nearly isotropic, the pancake-shaped distortion is no longer favored, and only the / distortions appear.
Models (3) and (4) contain dynamical disorder of distorted molecules. IR spectroscopy only detects the individual distortions and not their average if the timescale of the spectroscopic excitations is smaller than the time scale of pseudorotation.
The low-temperature phase of the three A4C60 salts corresponds to model (1), containing statically distorted molecules due to the strong crystal field. In Cs4C60 the abrupt change of the crystal field at the phase transition can result in a simultaneous change of the molecular distortion, to any of the models (2), (3) or (4). Further heating will lead to states with gradually weakening crystal field, in the order: model (2) model (3) model (4). In K4C60 and Rb4C60 the absence of a phase transition indicates a continuous transition from model (1) to models with / molecules. Such a continuous transition cannot lead from model (1) to model (2), though. The explanation is as follows. The possible configurations of a molecule in a crystal are those of the isolated molecule (corresponding to the lowest energy points of the warped trough of the APES), and those preferred by the crystal field ( distortions with the shape preferred by the surroundings of the molecule). A continuous transition can lead from the former to the latter only if there is no high energy barrier between them. The intermediate configurations are the saddle points on the trough of the APES. As these configurations have high energy in model (2), no continuous transition can lead to this state. Because model (3) and (4) contain dynamically distorted molecules, we conclude that on heating a static-to-dynamic transition takes place in K4C60 and Rb4C60.
Pseudorotation is not to be confused with molecular reorientation which we studied by inelastic neutron scattering. From the molecular point of view this motion is an abrupt rotation of the crystal field. During the rotation the distortion of the molecule should follow the change of the crystal field. Thus in the two standard orientations the direction of the distortions is different. INS data complement the spectroscopic results in two ways: they emphasize the possibility of the rotational motion around a axis, thus stressing its importance, and they prove the weakening of the crystal field with increasing temperature, through increasing librational amplitudes.
The results shown here are in good agreement with the 13C-NMR spectra of Ref. Brouet et al., 2002. Above 150 K the reorientational motion observed in our NIS measurement could correspond to a rotation around one of the four axes of the molecule on the long time scale of NMR measurements. Thus when the axis of this rotation changes with a lower frequency than that of the NMR measurement, it causes the observed NMR lineshape characteristic of uniaxial motion.Brouet et al. (2002) Below 150 K the reorientational motion could be static on the NMR time scale leading to the observed line broadening. Around 250 K the shape of the NMR line changes, which could correspond to the changing of the molecular symmetry from model (1) to model (3) or (4).
VI Conclusions
MIR and NIR measurements showed that the same molecular geometry change is present in K4C60, Rb4C60 and Cs4C60: the point group of the C molecular ion changes from to or on heating. Contrary to Cs4C60, where an orthorhombic-tetragonal transition takes place, we did not find a structural phase transition in K4C60 and Rb4C60. The absence of a phase transition can be explained by the smaller cation-anion overlap which does not stabilize the orthorhombic structure.
Since the molecular geometry change in K4C60 and Rb4C60 is not coupled to a phase transition, the fundamental role of the molecular Jahn–Teller effect in the transition is obvious. On heating, the importance of the Jahn–Teller effect is increasing as the potential of the surrounding cations decreases and the number of accessible degrees of freedom increases. The weakening of the crystal field on heating is also indicated by the INS results.
Because of the dominance of the crystal potential in the distortion, this distortion is static. In the case of K4C60 and Rb4C60 we suggest that a dynamic Jahn-Teller state develops as the / distortions appear.
From the splitting of the electronic transition around 1 eV we conclude that the energy bands in the solid reflect the Jahn-Teller distortion of the molecular ions; the presence of the 0.5 eV feature, which is forbidden in the molecule and therefore must be assigned to intermolecular excitations, signals the importance of electron-electron correlations in the solid. We regard the simultaneous appearance of these two features as experimental proof of the Mott-Jahn-Teller insulator state.Fabrizio and Tosatti (1997)
Acknowledgements.
We thank Gábor Oszlányi for his invaluable help with characterizing the samples by X-ray diffraction and most enlightening conversations. We also gratefully acknowledge useful discussions with Dan Neumann and Terrence Udovic. Financial support was provided by OTKA grants T 034198 and T 049338 and NSF-INT grant 9902050.References
- Fabrizio and Tosatti (1997) M. Fabrizio and E. Tosatti, Phys. Rev. B 55, 13465 (1997).
- Knupfer et al. (1996) M. Knupfer, J. Fink, and J. F. Armbruster, Z. Phys. B 101, 57 (1996).
- Knupfer and Fink (1997) M. Knupfer and J. Fink, Phys. Rev. Lett. 79, 2714 (1997).
- Brouet et al. (2002) V. Brouet, H. Alloul, S. Garaj, and L. Forró, Phys. Rev. B 66, 155122 (2002).
- Wachowiak et al. (2005) A. Wachowiak, R. Yamachika, K. H. Khoo, Y. Wang, M. Grobis, D.-H. Lee, S. G. Louie, and M. F. Crommie, Science 310, 468 (2005).
- Dahlke and Rosseinsky (2002) P. Dahlke and M. J. Rosseinsky, Chem. Mater. 14, 1285 (2002).
- Dahlke et al. (1998) P. Dahlke, P. F. Henry, and M. J. Rosseinsky, J. Mater. Chem. 8, 1571 (1998).
- Kuntscher et al. (1997) C. A. Kuntscher, G. M. Bendele, and P. W. Stephens, Phys. Rev. B 55, R3366 (1997).
- Bendele et al. (1998) G. M. Bendele, C. A. Kuntscher, and P. W. Stephens, in Molecular nanostructures, edited by H. Kuzmany, J. Fink, M. Mehring, and S. Roth (World Scientific, Singapore, 1998), p. 258.
- Iwasa and Kaneyasu (1995) Y. Iwasa and T. Kaneyasu, Phys. Rev. B 51, 3678 (1995).
- Kamarás et al. (2002) K. Kamarás, G. Klupp, D. B. Tanner, A. F. Hebard, N. M. Nemes, and J. E. Fischer, Phys. Rev. B 65, 052103 (2002).
- Chancey and O’Brien (1997) C. C. Chancey and M. C. M. O’Brien, The Jahn-Teller Effect in C60 and Other Icosahedral Complexes (Princeton University Press, Princeton, 1997).
- Jahn and Teller (1937) H. A. Jahn and E. Teller, Proc. Roy. London Soc. Ser. A 191, 220 (1937).
- Hebard et al. (1991) A. F. Hebard, M. J. Rosseinsky, R. C. Haddon, D. W. Murphy, S. H. Glarum, T. T. M. Palstra, A. P. Ramirez, and A. R. Kortan, Nature 350, 600 (1991).
- O’Brien (1996) M. C. M. O’Brien, Phys. Rev. B 53, 3775 (1996).
- Dunn and Bates (1995) J. L. Dunn and C. A. Bates, Phys. Rev. B 52, 5996 (1995).
- Tomita et al. (2005) S. Tomita, J. U. Andersen, E. Bonderup, P. Hvelplund, B. Liu, S. B. Nielsen, U. V. Pedersen, J. Rangama, K. Hansen, and O. Echt, Phys. Rev. Lett. 94, 053002 (2005).
- Harris and Sachidanandam (1992) A. B. Harris and R. Sachidanandam, Phys. Rev. B 46, 4944 (1992).
- Lukyanchuk et al. (1995) I. Lukyanchuk, N. Kirova, F. Rachdi, C. Goze, P. Molinie, and M. Mehring, Phys. Rev. B 51, R3978 (1995).
- Forró and Mihály (2001) L. Forró and L. Mihály, Rep. Progr. Phys. 64, 649 (2001).
- Kerkoud et al. (1996) R. Kerkoud, P. Auban-Senzier, D. Jérome, S. Brazovskii, N. Kirova, I. Luk’yanchuk, F. Rachdi, and C. Goze, Synth. Met. 77, 205 (1996).
- Ozaki and Takahashi (1986) M. Ozaki and A. Takahashi, Chem. Phys. Lett. 127, 242 (1986).
- Fischer and Heiney (1993) J. E. Fischer and P. A. Heiney, J. Phys. Chem. Solids 54, 1725 (1993).
- Yildirim et al. (1993) T. Yildirim, S. Hong, A. B. Harris, and E. J. Mele, Phys. Rev. B 48, 12262 (1993).
- Stephens et al. (1991) P. W. Stephens, L. Mihaly, P. L. Lee, R. L. Whetten, S.-M. Huang, R. Kaner, F. Diederich, and K. Holczer, Nature 351, 632 (1991).
- Paul et al. (1994) P. Paul, Z. Xie, R. Bau, P. D. W. Boyd, and C. A. Reed, J. Am. Chem. Soc. 116, 4145 (1994).
- Wan et al. (1995) W. C. Wan, X. Liu, G. M. Sweeney, and W. E.Broderick, J. Am. Chem. Soc. 117, 9580 (1995).
- Reed and Bolskar (2000) C. A. Reed and R. D. Bolskar, Chem. Rev. 100, 1075 (2000).
- Neumann et al. (1993) D. A. Neumann, J. R. D. Copley, D. Reznik, W. A. Kamitakahara, J. J. Rush, R. L. Paul, and R. M. Lindstrom, J. Phys. Chem. Solids 54, 1699 (1993).
- Fleming et al. (1991) R. M. Fleming, M. J.Rosseinsky, A. P. Ramirez, D. W. Murphy, J. C. Tully, R. C. Haddon, T. Siegrist, R. Tycko, S. H. Glarum, P. Marsh, et al., Nature 352, 701 (1991).
- Murphy et al. (1992) D. W. Murphy, M. J. Rosseinsky, R. M. Fleming, R. Tycko, A. P. Ramirez, R. C. Haddon, T. Siegrist, G. Dabbagh, J. C. Tully, and R. E. Walstedt, J. Phys. Chem. Solids 53, 1321 (1992).
- Poirier et al. (1995) D. M. Poirier, D. W. Owens, and J. H. Weaver, Phys. Rev. B 51, 1830 (1995).
- Larson and Dreele (2000) A. Larson and R. V. Dreele, Los Alamos National Laboratory Report LAUR pp. 86–748 (2000).
- Toby (2001) B. H. Toby, J. Appl. Cryst. 34, 210 (2001).
- A. Le Bail and Fourquet (1988) H. D. A. Le Bail and J. L. Fourquet, Mat. Res. Bul. 23, 447 (1988).
- Sabouri-Dodaran et al. (2004) A. A. Sabouri-Dodaran, M. Marangolo, C. Bellin, F. Mauri, G. Fiquet, G. Loupias, N. Mezouar, W. Crichton, C. Herold, R. Rachdi, et al., Phys. Rev. B 70, 174114 (2004).
- Krätschmer et al. (1990) W. Krätschmer, K. Fostiropoulos, and D. R. Huffman, Chem. Phys. Lett. 170, 167 (1990).
- Pichler et al. (1994) T. Pichler, R. Winkler, and H. Kuzmany, Phys. Rev. B 49, 15879 (1994).
- Kamarás et al. (1997) K. Kamarás, Y. Iwasa, and L. Forró, Phys. Rev. B 55, 10999 (1997).
- Rao et al. (1997) A. M. Rao, P. C. Eklund, J.-L. Hodeau, L. Marques, and M. Nunez-Regueiro, Phys. Rev. B 55, 4766 (1997).
- Homes et al. (1994) C. C. Homes, P. J. Horoyski, M. L. W. Thewalt, and B. P. Clayman, Phys. Rev. B 49, R7052 (1994).
- Torrance et al. (1975) J. B. Torrance, B. A. Scott, and F. B. Kaufman, Solid State Commun. 17, 1369 (1975).
- Neumann et al. (1992) D. A. Neumann, J. R. Copley, W. A. Kamitakahara, J. J. Rush, R. L. Cappelletti, N. Coustel, J. E. Fischer, J. P. McCauley, A. B. Smith, III, K. M. Creegan, et al., J. Chem. Phys. 96, 8631 (1992).
- Christides et al. (1993) C. Christides, K. Prassides, D. A. Neumann, J. R. Copley, J. Mizuki, K. Tanigaki, I. Hirosawa, and T. W. Ebbesen, Europhys. Lett. 24, 755 (1993).
- Reznik et al. (1994) D. Reznik, W. A. Kamitakahara, D. A. Neumann, J. R. D. Copley, J. E. Fischer, R. M. Strongin, M. A. Cichy, and A. B. Smith, III, Phys. Rev. B 49, 1005 (1994).
- Copley et al. (1992) J. R. D. Copley, D. A. Neumann, R. L. Cappelletti, and W. A. Kamitakahara, J. Phys. Chem. Solids 53, 1353 (1992).
- Christides et al. (1992) C. Christides, D. A. Neumann, K. Prassides, J. R. D. Copley, J. J. Rush, M. J. Rosseinsky, D. W. Murphy, and R. C. Haddon, Phys. Rev. B 46, R12088 (1992).
- Tanigaki et al. (1994) K. Tanigaki, I. Hirosawa, T. Manako, J. S. Tsai, J. Mizuki, and T. W. Ebbesen, Phys. Rev. B 49, 12307 (1994).
- Zimmer et al. (1994) G. Zimmer, M. Helmle, M. Mehring, and F. Rachdi, Europhys. Lett. 27, 543 (1994).