Stick slip motion in grain grain friction in a humid atmosphere
Abstract
We set up an original apparatus to measure the grain grain friction stress inside a granular medium composed of sodo-silicate-glass beads surrounded by a water vapor atmosphere.We analyze here the influence of the physico chemistry of water on our glass beads and its consequences on our shear experiment. We found two scales in the analysis of the shear stress signal. On the microscopic scale of one bead, the experimental results show a dependence on the size of beads, on the shear rate and on humidity for the resulting stick slip signal. On the macroscopic scale of the whole assembly of beads, the behavior of the total amplitude of the shear stress depends on the size of the beads and is humidity dependent only for relative humidity larger than 80%. For high degrees of humidity, on the microscopic scale, water lubricates the surface of the beads leading to a decrease in the microscopic resistance to shear while on the macroscopic scale the resistance to shear is increased: the assembly of very humid grains behaves as a non Newtonian fluid.
pacs:
83.80.-k; 82.70.-y; 83.80.FgI Introduction
Granular materials are actually very simple: they consist of a great number of macroscopic particles interacting only with their neighbours. In case of dry samples, the sole interactions are hard core repulsion and friction. However, in spite of their apparent simplicity, their behaviour can be very complex and often surprising degennes ; jaeger ; jaeger2 .
Stick slip motion has been observed in various frictional experiments from solid-on-solid friction of rough surfaces heslot to delicate studies of lubricated films between smooth mica surfaces gee . Since one of the dominating interactions in granular materials is friction among grains, it is not surprising that dense granular materials exhibit various stick slip phenomena. There are many examples of stick slip behaviour in granular materials. In the first type of experiments stick slip sliding between a granular medium and a solid body is considered duran ; nasuno ; nasuno2 ; geminard ; ovarlez ; lubert ; deryck ; frye ; lacombe . In the second class of experiments the granular sample is forced to deform slowly; an intermittent motion is caused by successive discrete reorganization events inside the material. Experiments in elastic annular shear cells revealed both regular cain and irregular miller ; dalton stick slip behaviour. In the third class, it is friction between grains themselves which is studied coste . The formation and breakage of chain forces are an explanation to the stick slip geng . Moreover, comparison between a sheared granular medium and avalanches in the same type of media has been made manna .
Humidity changes the interactions between grains: for example chemical reactions olivi ; gayvallet or mechanical behaviour bocquet ; fraysse ; restagno . Experiments have been made on the increase of the maximum angle of stability of a humid granular media as a function of the quantity of liquid added to the medium albert ; barabasi or as a function of the humidity ratio of the surrounding atmosphere fraysse . In friction experiments, the effect of humidity has also been studied ovarlez ; frye ; cain ; dieterich .
We will study here the effect of an under-saturated water vapor atmosphere on the behaviour of a granular medium submitted to shear. The friction studied here is a grain grain interaction obtained with an adapted apparatus. The experimental set-up and experimental conditions will be detailed in section II. Results will be discussed in section III. And finally section IV contains the conclusion.
II Experimental Procedure
II.1 Set up
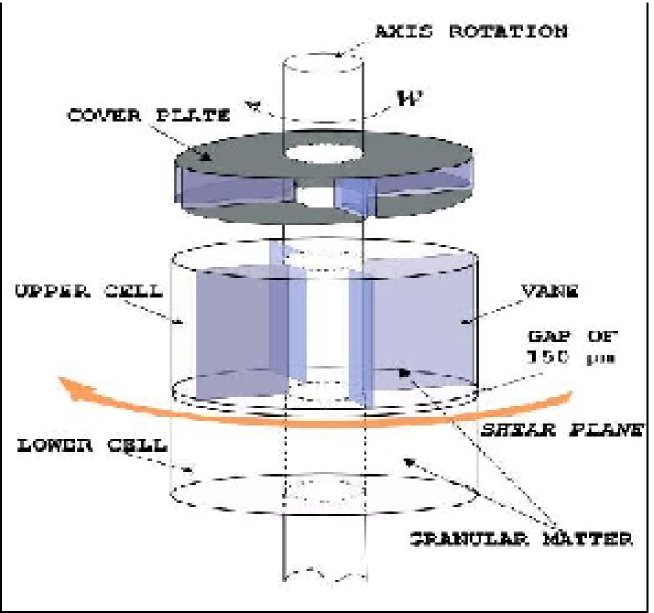
We built an annular shear cell with an inner radius of 14 , an outer radius of 31 and of 40 depth. The shear cell is made of two parts: one lower and one upper. The lower part remains motionless and has a depth of 20 , while upper part rotates freely; this last has a depth of 20 and is divided by four large vanes (see fig.1). A gap of about 150 is kept between the lower and the upper part to prevent any friction between the two parts; this gap is small enough to prevent the grains from escaping the shear cell. Granular matter fills the lower part and half of the upper part. Such a shear apparatus allows us to measure the shear force between the granular matter contained in the lower part and the granular matter contained in the upper part. This shear force is measured with a viscometer HAAKE VT550 (measuring a 0.01-100 Pa range in shear forces for rotation speeds 0.1-800 rpm); moreover the data sampling frequency is 5 to 10 times per second. A cover plate introduces a small constant normal load (about 150 Pa) on the granular matter; this cover is free to move vertically, which allows the dilatancy associated with the shear behavior.
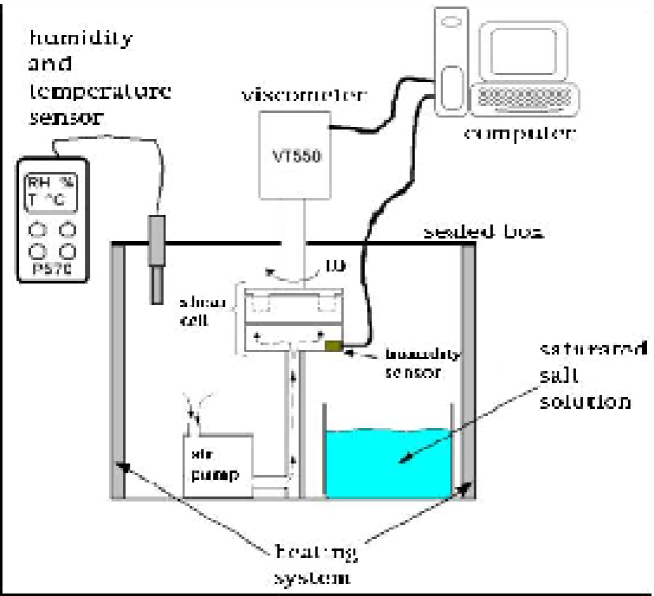
The annular shear cell is kept inside a sealed heating unit, in which temperature (30) is controlled by an adjustable water flow. In order to control humidity, we used the method implemented by Restagno et al. restagno in which aqueous solutions saturated with inorganic salts provide various levels of relative humidity (RH) in the atmosphere, at a given temperature. For instance, to obtain a high humidity level (95 % RH), we used an ammonium dihydrogen phosphate () solution and to obtain a low humidity level (about 5% RH) we used silica gel. A small air pump forces the humid atmosphere to flow through the shear cell. We have checked that the relative humidity is homogeneous throughout the shear cell. During the experiments, relative humidity is measured inside and outside the shear cell using two humidity sensors, having an accuracy of RH.
II.2 Preparation of the samples
One type of granular materials has been used in the experiments: glass beads (sodo silicate glass, Potters Ballotini).
Following is the procedure used for the measurements:
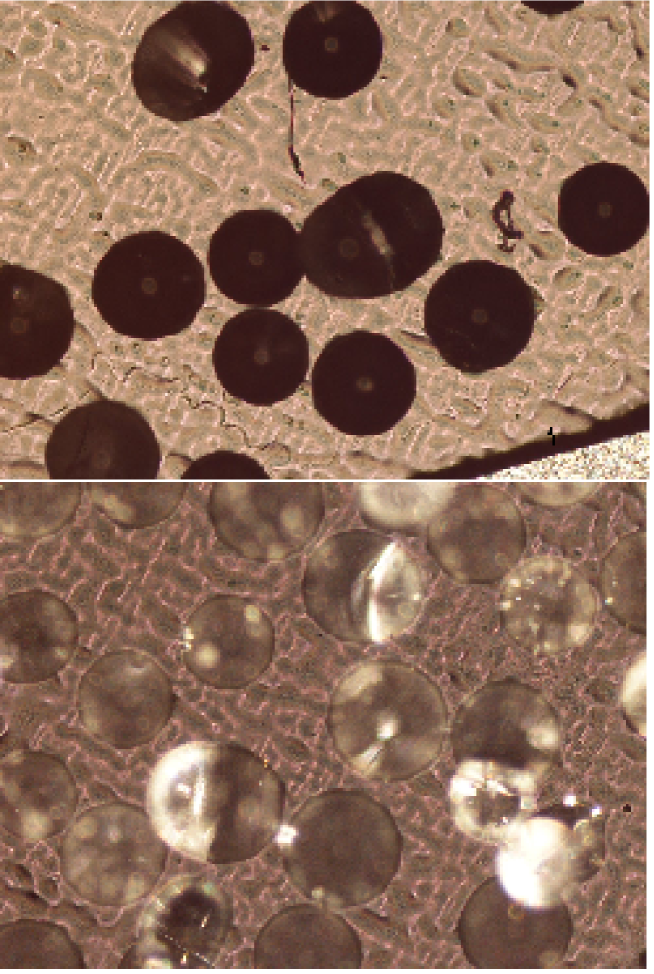
(1) The beads are washed with distilled water and a cleaning solution (RBS-25), then they are dried in an oven ( 12 hours at 130oC). After that, the dried beads are sifted using either two sieves of 315 and 400 m pore size or two sieves of 630 and 800 m pore size. Note that the cleaning removes the powder which is added to commercially available glass beads in order to prevent the formation of clusters in presence of a humid atmosphere. See for that fig. 3 which is a view taken with an optical microscope using polarized light, of washed glass beads and non washed glass beads: the non washed glass beads do not transmit polarized light while washed beads do. This is the proof of the presence of an additive on the surface of the glass beads.
(2) The beads are then poured into the sheared cell and the cover plate is put. The granular matter is then sheared in order to ensure the cover plate to be horizontal.
(3) The saline solution is then introduced in the experimental set-up, and the set-up is kept aside for 7 hours in the temperature controlled environment, to achieve a constant temperature and a homogeneous distribution of humidity.
(4) Before starting the measurement, we rotate the shear cell for 40 s at an angular velocity of 3.14 rad.s-1. This defines the initial state of the granular sample.
(5) The shear stress is then measured for 600s at a small angular velocity. Before each new measurement, the sample is changed.
III Results and Discussion
III.1 Results
We studied the behaviour of the shear response of the granular medium, at several levels of humidity ranging from 0 to 100 %. Shear stress is plotted as a function of the dimensionless linear displacement , defined as , where is the angular velocity of the viscometer, the mean cell radius, the time and the mean diameter of the beads.
We studied the system for 2 values of the angular velocity: 1.7.10-3 rad/s and 6.9.10-3 rad/s. At such small angular velocities, the system is in a quasi static regime.
First of all, we have to make a difference between the mean amplitude MA of the stress signal (difference between one local maximum and the very next local minimum of the signal) and the mean value MV (i.e. absolute value) of the same signal.
We observed a stick slip signal which corresponds to the relaxation motion of the system (see fig.4). Just after there is a transient regime where the stress increases up to a maximum value and then decreases. This transient regime is not reproducible between two experiments: the maximum of the shear stress depends on the initial configuration of the beads. Hence it is not possible to analyze the total cohesion of the system by the way of the maximum value of the shear stress.
After this transient regime, the permanent regime is reached (see fig. 4 again). The stick slip signal is quite irregular due to the small individual displacements of the beads. Note that there is an obvious difference between the stick slip signal for a low humidity (13 % RH) and for a high humidity (93 % RH): the mean value MV of the stress signal for a low humidity is smaller than that for a high humidity and the amplitude MA of the stress signal is larger for a higher value of the humidity. Let us examine in details, in the following, these signals.
We computed the maximum and minimum values of each stick-slip event during the permanent regime, i.e. after each stick event ( local increase of the signal), the local maximum was saved and after each slip event ( local decrease of the signal), the local minimum was saved. This allowed us to compute the averages of the local maxima and local minima during the permanent regime over which we saved the stress signal during 600. From these mean maximum and minimum, a mean amplitude MA was deduced over the same duration of the permanent regime.
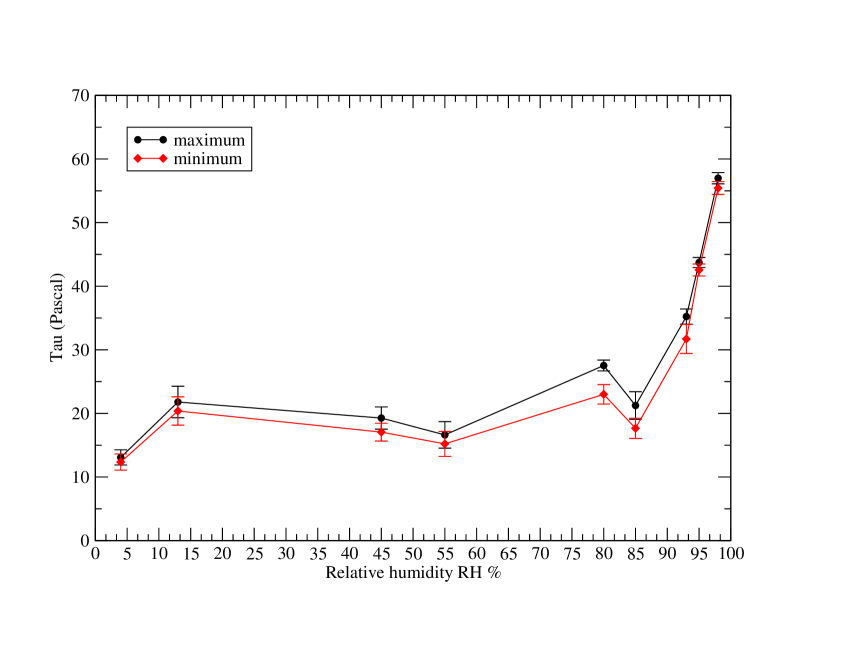
Fig.5 corresponds to the mean maximum and minimum as a function of relative humidity RH. The diameter of the beads used here was enclosed between 630 and 800 m, while the angular velocity of the shear cell was equal to 1.7.10-3 rad/s. The curve corresponding to minima is first quasi constant then increases abruptly from a value of 88 % RH on. The curve corresponding to maxima increases regularly until the largest value of the stress is reached.
Fig.6 corresponds also to the mean maximum and minimum as a function of relative humidity RH, but this time, the diameter of the beads was enclosed between 310 and 400 m and the angular velocity was equal to 6.9.10 rad/s. Here, on the contrary to fig.5, the two curves corresponding respectively to maxima and minima follow the same behavior and increase first with a small slope then from value of 85% RH on, with a large slope.
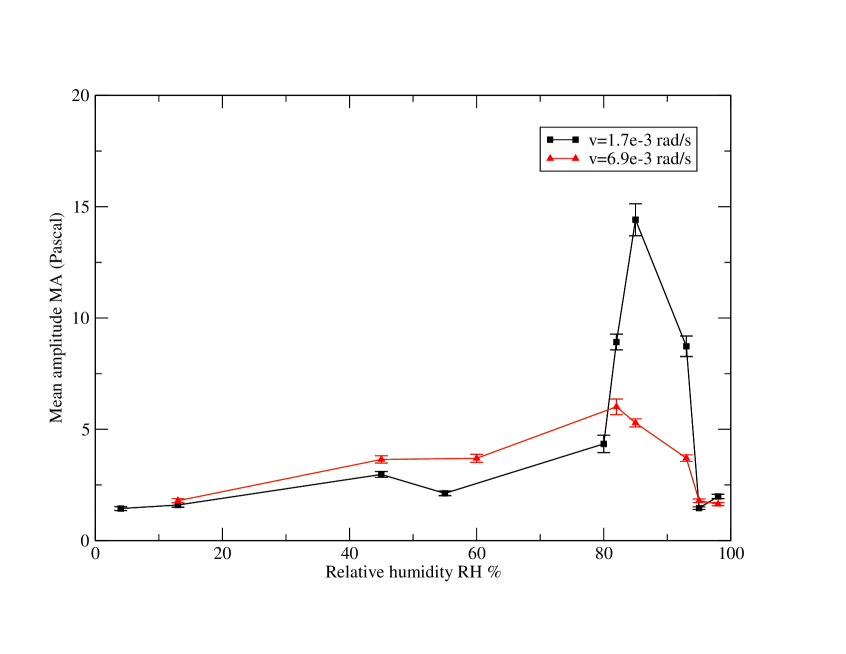
To understand the differences between the preceding behaviors, let us examine fig.7 and fig.8. Fig.7 corresponds to the mean amplitude MA of the stick slip signal as a function of relative humidity RH for 630-800m diameter large beads. Two curves have been traced on fig.7: the mean amplitude MA (for a angular velocity equal to 1.7.10-3 rad/s) is first constant then increases from RH=55% on and finally decreases from RH=90 % on. The other curve (corresponding to a angular velocity equal to 6.9.10-3 rad/s) has a similar behaviour, with a maximum which is lower. Fig. 8 corresponds to the mean amplitude MA of the stick slip signal as a function of relative humidity RH for 315-400 m diameter large beads. Here again the same velocities as for fig.7 have been imposed to the shear cell. We observe a similar behavior of the two curves which have been traced on fig.8 than that on fig.7.
III.2 Discussion of results in the light of the geometry of the assembly of beads
The difference of amplitudes (MA) between two experiments comes from the number of contacts inside the granulate: if this number is relatively large, the stick stage will have a longer duration (because the granulate can resist a larger shear stress) and hence, the observed stress will be larger until the end of the stick stage where the granulate begins to relax.
In the light of these preceding 2 figures (Fig. 7 and Fig. 8), we can say first,that there is a velocity dependent behavior of our beads under shear, second, that the size of the beads has also an influence on their behavior. We can analyze the role of the angular velocity in terms of number of contacts between the beads. For the largest angular velocity that we used, the number of constant contacts (number of contacts which are not lost during one stick stage) between the beads is smaller as the contacts have a larger probability to be lost during the shear process due: i.e. the number of lost contacts per second is larger. This explains why the maximum mean amplitude MA for RH=90%, m is lower for =6.9.10-3 rad/s than for =1.7.10-3 rad/s (Fig. 7). Similarly, the size of the beads plays the same role in terms of number of constant contacts between the beads for one stick stage: if the glass beads are larger, the total number of contacts between particles is smaller inducing a smaller resistance to shear and hence smaller amplitudes MA of the stick-slip stress (Fig. 5 and 6). These two behaviors have an effect on a very short time corresponding to a microscopic length.
Let us examine now the behavior of the mean value MV, i.e. the action of shear on humid beads on the macroscopic level. If we compare the mean values of the maxima of the MV (resp. minima) in figures 5 and 6, the MV is larger for larger beads. So we can say that the macroscopic resistance to shear is larger for larger beads. Humidity has an effect on this macroscopic behavior only for high degrees of humidities. We will analyze this last behavior in section V-C.
III.3 Physico chemistry of water on glass
Let us recall some previous results about the interaction between water and sodo silicate glass beads olivi ; gayvallet ; iler ; ehrenstein . Under the influence of humidity or water a reaction of the glass bead surface with water follows that forms a ’water skin’. The alkali ions of the glass surface are taken out of the silicic acid structure and are replaced by protons. So grows a permanent water-skin that cannot be taken away, not even under a vacuum. With longer influence of water there grows, in addition, a very strongly adhering temporary water-skin, which thickness depends on the temperature and the degree of humidity, which can be taken away by drying. Through the presence of water, the strength of the glass bead surface can be reduced. Note also that our glass beads have been washed with a commercial cleaning solution (RBS-25). This cleaning solution is basic. The attack of bases on glass increase with increasing temperature and time. Our glass beads have been washed in a aqueous solution containing 90 % distilled water and 10 % cleaning solution (RBS-25) for at ambient temperature. The resulting pH of the cleaning solution was equal to 12. Roughly, the following reactions occur under the action of alkali at the glass surface:
| (1) |
where and others. And:
| (2) |
The rate of corrosion (resp. dissolution) is not determined by a diffusion controlled process but by the active dissolution of the network ehrenstein . The loss of mass is proportional to time. The smooth surface of the beads under the two water-skins (permanent and temporary) gets rough. This is analogous to an aging process, but not during the shear experiment itself, but during the preparation of the granular sample.
The surface of the glass beads was also attacked by the basic cleaning solution: the silicic structure of the surface allows water to penetrate more profoundly and hence leading to a thicker adsorbed water layer.
III.4 Discussion: microscopic scale
On the microscopic scale, there are three regimes occurring during the shearing experiment and as a function of humidity.Here we will follow the theory of Halsey and Levine halsey . We can say, that for RH lower than 50%, the quantity of water on the surface of the beads is not sufficient to change their behavior during shear compared to the shearing of ’dry’ beads.The friction process between the beads is dominated by the deformation of the nano asperities on the surface of the beads and the resistance to shear of the beads surface is negligible halsey . Between RH=50% and RH=90%, is the friction regime halsey : we can say that the water adsorbed layer on the surface of the beads induce a non negligible resistance to shear on the microscopic scale inducing an increase in the amplitude MA of the stick slip signal. And finally between RH=90% and RH=100%, the quantity of water on the surface of the beads is sufficient to obtain a lubrication of the surface of grains (i.e. always on the microscopic scale), and hence, the microscopic resistance to shear decreases, and so does the amplitude MA. In that last case, the quantity of water on the surface of the beads dissolves the sodo-silicate glass. This behavior of the shear stress as a function of the relative humidity leads to the conclusion that the the quantity of water increases first cohesion on the scale of one bead and then decreases it, for short time intervals.
III.5 Discussion: macroscopic scale
On the macroscopic scale, and for humidity ranging from 0 to 80 %, the resistance to shear of humid beads is similar to that of dry beads (increased resistance to shear for large beads with respect to small beads, if comparison is made between fig 5 and 6). This behavior is the consequence of geometrical congestion for relatively monodisperse spherical beads.
Always on the macroscopic scale, the action of water on the beads is only visible when its quantity is sufficient (RH larger than 80 %) to attack and lubricate the surface of the beads. Then the assembly of beads has its resistance to shear increased (value of the MV of the shear signal, Fig. 5 and 6) when the quantity of water is high: a comparison may be made with dense colloidal dispersions under shear.
It may seem contradictory that for high degrees of humidity, on the microscopic scale water lubricates the surface of the beads leading to an increased resistance to shear on the macroscopic scale. This may be a consequence of the non Newtonian characteristics of very humid grains. Let us compare the very humid glass beads with colloidal dispersions. Each colloidal particle has a repulsive interaction with other colloidal particles (the attractive part of the interaction can be neglected), but dense colloidal dispersions observe a solid like behavior under shear even if there is no attractive interactions between the particles botet : when no shear is applied the colloidal dispersion is fluid like becoming solid like as soon as shear is applied on it. Indeed, the behavior of dense colloidal dispersions is non Newtonian and observes a transition from fluid like to solid like as a function of the concentration of the colloidal dispersions and as a function of shearing rate botet .When the colloidal dispersion is in the solid like state, its resistance to shear is increased compared to the state where it is fluid like.
Similarly, the humid glass grains are lubricated and the microscopic resistance to shear decreases when humidity is larger than 90%: the beads have a non attractive contact force like colloidal particles. The explanation of the apparently contradictory behaviors on microscopic and macroscopic scales may be that the very humid granulate is non Newtonian leading to a higher macroscopic resistance to shear: the assembly of grains observes a transition from a divided media to a solid like state under shear.
So we join the conclusion of Tegzes tegzes , that for high degrees of humidity, the assembly of grains behaves as a non Newtonian fluid (a viscoplastic fluid).
IV Conclusion
There are two scales which appear in grain grain friction for a shearing experiment on glass beads in a water vapor atmosphere.
On the microscopic scale, the effect of humidity can be separated into three regimes: the asperity regime where humidity has a negligible role, the friction regime where the surface area of contacts between beads increases the cohesion of the granular medium and a lubricated regime where the quantity of water is sufficient reduce the viscosity of the surface of the beads. Moreover, there is a size effect in the cohesion of the granulate: for large beads, the number of contacts per unit volume between particles is smaller tan for small beads leading to a smaller total cohesion. The effect of shear rate is similar: for higher shear rates, the number of lost contacts per unit time increases leading also to a smaller total cohesion.
On the macroscopic scale, the behavior of the resistance to shear is similar to that of dry grains if RH is lower than 80%. For RH larger than 80%, the assembly of beads behaves as a non Newtonian fluid becoming solid like under shear.
References
- (1) de Gennes. P.G., Rev. Mod. Phys. 71 (1999) 374
- (2) Jaeger H.M. and Nagel S.R., Science, 255 (1992) 1523
- (3) Jaeger H.M., Nagel S.R. and Behringer R.P., Rev. Mod. Phys. 68 (1996) 1259
- (4) Heslot F., Braumberger T., Perrin B., Caroli B. and Caroli C., Phys. Rev. E 49 (1994) 4973
- (5) Gee M.L., McGuiggan P.M., Israelchvili J.N. , J.Chem.Phys. 93 (1990) 1895
- (6) Duran J., Sand, Powder and Grains: an introduction to the physics of granular materials (Springer, New-York, 2000)
- (7) Nasuno S., Kudrolli A., Bak A. and Gollub J.P., Phys. Rev. E 58 (1998) 2161
- (8) Nasuno S., Kudrolli A. and Gollub J.P., Phys. Rev. Lett. ,79 (1997) 949
- (9) Géminard J.C., Losert W. and Gollub J.P., Phys. Rev. E 59 (1999) 5881
- (10) Ovarlez G., Kolb E. and Clément E., Phys. Rev. E 63 (2001) 061312
- (11) Lubert M. and de Ryck A., Phys. Rev. E 63 (2001) 021502
- (12) de Ryck A., Condotta R. and Lubert M., Europ. Phys. J. E, 11 (2003) 159
- (13) Frye K.M. and Marone C., Geophys. Res. Lett. 29 (2002) 1916
- (14) Lacombe F. Zapperi S. and Herrmann H.J., Europ. Phys. J. E 2 (1999) 181
- (15) Cain R.G. Page N.W. and Biggs S., Phys. Rev. E 64 (2001) 016413
- (16) Miller B., O’Hern C. and Behringer R.P., Phys. Rev. Lett. 77 (1996) 3110
- (17) Dalton F. and Corcoran D., Phys. Rev. E 63 (2001) 061312
- (18) Coste C. Phys. Rev. E 70 (2004) 051302
- (19) Geng J. and Behringer R.P., arXiv : cond-mat/0406327, 2004)
- (20) Manna S.S. Khakhar D.V., Phys. Rev. E 58 (1998) 6935
- (21) Olivi-Tran N., Fraysse N., Girard P., Ramonda M. and Chatain D., Eur. Phys. J. B., 25 (2002) 217
- (22) Gayvallet H. and Géminard J.C., Eur. Phys. J. B 30 (2002) 369
- (23) Bocquet L., Charlaix E., Ciliberto S. and Crassous J., Nature 396 (1998) 735
- (24) Fraysse N., Thomé H. and Petit L., Eur. Phys. J. B 11 (1999) 615
- (25) Restagno F., Ursin C., Gayvallet H. and Charlaix E., Phys. Rev. E 66 (2002) 021304
- (26) Albert R., Albert I., Hornbaker D., Schiffer P. and Barabasi A.L., Phys. Rev. E 56 (1997) R6271
- (27) Barabasi A., Albert R. and Schiffer P., Physica A 266 (2004) 366
- (28) Dieterich J.H. and Conrad G. J. of Geophysical Res. 89 (1984) 4196
- (29) Ehrenstein G.W., Schmiemann A., Bledzki A., Spaude R., Handbook of Ceramics and Composites (N.P. Cheremissinoff Eds., New York and Basel 1990)
- (30) Iler R.K., The chemistry of glass (Wiley, New-York 1979)
- (31) Halsey T.C. and Levine A.J., Phys. Rev. Lett. 80 (1998) 3141
- (32) Tegzes P., Albert R., Paskvan M., Barabasi A.-L., Vicsek T., Schiffer P., Phys. Rev. E 60(1999) 5823
- (33) Olivi-Tran N.,Botet R., Cabane B., Phys. Rev. E 57 (1998) 1997