Negative thermal expansion of MgB2 in the superconducting state and anomalous behavior of the bulk Grüneisen function
Abstract
The thermal expansion coefficient of MgB2 is revealed to change from positive to negative on cooling through the superconducting transition temperature . The Grüneisen function also becomes negative at followed by a dramatic increase to large positive values at low temperature. The results suggest anomalous coupling between superconducting electrons and low-energy phonons.
pacs:
65.40.-b, 74.70.Ad, 74.62.FjSuperconductivity in the binary compound MgB2 near 39 K is a fascinating development. Over the last few years, scientists have argued that a lattice instability slusky and/or anomalous phonon behavior an might be responsible for the high transition temperature. Specific attention has focused on the phonon, a bond-stretching phonon within the plane of the hexagonal crystal structure an ; gonc ; mialitsin . In-plane tensile strain, induced by lattice mismatch through thin-film growth, increases the superconducting transition temperature to 41.8 K; this enhancement was attributed to a decrease in the phonon frequency pogr . Phonons can be studied with techniques such as Raman spectroscopy gonc ; mialitsin and heat capacity wang ; bouq ; fisher . Often neglected in the study of phonons is thermal expansion, partly because of the exceptional resolution needed to resolve the transition at .
Thermal expansion from powder diffraction measurements jorg ; xue of MgB2 have revealed an anomalous volume expansion on cooling below . However, high-resolution thermal expansion measurements (dilatometry) with a relative sensitivity approximately four orders of magnitude better than powder diffraction are required for meaningful thermodynamic analysis. Such measurements of polycrystalline MgB2 were reported lortz , but discrepancies with the diffraction data, such as the temperature at which the thermal expansion coefficient changes from positive to negative, are apparent.
In this Letter, high-resolution thermal expansion measurements of polycrystalline MgB2 are presented. The results reveal a change in sign of at , with negative thermal expansion below ; these data agree with diffraction investigations jorg ; xue , but offer exceedingly greater detail. Analysis of the bulk Grüneisen function reveals anomalous behavior due to dominant low-energy phonon modes. The change in sign of at precisely suggests a connection between these phonon modes and superconductivity.
MgB2, synthesized with 11B as described previously hinks , was pelletized (diameter = 4.6 mm), placed in a boron nitride crucible and heated to 800 ∘C for 30 min at 3 GPa using a cubic multi-anvil press. A very thin black layer, impurities from surface reaction with boron nitride, was removed, leaving behind a brilliant gold-colored MgB2 sample with density 2.56 g/cm3 (100% of theoretical density). Heat capacity was measured with a thermal-relaxation technique. versus pressure was determined inductively (0.12 Oe rms field at 1023 Hz) to 0.63 GPa using a helium pressure medium; a manganin sensor at room temperature served as a manometer tomita .
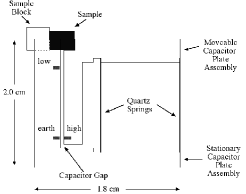
Thermal expansion was measured with a novel capacitive dilatometer cell (Fig. 1) constructed from fused quartz JJN , which has among the smallest known thermal expansions quartz . Calibration is realized by measuring copper swen at 300 K and 79.3 K, where the length change of fused quartz, /300K, is zero quartz . During measurements, the sample and cell (in thermal equilibrium) are warmed at 0.2 K/min as capacitance and temperature are recorded at intervals ranging from 0.1 to 0.2 K. The data are corrected for temperature-dependent changes in capacitance of the empty cell, measured in a separate experiment, and the differential expansion of the cell/sample using data for quartz quartz . These contributions amount to 2.7 % and 4.1%, respectively, of the capacitance change due to the thermal expansion of MgB2 over the temperature range 6 K 300 K; the latter correction would be 63 times larger if a conventional copper dilatometer cell were used to measure MgB2, because of copper’s large thermal expansion swen . The specimen was measured along two perpendicular axes (4238 m and 3665 m long) to search for preferred crystallographic orientation effects (none were detected).
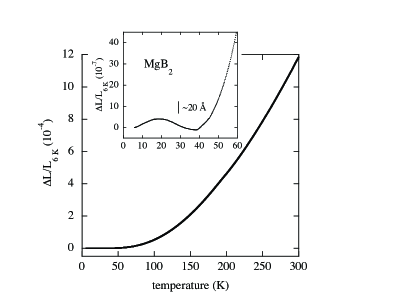
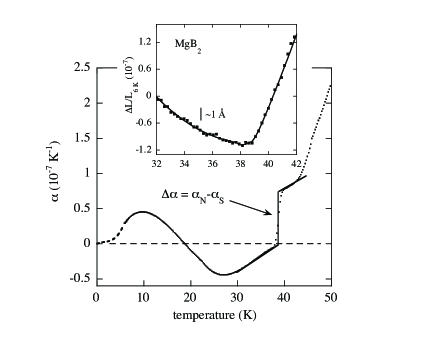
Linear thermal expansion / is shown in Fig. 2. These raw data have been corrected for the thermal expansion of quartz as described above with no other processing. The length decreases with temperature, as occurs in most materials, but it expands on cooling below = 38.7 K as illustrated in the inset where the 20 Å scale reveals the absolute length change of the 4238 m long specimen. The distinct change in / near is highlighted further in the inset of Fig. 3 where angstrom-scale resolution and the continuous (second-order) nature of the phase transition are evident. The measurement was repeated 3 times along the 3665 m length and 3 times along the 4238 m length with similar results to those shown in Figs. 2 and 3. The overall linear expansion / = 119.2(4)x10-5.
The thermal expansion coefficient = / is obtained by fitting the data in Fig. 2 using Chebyshev polynomials and differentiating; overlap between neighboring fit regions assures a smooth derivative and caution is exercised near the sharp feature at . This method is typical for taking derivatives when tiny changes between neighboring data points occurs numer . The resulting values are plotted between 0 and 50 K in Fig. 3; all six measurement showed similar behavior. Note that (50 K) is 16.7 times smaller than that of copper swen , a consequence of the large Debye temperature of MgB2 bouq . Negative thermal expansion sets in at precisely and further inspection reveals a crossover at 18.7 K to 0. Furthermore, a broad peak is evident in at 9.7 K, below which it decreases. According to the third law of thermodynamics, should approach zero at = 0; this behavior is illustrated by the (hypothetical) dashed line in Fig. 3.
The jump in at (solid lines Fig. 3), = N-S = 6.3(7)x10-8 K-1,was obtained after averaging the jumps observed in six measurements; represents the normal state and the superconducting state. This value agrees with = 5.8x10⁻⁸ K-1 reported previously lortz ; in that report, 0 below 10 K, but remained above zero for 10 K. These differences may be associated with: (1) the high density of our specimen, since polycrystalline MgB2 prepared by the method in Ref.lortz is highly porous with low cohesiveness and elastic modulus harms , (2) the higher (38.7 K vs. 37.8 K), or (3) the copper thermal expansion cell used in Ref. lortz which requires a significantly larger correction to the data than our cell (see above). Behavior in / similar to that of Fig. 2 was revealed in diffraction measurements jorg ; xue , but the present data offer far more detail.
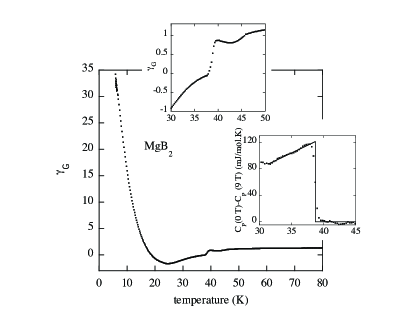
Heat capacity at constant pressure was measured on the same sample. A background of the form = + + (, , and are constants) is subtracted, which was obtained by fitting (9 tesla) in the range 25 K 50 K; the form of this background is identical to that used previously bouq . A clear feature is observed at = 38.7 K (lower inset of Fig. 4). The solid lines denote the step-like behavior expected for a continuous (second-order) phase transition. Using an entropy-conserving construction, the jump = -121(1) mJ/mole K is estimated.
The Ehrenfest relation
| (1) |
provides the connection between the pressure derivative of , , and ( is the molar volume). It has yielded / in agreement with experiment for other superconductors meingast ; kund . Using = 6.3(7)x10-8 K-1, = -121(1) mJ/mole K, and = 1.74x10⁻⁵ m3/mole jorg , / = -1.05(13) K/GPa is obtained. Variation in values (66 mJ/mole K to 133 mJ/mole K) fisher underscores the importance of measuring and on the same sample to reliably estimate /.
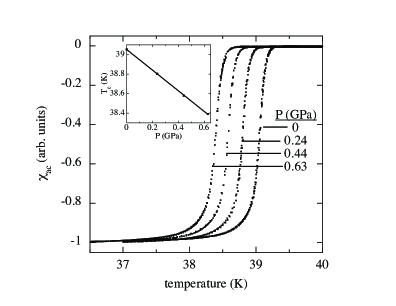
To test the calculation via Eq. (1), / was measured on our sample using a purely hydrostatic method. Pressure was changed below 55 K and only one transition (P = 0.63 GPa) was measured in solid helium. was determined from the midpoint of the superconducting transition in the real part of the ac magnetic susceptibility. The data (Fig. 5) show that decreases at / = -1.07(0.03) K/GPa, similar to prior reports tomita . This value is in excellent agreement with the value predicted by the Ehrenfest relation. This observation together with the continuous behavior of / eliminates the possibility of a significant lattice instability in MgB2 for 6 K 300 K.
While negative thermal expansivities are not that unusual barrera , the crossover of from positive to negative, at precisely , is rare. Tantalum exhibits a slight negative white below = 4.4 K; what distinguishes this feature in MgB2 is that is eight times larger above , and that it becomes strongly negative below . Thus, the electronic transition into the superconducting state has a significant impact on the thermal expansion at and below as revealed in Figs. 2-3.
Thermal expansion is a sensitive probe of phonon behavior which is analyzed through the bulk Grüneisen function = /CV calculated using data harms for the bulk modulus and our measurements of the volume thermal expansion coefficient = 3, and (the heat capacity at constant volume CP ). It is a dimensionless weighted sum barrera of i values (i.e., G = /) each associated with a phonon mode of vibrational frequency i and = /. G has a value of 1.30 near 300 K, rises slightly to 1.35 at 90 K followed by a gradual decrease. This decrease continues (see Fig. 4), until G crosses zero at , reaches a minimum of -1.65 at 24.5 K, before increasing to 34.2 at 5.8 K. Nonmonotonic behavior of the Grüneisen function is a consequence of strong anharmonic lattice vibrations abdullaev , which have been observed in MgB2 gonc ; mialitsin . The negative as well as the large positive values of G must be associated with anomalous phonon modes that dominate the weighted sum due to their respective thermal populations; electron-phonon interactions will also play a role.
In other layered materials, negative values are generally associated with transverse acoustic vibrations, which propagate in the layers abdullaev , leading to negative a-axis values. As a result, the change in sign of and G at , coincident with hardening of the E2g phonon mialitsin , is likely connected to planar electron-phonon interactions associated with the -band (in-plane) superconducting gap choi ; souma .
At low temperature, differences in the intralayer bonding (along the c-axis) may lead to low-energy phonon excitations and large c-axis values with high relative thermal population that cause the upturn of below 20 K; such behavior occurs in other layered materials, albeit with significantly smaller values of abdullaev . In MgB2, the spectacular increase of G coincides with a reduced below 11 K, attributed to a second superconducting gap wang ; bouq . Thus, is diminished because of electronic effects due to the second gap, remains large, and their ratio leads to anomalously large G values. These combined considerations suggest that the increase in G at low temperature may result from out-of-plane electron-phonon interactions, associated with the weaker -band superconducting gap choi ; souma , which have a strong impact on the c-axis values.
The results presented here compliment spectroscopic phonon probes, some of which may be surface sensitive, by illustrating unusual phonon behavior in two fundamental bulk thermodynamic quantities, the Grüneisen function and the thermal expansion coefficient. Thermal excitations of electrons across the two superconducting gaps, and their coupling to low-energy lattice vibrations, play a role in the anomalous behavior of and .
Acknowledgements.
Thanks to J. Macaluso (Research Experiences for Undergraduates student) for constructing the dilatometer cell, R. Bollinger and H. Terashita for assistance, W. E. Pickett, A. Serquis and V. F. Nesterenko for comments. This material is based upon work supported by the National Science Foundation (Grant No. DMR 0504769, DMR 0301166, DMR 0244058 (MSU) and DMR 0404505 (Washington University)). Work at ANL is supported by the Department of Energy under Contract No. W-31-109-ENG-38.References
- (1) J. S. Slusky, N. Rogado, K. W. Reagan, M. A. Hayward, P. Khalifah, T. He, K. Inumaru, S. Loureiro, M. K. Hass, H. W. Zandbergen, and R. J. Cava, Nature , 343 (2001).
- (2) J. M. An and W. E. Pickett, Phys. Rev. Lett. , 4366 (2001).
- (3) A. F. Goncharov and V. V. Struzhkin, Physica C , 117 (2003).
- (4) A. Mialitsin, B. S. Dennis, N. D. Zhigadlo, J. Karpinski, and G. Blumberg, unpublished.
- (5) A. V. Pogrebnyakov, J. M. Redwing, S. Raghavan, V. Vaithyanathan, D. G. Schlom, S. Y. Xu, Q. Li, D. A. Tenne, A. Soukiassian, X. X. Xi, M. D. Johannes, D. Kasinathan, W. E. Pickett, J. S. Wu, and J. C. E. Spence, Phys. Rev. Lett. , 147006 (2004).
- (6) Y. Wang, T. Plackowski, and A. Junod, Physica C , 179 (2001).
- (7) F. Bouquet, R. A. Fisher, N. E. Phillips, D. G. Hinks, and J. D. Jorgensen, Phys. Rev. Lett. , 47001 (2001).
- (8) R. A. Fisher, G. Li, J. C. Lashley, F. Bouquet, N. E. Phillips, D. G. Hinks, J. D. Jorgensen, and G. W. Crabtree, Physica C , 180 (2003).
- (9) J. D. Jorgensen, D. G. Hinks, and S. Short, Phys. Rev. B , 224522 (2001); J. D. Jorgensen, D. G. Hinks, P. G. Radelli, W. I. F. David, and R. M. Ibberson, cond-mat/0205486.
- (10) Y. Xue, S. Asada, A. Hosomichi, S. Naher, J. Xue, H. Kaneko, H. Suzuki, T. Muranaka, and J. Akimitsu, J. Low Temp. Phys. , 1105 (2005).
- (11) R. Lortz, C. Meingast, D. Ernst, B. Renker, D. D. Lawrie, and J. P. Franck, J. Low Temp. Phys. , 1101 (2003).
- (12) D. G. Hinks, J. D. Jorgensen, H. Zheng, and S. Short, Physica C , 166 (2002).
- (13) T. Tomita, J. J. Hamlin, J. S. Schilling, D. G. Hinks, and J. D. Jorgensen, Phys. Rev. B , 92505 (2001); S. Deemyad, T. Tomita, J.J. Hamlin, B.R. Beckett, J.S. Schilling, D.G. Hinks, J.D. Jorgensen, S. Lee, and S. Tajima, Physica C , 105 (2003).
- (14) M. Kund, Uniaxiale Effekte in organischen und keramischen Supraleitern, (Harri Deutsch, Frankfurt, 1995) ISBN 3-8171-1468-0; J. J. Neumeier, unpublished.
- (15) M. Okaji, N. Yamada, H. Kato, and K. Nara, Cryogenics , 251 (1997).
- (16) F. R. Kroeger and C. A. Swenson, J. Appl. Phys. , 853 (1977).
- (17) W. Cheney and D. Kincaid, Numerical Mathematics and Computing, (Brooks/Cole, Monterey, CA, 1980), p. 100.
- (18) U. Harms, A. Serquis, R. B. Schwarz, and V. F. Nesterenko, J. Supercond. , 941 (2003); V. F. Nesterenko and Y. Gu, Appl. Phys. Lett. , 4104 (2003).
- (19) C. Meingast, J. Karpinski, E. Jilek, and E. Kaldis, Physica C , 591 (1993).
- (20) M. Kund, J. J. Neumeier, K. Andres, J. Markl, and G. Saemann-Ischenko, Physica C , 173 (1998).
- (21) G. D. Barrera, J. A. O. Bruno, T. H. K. Barron, and N. L. Allan, J. Phys. Cond. Matter , 217 (2005).
- (22) G. K. White, Cryogenics , 292 (1962).
- (23) ( - ) = 2 1x10⁻² mJ/mole K at 40 K.
- (24) N. A. Abdullaev, Phys. Sol. State , 697 (2001).
- (25) H. J. Choi, D. Roundy, H. Sun, M. L. Cohen, and S. G. Louie, Nature , 758 (2002).
- (26) S. Souma, Y. Machida, T. Sato, T. Takahashi, H. Matsui, S.-C. Wang, H. Ding, A. Kaminski, J. C. Campuzano, S. Sasaki, and K. Kadowaki, Nature , 65 (2003).